. 2025 Sep;44(18):5149-5186.
doi: 10.1038/s44318-025-00514-0. Epub 2025 Aug 11.

Tau uptake by human neurons depends on receptor LRP1 and kinase LRRK2

Affiliations

Tau uptake by human neurons depends on receptor LRP1 and kinase LRRK2

Lewis D Evans et al. EMBO J. 2025 Sep.

Abstract

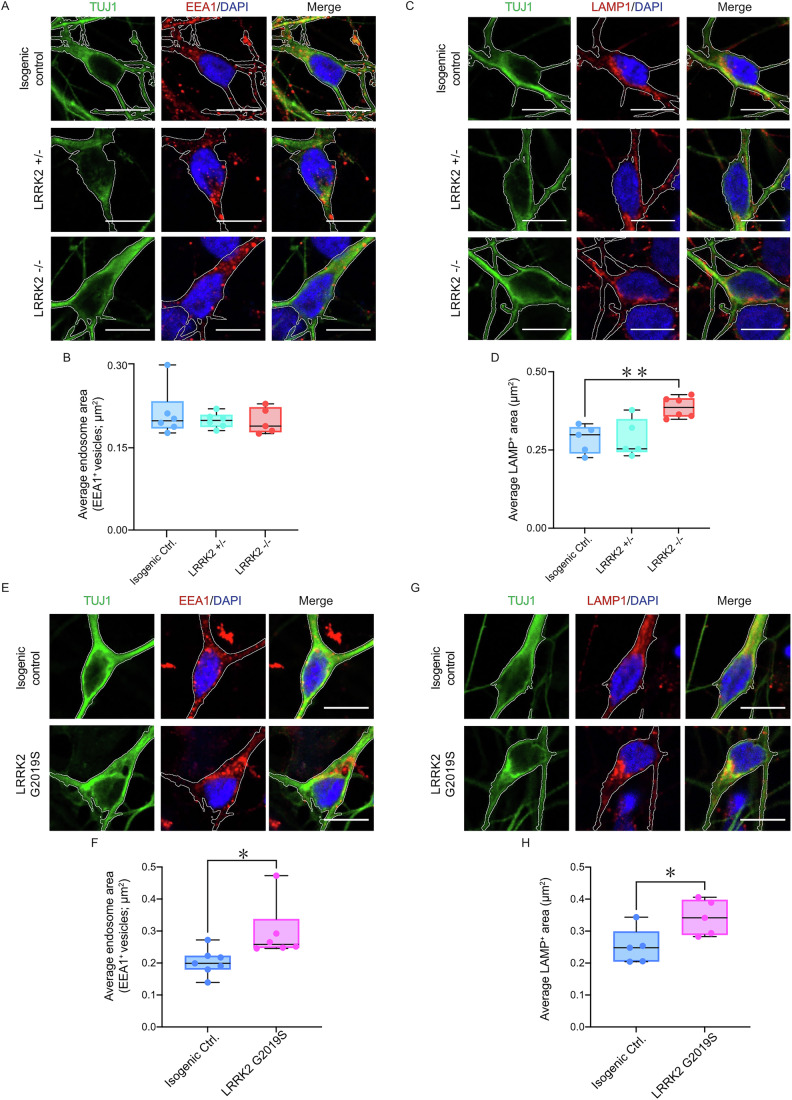
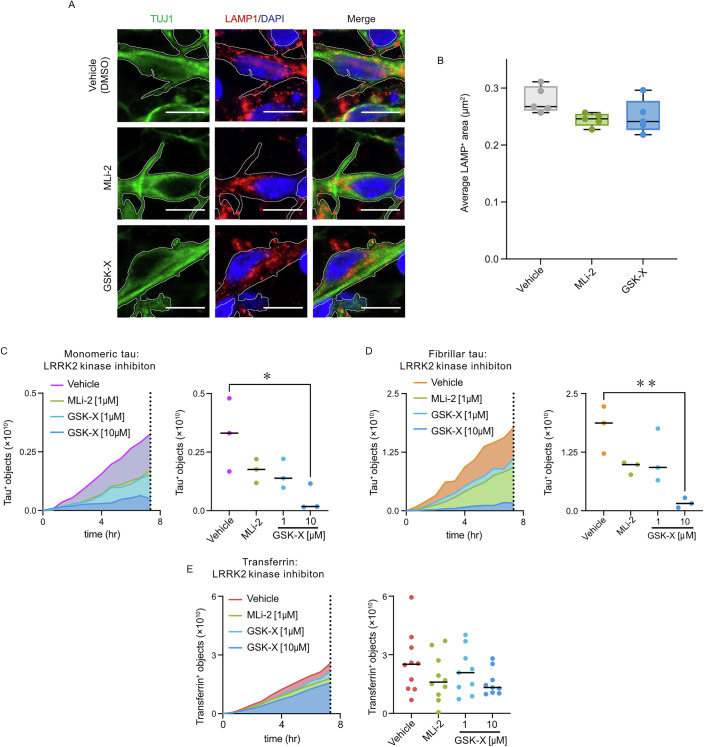
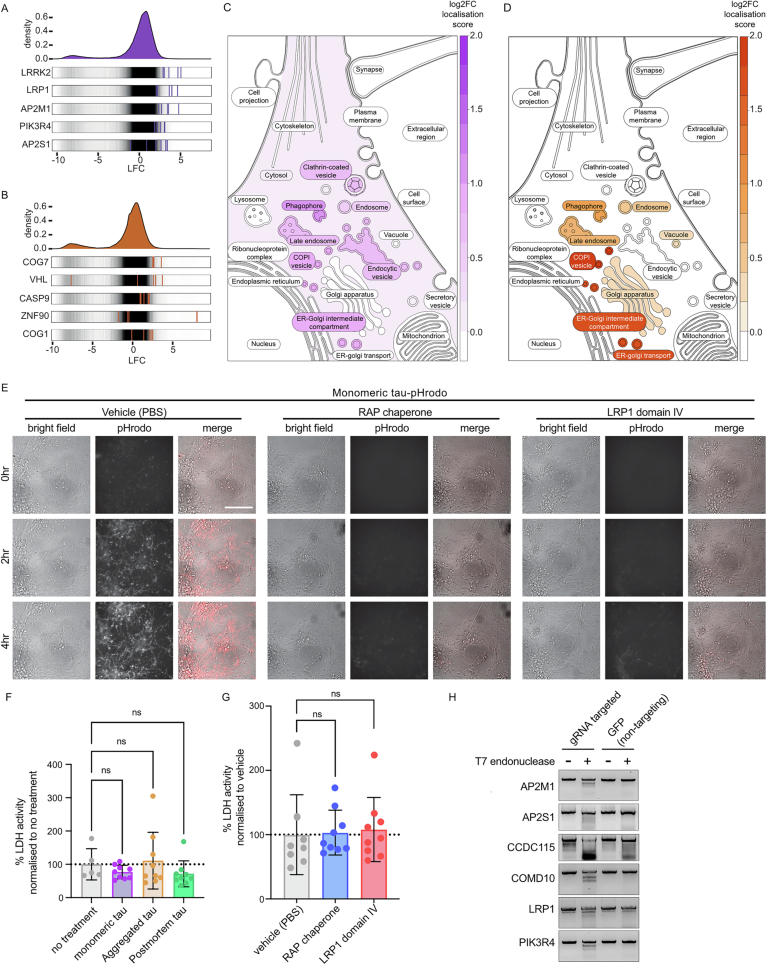
Extracellular release and uptake of pathogenic forms of the microtubule-associated protein tau contribute to the pathogenesis of several neurodegenerative diseases, including Alzheimer's disease. Defining the cellular mechanisms and pathways for tau entry to human neurons is essential to understanding tauopathy pathogenesis and enabling the rational design of disease-modifying therapeutics. Here, whole-genome, loss-of-function CRISPR screens in human iPSC-derived excitatory neurons, the major neuronal cell type affected in these diseases, provide insights into the different cellular pathways for uptake of extracellular monomeric and fibrillar tau. Monomeric and fibrillar tau are both taken up by human neurons by receptor-mediated endocytosis, but involve different routes of entry at the neuronal surface: the low-density lipoprotein LRP1 is the primary receptor for monomeric tau, but contributes less to fibrillar tau entry. Similarly, endocytosis of monomeric tau is dependent on the familial Parkinson's disease gene LRRK2, but not required for endocytosis of fibrillar tau. These findings implicate LRP1 and LRRK2 in the pathogenesis of tauopathies and Parkinson's disease, and identify LRRK2 as a potential therapeutic target for altering progression of these diseases.

Keywords: Alzheimer’s Disease; CRISPR; Functional Genomics; Human iPSCs; Parkinson’s Disease.


Conflict of interest statement

Disclosure and competing interests statement. Open Targets is a public–private partnership between non-profit research institutions and the pharmaceutical industry. FJL is a founder and holds equity in Gen2 Neuroscience and Talisman Therapeutics.

Figures

Figure 1
Figure 1. FACS-based CRISPR knockout screens in human neurons to identify genes and pathways required for uptake of extracellular tau.
(A) Design of whole-genome CRISPR knockout screens for uptake of tau by human iPSC-derived neurons. (B) Representative confocal microscopy images confirming the cortical, excitatory identity of differentiated human (KOLF2-C1) iPSC-derived neurons, constitutively expressing Cas9 protein and the isogenic control. Upper panels, neurons immunolabelled for TUJ1 (neuron-specific β3-tubulin; red), MAP2 (neuronal dendrites; green), TBR1 (deep layer neurons; magenta) and DAPI (nuclear DNA; blue). Lower panels, neurons immunolabelled for MAPT (tau protein; red), MAP2 (green), CTIP2 (deep layer neurons; magenta) and DAPI (blue). Scale bar, 50 μm. (C) iPSC-derived cortical neural progenitor cells and neurons retain Cas9 activity after differentiation. Scatter plot of FACS measuring Cas9 activity using a lentiviral Cas9-activity reporter, expressing mCherry and GFP. Left panel, iPSC-derived neurons (parental control line) transduced with lentiviral reporter but not expressing Cas9, middle panel neurons expressing Cas9 without lentiviral reporter and right panel neurons expressing Cas9 with lentiviral reporter. (D) FACS analysis of the percentage of GFP gene-edited neurons against days after reporter infection, measured using the reporter system described in (C). Data shown from one representative experiment. (E, F) Transferrin does not compete with or alter extracellular tau uptake by human excitatory neurons. Human iPSC-derived neurons were incubated with monomeric (E; purple) or fibrillar (F; orange) tau protein (Dylight 488 labelled) and transferrin (Alexa 633 conjugate; concentrations indicated) and analysed by flow cytometry. Neurons without tau or transferrin incubation (light blue) were used to establish the threshold level for detection of tau-Dylight fluorescence. Percentage of monomeric or fibrillar tau-positive neurons at indicated transferrin concentrations plotted over time after protein incubation initiation. Data shown from one representative experiment. (G) Representative scatter plot of FACS analysis of population of neurons from typical screen outcome, highlighting neurons expressing gRNAs (gated on BFP signal) that are tau-negative but transferrin-positive (dashed red line) and tau-positive and transferrin-positive (dashed black line). See also Fig. EV1.
Figure 2
Figure 2. CRISPR loss of function screens identify genes and pathways required for human neuronal uptake of extracellular monomeric and fibrillar tau.
Genes required for uptake of tau into human iPSC-derived excitatory neurons identified by comparing FACS collected populations of CRISPR edited neurons, positive for labelled transferrin, but not tau protein, against neurons positive for both labelled proteins. Whole-genome enrichment score (−log10 positive score) is plotted against the positive enrichment ranking from the knockout screens for tau uptake derived using the MAGeCK algorithm. Applying a p value cut-off of 0.01, 214 genes were identified as required for (A) monomeric tau uptake (purple points; two biological replicates) and 228 genes were identified as required for (C) fibrillar tau uptake (orange points; three biological replicates). The ten highest-scoring genes are labelled. Heat maps showing a representative selection of significantly enriched terms annotating the genes required for (B) monomeric and (D) fibrillar tau uptake. Grayscale indicates significance level (−log10 FDR). Rows are sorted in order of significance; see Dataset EV1 for ranked genes required for tau uptake (p < 0.01). Each heatmap shows which of the enriched genes is annotated with each term (Dataset EV2). Details of p values for each enriched term are provided in Dataset EV2. (E) Scatter plot of FACS analysis of monomeric tau and transferrin uptake by iPSC neurons individually targeted for CRISPR knockout of AP2M1 or non-targeting control (GFP). (F) Validation of genes identified in primary screens as required for monomeric tau uptake. The percentage of low tau neurons (tau-/transferrin+) is expressed as fold change from the non-targeting control (GFP). Three technical replicates were performed, across two independent experiments, represented by circles and triangles. CRISPR knockout of LRP1 and a non-targeting control (GFP) was included in both experiments (Dataset EV5). Statistical significance was determined using one-way ANOVA, Dunnett’s test for multiple comparisons (all gene perturbations presented p < 0.0001, except CCDC115 p = 0.0017). (GI) Entry of monomeric tau into neurons is mediated by LRP1, inhibited by the addition of extracellular RAP chaperone or LRP1 domain IV peptide. The number of tau-positive objects detected over 4 h by time-lapse imaging of iPSC-derived human excitatory neurons was used to assess neuronal uptake of monomeric (A), fibrillar (B) or post-mortem AD brain (C) tau-pHrodo. Object measurements are displayed over time. Twenty-four independent measurements were taken from at least three technical replicates at 45-min intervals. Statistical significance was determined using one-way ANOVA, Dunnett’s test for multiple comparisons (monomeric tau uptake with RAP chaperone *p =  0.0228; LRP1 domain IV *p = 0.0152). See also Fig. EV2.
Figure 3
Figure 3. Uptake mechanisms of monomeric and fibrillar tau differ at the neuronal surface but share intracellular trafficking pathways.
(A) Monomeric and fibrillar tau share common intracellular pathways for neuronal entry. Genes identified as required for monomeric or fibrillar tau uptake are significantly overlapping (hypergeometric test, p < 0.001). The 11 genes identified in both screens are shown on the right side. (B) Subunits of protein complexes that are significantly enriched in the combined set of genes required for uptake of either form of tau. The colour indicates the positive enrichment score in the monomeric (M) and fibrillar (F) screens, respectively. Only subunits identified as required in either screen are shown (orange if identified in fibrillar screens, purple if identified in monomeric screens, bold green if identified in both). FDR <0.05 (*), <0.01 (**), <0.001 (***), with significance determined by a hypergeometric test implemented in gProfiler2 (see methods for details). C Positions of genes identified as significantly enriched in our CRISPR screens in the cellular compartments associated with the gene-encoded proteins, using the COMPARTMENTS dataset (FDR <0.05). Genes influencing uptake of monomeric (purple), fibrillar (orange) or both (green) forms of tau are ordered using the positive enrichment ranking for each cellular compartment, where appropriate genes appear in multiple compartments. See also Fig. EV3; Dataset EV3.
Figure 4
Figure 4. Neuronal uptake of extracellular tau shares functional similarities with endocytic pathways involved in viral entry.
(A, B) Effect of endocytosis and PI3-kinase activity inhibition on neuronal uptake of extracellular monomeric (A) and fibrillar tau-pHrodo (B). Neurons were pre-incubated with either 100 μM Dynasore, 1 μM PIK93, 0.1 μM wortmannin or vehicle control (0.1% [v/v] DMSO) for 1 week, before addition of tau-pHrodo. pHrodo-positive objects were counted over 10 h at 45-min intervals. Object measurements are displayed over time and scatter plots of the final time point (dashed line) are shown; bars indicate mean. Four wells per treatment, and at least 20 fields of view per well. (C, D) Effect of autophagy and vesicular transport inhibition on neuronal uptake of extracellular monomeric (C) and fibrillar tau-pHrodo (C) into low-pH compartments. Neurons were pre-incubated for 24 h with either 1 μM Brefeldin, 0.1 μM Bafilomycin A or vehicle control (0.1% [v/v] DMSO) using the same experimental conditions and parameters as in (A). The number of pHrodo-positive objects was measured as in (E-F; seven wells per treatment). Statistical significance was determined using one-way ANOVA, Dunnett’s test for multiple comparisons (monomeric/fibrillar tau uptake with 100 μM Dynasore **p = 0.0013/ *p = 0.00153; 1 μM PIK93 *p = 0.0128/*p = 0.0239; 0.1 μM wortmannin **p = 0.0031/*p = 0.016; 1 μM Brefeldin **p = 0.0023/ns; 0.1 μM Bafilomycin A ***p = 0.0001/**p = 0.0067). (E) The sets of genes required for human neuronal uptake of monomeric, fibrillar or either form of tau significantly overlap with the sets of genes required for receptor-mediated endocytosis of Influenza A, Zika and SARS-CoV-2 viruses, but not macropinocytosis of Ebola virus. Gene sets required for entry were defined from their respective screens using a threshold of FDR <0.05, and hypergeometric tests were used to evaluate the significance of overlap between gene sets (FDR-corrected p* < 0.05, p** < 0.01, p*** < 0.001). (F) Diagram of cellular compartments showing genes shared between tau uptake (FDR <0.05) and viral entry screens and their predicted roles in tau uptake and virus life cycle. Genes are marked by a shape corresponding to Influenza A virus (diamond), Zika (circle) or SARS-CoV-2 virus entry (square) and coloured according to monomeric (purple), fibrillar (orange) or either form of tau (green). See also Fig. EV4; Dataset EV4.
Figure 5
Figure 5. LRRK2 gain and loss of function mutations affect the endolysosomal system in excitatory neurons.
(A) LRRK2 heterozygous and homozygous knockout neurons do not exhibit an endosomal phenotype. Representative immunohistochemistry of neurons from isogenic control, heterozygous (+/−) and homozygous (−/−) LRRK2 knockout human iPSCs (60 days after induction), immunostained for neuronal β3-tubulin (TUJ1, green), early endosomes (EEA1, red) and nuclei were counterstained (DAPI, blue). Scale bar, 10 μm. (B) No significant changes in the average size of early endosomes (EEA positive vesicles; μm2) in heterozygous and homozygous (null) LRRK2 knockout neurons compared with isogenic control (n = >5 images, one-way ANOVA, Dunnett’s test for multiple comparisons). Box plot line represents median, box covers the interquartile interval and whiskers represent min to max. (C) LRRK2 homozygous knockout neurons display accumulation of LAMP1+ vesicles, including late endosomes, lysosomes and autolysosomes. Representative immunohistochemistry of neurons from isogenic control, heterozygous (+/−) and homozygous (−/−) LRRK2 knockout human iPSCs (60 days after induction), immunostained for neuronal β3-tubulin (TUJ1, green), LAMP1 (red) and nuclei were counterstained (DAPI, blue). Scale bar, 10 μm. (D) Significant increase in average late endosome/lysosome/autolysosome area (LAMP1 positive vesicles; μm2) in homozygous LRRK2 knockout neurons compared with isogenic controls (n = >5 images; one-way ANOVA, Dunnett’s test for multiple comparisons; **p = 0.006). Box plot line represents median, box covers the interquartile interval and whiskers min to max. (EH) Neurons heterozygous for the LRRK2 G2019S mutation display accumulation of LAMP1+ vesicles, including late endosomes, lysosomes and autolysosomes. Representative confocal images of human iPSC neurons from isogenic control and with LRRK2 G2019S mutation (heterozygous; 60 days after induction), immunostained for neuronal β3-tubulin (TUJ1, green), (E) endosomes (EEA1, red) or (G) LAMP1 (red) and nuclei were counterstained (DAPI, blue). Scale bar, 10 μm. Significant increase in average area of early (F; Student’s t-test *p = 0.0298) and late endosomes/lysosomes (H) (EEA1/LAMP1 positive vesicles; μm2) in LRRK2 G2019S neurons compared with isogenic controls (n = >5 images). Box plot line represents median, box covers the interquartile interval and whiskers represent min to max.
Figure 6
Figure 6. LRRK2 gain and loss of function mutations affect uptake of extracellular tau, a-synuclein and a-beta.
Neurons with LRRK2 gain and loss of function mutations differ in their ability to take up extracellular proteins involved in neurodegeneration. Isogenic control, LRRK2 heterozygous (−/+), homozygous (−/−) null or LRRK2 G2019S mutant neurons (65 days after induction) were incubated with 90 nM transferrin (Tfn) Alexa 633 nm and either monomeric wild-type (A), monomeric P301S (B) or fibrillar P301S (C) tau Dylight 488 nm for 4 h before dissociation into single cells and analysis by flow cytometry. Neurons from each of the genotypes were also incubated with α-synuclein (D), β-amyloid (1–42) (E) HiLyte 488 nm or epidermal growth factor (EGF) Fluorescein 488 nm (F) and analysed in the same way as the tau protein derivatives. For each genotype and cell line indicated, the percentage of low protein uptake in transferrin-positive neurons (indicated by the black outlined boxes) was compared to the mean (dashed line) of protein uptake of control neurons and displayed as fold change (log2). Significance was determined using one-way ANOVA with Dunnett’s test for multiple comparisons (monomeric tau WT: LRRK2 [−/− **p = 0.0053; G2019S ***p < 0.0001; monomeric tau P301S: LRRK2 [−/− **p = 0.0076; G2019S **p = 0.0064]; fibrillar tau P301S: LRRK2 G2019S ***p = 0.0002; α-synuclein: LRRK2 [+/− **p = 0.0056; −/− ***p = 0.0001; G2019S ***p = 0.0002]; β-amyloid: LRRK2 G2019S ***p = 0.0004]; EGF: LRRK2 [−/− **p = 0.0022; G2019S **p = 0.0086]). Circles, triangles and squares represent independent experiments; n = >3). See also Fig. EV6.
Figure 7
Figure 7. Inhibition of the LRRK2 kinase reduces neuronal uptake of monomeric and fibrillar tau.
(A, B) Neurons treated with LRRK2 kinase activity inhibitors do not exhibit accumulation of LAMP1+ vesicles (late endosomes, lysosomes and autolysosomes). Representative confocal images of neurons (60 days after induction) treated for 1 week with vehicle control (0.1% [v/v] DMSO), 1 μM MLi-2 or 10 μM GSK3357679A (GSK-X), immunostained for neuronal β3-tubulin (TUJ1, green), LAMP1 (red) and nuclei were counterstained (DAPI, blue). Scale bar, 10 μm. No significant changes were detected in the average area of LAMP1+ structures (μm2) in neurons treated with LRRK2 kinase activity inhibitors compared with vehicle control (n = >5 images). Box plot line represents median, box covers the interquartile interval and whiskers represent min to max. (CE) Entry of monomeric and fibrillar tau into neurons is inhibited by LRRK2 kinase inhibitors (MLi-2 and GSK-X), in a concentration-dependent manner. Human iPSC-derived neurons were pre-incubated with 1 μM MLi-2, 1 μM or 10 μM GSK-X or vehicle control (0.1% [v/v] DMSO) for one week, before acute addition of pHrodo-labelled monomeric tau (C), fibrillar tau (D) or transferrin (E). Live-imaging captured pHrodo-labelled protein uptake into low-pH compartments in neurons (65 days after induction), and the number of pHrodo-positive objects was measured over 7.3 h at 45-min intervals. Object measurements are displayed over time, and scatter plots of the final time point (dashed line) are shown; bars indicate the mean. At least three wells per treatment, and >20 fields of view per well. Significance was determined using one-way ANOVA with Dunnett’s test for multiple comparisons (monomeric/fibrillar tau with 10 μM GSK-X *p = 0.0161/**p = 0.0082). See also Fig. EV7.
Figure EV1
Figure EV1. Development and optimisation of CRISPR screens for tau uptake in human iPSC-derived excitatory neurons.
(A) Construct of KOLF2-C1 Cas9 cell line. KOLF2-C1 parent cell line genetically engineered at the AAVS1 locus to constitutively express humanised Cas9 with N-terminal FLAG tag (three repeats) and SV40 nuclear localisation signal (NLS) and C-terminal nucleoplasmin NLS from CAG promoter (CMV/chicken β-actin promoter). (B) Gene expression analysis of iPSC-derived neuronal progenitor cells from KOLF2-C1 (parental line) and KOLF2-C1 Cas9 (constitutively expressing Cas9), 35 days after induction. Selected genes whose expression is specific or enriched in particular regions and/or cell types are shown from a panel of 200 genes (see Experimental Procedures for details). (C) Analysis of the proportion of MAP2-positive KOLF2-C1 Cas9 neurons 60 days after induction. Neurons were dissociated into single cells and immunostained using MAP2 antibody conjugated to PE and analysed by flow cytometry. To establish threshold levels for MAP2-positive neurons (bold horizontal bar), unstained control neurons were analysed. (D, E) Optimising the concentration of tau protein to achieve saturating levels of extracellular tau uptake during acute treatment, measured by flow cytometry. Graph reports percentage of tau-positive neurons over time after tau incubation initiation, with concentration of tau protein as indicated. Data are shown from one representative experiment. (F) Percentage of whole-genome CRISPR gRNA library lentivirus-transduced (BFP+) neurons in tau uptake FACS screens. A monomeric tau uptake screen was carried out in duplicate, and a fibrillar tau uptake screen in triplicate. (G) Total number of lentivirus-transduced (BFP+) neurons collected by flow cytometry in each screen (left axis) and corresponding library coverage (n. cells/n. gRNAs) (right axis). (H) Percentage of lentivirus-transduced neurons collected from monomeric and fibrillar tau uptake screens that are transferrin positive and tau negative. (I) Total number of transferrin-positive, tau-negative lentivirus-transduced neurons collected by flow cytometry in each screen (left axis) and corresponding library coverage (n. cells/n. gRNAs) (right axis). (J) Distribution of median normalised log2 guide RNA counts from transferrin positive and either tau positive (+) or negative (−) neurons collected from monomeric (purple; two screens) and fibrillar (orange; three screens) tau uptake screens. (K) Percentage of CRISPR gRNA detected in transferrin-positive and either tau-positive (POSPOS) or negative (NEGPOS) neurons collected from tau uptake FACS screens.
Figure EV2
Figure EV2. Identification of genes involved in the uptake of structurally distinct forms of tau by human cortical neurons via low-pH intracellular compartments.
(A, B) CRISPR gRNA log fold change (LFC) between transferrin positive and either tau positive (+) or negative (−) neurons collected from monomeric (A) and fibrillar (B) tau uptake screens analysed using the MAGeCK algorithm. Guides for the five highest-ranked genes (gene names indicated) are highlighted on the guide density plots. Genes required for uptake of monomeric (C), fibrillar (D) tau code for proteins with a significantly higher than random localisation score in particular cellular compartments in the COMPARTMENTS dataset (FDR <0.05). Significantly enriched compartments are coloured based on the strength of enrichment (log2 fold change), whereas non-significant compartments are left white. (E) Time-lapse (0- to 4-h) images showing uptake into iPSC-derived human neurons (60 days after induction) of extracellular monomeric tau conjugated to a pH-sensitive dye (inverse relationship between fluorescence and pH). Neurons and tau protein were individually pre-incubated with either 10 nM RAP chaperone, 100 nM LRP1 domain IV peptide or vehicle control (PBS) for 3 h prior to combining the tau incubations with neurons and live imaging of neuronal uptake of tau. Bright-field (grey scale in merge) and pH-sensitive fluorescent signal (pHrodo; red in merge) were captured using automated imaging on the Opera-Phenix platform (Perkin Elmer). Scale bar, 100 μm. (F) None of the forms of tau were acutely toxic to neurons over a 16 hr period, as measured by extracellular LDH activity (three wells per treatment), in the presence of 25 nM Monomeric tau, 150 nM (monomer molar equivalent) fibrillar or post-mortem tau. (G) Extracellular LDH activity was also used to determine neuronal viability in the presence of vehicle (PBS), 10 nM RAP chaperone or 100 nM LRP1 domain IV peptide (after treatment for one week; >8 wells per treatment, across two biological replicates). Error bars indicate SD. Significance was determined using one-way ANOVA (∗p < 0.05, ∗∗p < 0.01, Dunnett’s test for multiple comparisons). (H)The T7 endonuclease assay was used to confirm CRISPR guide RNA targeting. Assays were performed on amplified genomic DNA regions containing the target site for CRISPR gRNAs to genes indicated in the presence of targeting gRNA and the non-targeting GFP control.
Figure EV3
Figure EV3. Comparison of genes required for monomeric and fibrillar tau entry by human cortical neurons.
(A) Heat map showing a representative selection of significantly enriched terms annotating the 431 genes significantly enriched for either monomeric or fibrillar tau uptake. The black colour scale indicates the significance level (−log10 FDR). Rows are sorted in order of significance, also see Dataset EV3. The central heatmap shows which of the enriched genes is annotated with each term. (B) PSICQUIC-derived network of experimentally validated physical interactions between proteins encoded by genes identified in either screen. Nodes are colour-coded depending on whether the corresponding gene was identified as required for monomeric (purple) or fibrillar (orange) tau uptake, or both (green). Some notable complexes are highlighted with circles. Interactions disconnected from the main network are not included. (C) The direct interactors of LRRK2, the most connected node, are highlighted in the protein interaction network; indirect interactions and genes unconnected to LRRK2 appear in grey. (D) Genes required for uptake of either monomeric or fibrillar tau code for proteins with a significantly higher than random localisation score in particular cellular compartments in the COMPARTMENTS dataset (FDR <0.05). Significantly enriched compartments are coloured based on the strength of enrichment (log2 fold change), whereas non-significant compartments are left white.
Figure EV4
Figure EV4. Cellular mechanisms for tau uptake and processing by human excitatory neurons in relation to endocytosis and viral entry, CRISPR screens.
(A) Extracellular LDH activity was used to determine neuronal viability in the presence of vehicle (0.1% [v/v] DMSO), 100 µM Dynasore, 1 µM PIK93 or 0.1 µM Wortmannin (after treatment for one week) (B), and for 1 µM Brefeldin or 0.1 µM Bafilomycin A (after treatment for 24 hr) (I). Only Bafilomycin A had a modest effect on neuronal viability (ten wells per treatment). Error bars indicate SD. Significance was determined using one-way ANOVA (∗p < 0.05, ∗∗p < 0.01, Dunnett’s test for multiple comparisons). (C) Neuronal uptake of tau protein requires cargo-specific endocytic adaptors. Comparison of sets of genes required for tau uptake with genes identified in screens for endocytosis of either transferrin or epidermal growth factor (EGF), shows significant overlap between monomeric tau uptake and transferrin endocytosis, but no other significant overlaps between the gene sets. (D) Genes involved in tau uptake do not significantly overlap with sets of genes identified as phagocytosis regulators in screens performed with distinct substrates, varying in their diameter (μm) and charge. (E) Heatmap showing functional annotations enriched among genes required for the uptake of either form of tau and Influenza A, Zika or SARS-CoV-2 virus entry (representative term selection). (F) Genes required for either monomeric or fibrillar tau uptake and Influenza A, Zika or SARS-CoV-2 viral entry code for proteins with a significantly higher than random localisation score in particular cellular compartments in the COMPARTMENTS dataset (FDR <0.05). Significantly enriched compartments are coloured based on the strength of enrichment (log2 fold change), whereas non-significant compartments are left white.
Figure EV5
Figure EV5. Neuronal gene expression and LRRK2 protein levels in iPSC-derived cortical neurons with LRRK2 gain and loss of function mutations.
(A, B) Gene expression (Nanostring) analysis of iPSC-derived neuronal progenitor cells from KOLF2-C1 (parental line; Isogenic control), LRRK2 heterozygous null (LRRK2 −/+), LRRK2 homozygous null (LRRK2 −/−) and LRRK2 heterozygous G2019S, 35 (A) and between 64–76 (B) days after induction. Selected genes whose expression is specific or enriched in particular regions and/or cell types are shown from a panel of 200 genes (see Experimental Procedures for details), demonstrating that the inductions generated primarily cortical progenitor cells, with some ventral interneuron progenitor cells, which subsequently generate excitatory and inhibitory neurons. (C) LRRK2 protein levels in iPSC from KOLF2-C1 (parental line; Isogenic control), LRRK2 heterozygous null (LRRK2+/−), LRRK2 homozygous null (LRRK2−/−) and LRRK2 heterozygous G2019S, measured by AlphaLISA assay (see Methods for details; at least two wells per genotype). LRRK2 +/− cells have reduced LRRK2 protein relative to the parental cell, whereas LRRK2 −/− cells have protein around the detection threshold of the assay.
Figure EV6
Figure EV6. Uptake of transferrin and dextran by LRRK2 gain and loss of function mutation-expressing neurons.
(A) Flow cytometry gating strategy for detection of transferrin and indicated cargo protein uptake into iPSC-derived isogenic control neurons (65 days after induction). Left panels show discrimination based on scatter parameters of neurons incubated with either no treatment (red) or extracellular transferrin (green), monomeric tau (orange) or fibrillar tau (blue). Black polygons and bold horizontal bars indicate gates applied to isolate the population of single neurons that endocytose transferrin. To establish threshold levels for positive protein uptake (bold horizontal bars), neurons without transferrin (red) or tau (green contours) incubation were analysed. (B) Fluorescent intensity of either monomeric or fibrillar Dylight 488 nm low tau protein uptake populations are indicated by black polygons. (C) Isogenic control, LRRK2 heterozygous (+/−), homozygous (−/−) null or LRRK2 G2019S mutant neurons (65 days after induction) were incubated with 90 nM transferrin (Tfn) Alexa 633 nm or Dextran Fluorescein 488 nm (D) for 4 h before dissociation into single cells and analysis by flow cytometry. For each genotype and cell line indicated, the percentage of cells with low protein uptake (indicated by the black outlined polygons) was compared to the mean (dashed line) of protein uptake of control neurons and displayed as fold change (log2). Significance was determined using one-way ANOVA (∗p < 0.05, ∗∗p < 0.01, Dunnett’s test for multiple comparisons; circles and triangles represent independent experiments; n = >3). (EG) Biological replicate flow cytometry assays of the effect of LRRK2 G2019S mutation on neuronal uptake of extracellular tau. Isogenic control and LRRK2 G2019S mutant neurons (65 days after induction) were incubated with 90 nM transferrin (Tfn) Alexa 633 nm and either monomeric wild-type (E), or fibrillar P301S (F) tau Dylight 488 nm, or transferrin alone (G), for 4 h before dissociation into single cells and analysis by flow cytometry (Thermo Fisher Attune CytPix). For LRRK2 G2019S mutant neurons, the percentage of cells with low protein uptake (in neurons gated for transferrin uptake) was compared to the mean (dashed line) of protein uptake of control neurons and displayed as fold change (log2). Significance was determined using an unpaired t-test (∗∗∗p < 0.001; n = 4 for controls and n = 12 for LRRK2 G2019S; neurons generated from two and four independent neural inductions from control and LRRK2 G2019S iPSCs, respectively). (H) LRRK2 homozygous null neurons have increased levels of tau receptor protein LRP1 at the neuronal surface compared with isogenic controls. LRRK2 heterozygous and homozygous null neurons (60 days after induction) were surface biotinylated, and Neutravidin-coated particles were used to capture biotinylated membrane proteins. Surface abundance of indicated proteins were measured by immunoblotting. (I) Cell surface levels of LRP1 normalised to N-cadherin are shown for each genotype. Significance was determined using one-way ANOVA (∗p < 0.05, ∗∗p < 0.01, Dunnett’s test for multiple comparisons, n = 3).
Figure EV7
Figure EV7. Effect of LRRK2 kinase activity inhibitors on the endolysosomal system of human cortical neurons.
(A, B) Neurons treated with LRRK2 kinase activity inhibitors do not exhibit an endosomal or lysosomal phenotype. (A) Representative immunohistochemistry of neurons (60 days after induction) treated for 1 week with vehicle control (0.1% [v/v] DMSO), 1 μM MLi-2 or 10 μM GSK-X, immunostained for neuronal β3-tubulin (TUJ1, green), early endosomes (EEA1; red) and nuclei were counterstained (DAPI, blue). Scale bar, 10 μm. (B) No significant changes in the average size of early endosomes (EEA positive vesicles; μm2) in neurons compared with isogenic control (n = >5 images). (C) Extracellular LDH activity was used to assess neuronal viability in the presence of vehicles (0.1% [v/v] DMSO), 1 μM MLi-2, 1 μM or 10 μM GSK-X (GSK3357679A; treatment for 1 week). Only 1 μM MLi-2 had a modest effect on neuronal viability (six wells per treatment). Error bars indicate SD. Significance was determined using one-way ANOVA (∗p < 0.05, Dunnett’s test for multiple comparisons). (D) Effect of inhibition of LRRK2 kinase activity on neuronal surface levels of tau receptor protein LRP1. Neurons were pre-incubated with either 1 μM MLi-2, 10 μM GSK-X or vehicle control (0.1% [v/v] DMSO) for one week prior to cell surface biotinylation (61 days after induction), followed by capture of biotinylated membrane proteins using Neutravidin-coated particles. Surface abundance of indicated proteins were examined by immunoblotting. (E) Cell surface levels of LRP1 normalised to N-cadherin are shown for each of the treatments (three replicate treatments).

References

    1. Almende BV, Thieurmel B, Robert T (2022) visNetwork: network visualization using ‘vis.js’ library. R package version 2.0.9.
    1. Aranda B, Blankenburg H, Kerrien S, Brinkman FSL, Ceol A, Chautard E, Dana JM, De Las Rivas J, Dumousseau M, Galeota E et al (2011) PSICQUIC and PSISCORE: accessing and scoring molecular interactions. Nat Methods 8:528–529 - DOI - PMC - PubMed
    1. Asai H, Ikezu S, Tsunoda S, Medalla M, Luebke J, Haydar T, Wolozin B, Butovsky O, Kügler S, Ikezu T (2015) Depletion of microglia and inhibition of exosome synthesis halt tau propagation. Nat Neurosci 18:1584–1593 - DOI - PMC - PubMed
    1. Bartuzi P, Billadeau DD, Favier R, Rong S, Dekker D, Fedoseienko A, Fieten H, Wijers M, Levels JH, Huijkman N et al (2016) CCC- and WASH-mediated endosomal sorting of LDLR is required for normal clearance of circulating LDL. Nat Commun 7:10961 - DOI - PMC - PubMed
    1. Behan FM, Iorio F, Picco G, Gonçalves E, Beaver CM, Migliardi G, Santos R, Rao Y, Sassi F, Pinnelli M et al (2019) Prioritization of cancer therapeutic targets using CRISPR-Cas9 screens. Nature 568:511–516 - DOI - PubMed

MeSH terms

Substances

LinkOut - more resources