. 2025 Jul-Aug;177(4):e70452.
doi: 10.1111/ppl.70452.

Endonuclease Genes in Rice Are Involved in Phosphate Source Recycling by DNA Decay From Phosphate Deprivation

Affiliations

Endonuclease Genes in Rice Are Involved in Phosphate Source Recycling by DNA Decay From Phosphate Deprivation

Yun-Shil Gho et al. Physiol Plant. 2025 Jul-Aug.

Abstract

Enhancing phosphate use efficiency (PUE) has been a longstanding challenge in agriculture, as phosphate (Pi) is a crucial component of key organic molecules such as RNA, DNA, and ATP. In this study, we performed a comprehensive phylogenetic analysis of four rice and five Arabidopsis Endonuclease (ENDO) genes, which encode bifunctional nucleases capable of acting on both RNA and DNA. Our analysis revealed three distinct groups of ENDO genes: common, monocot-specific, and dicot-specific, indicating both functional conservation and diversification among monocot and dicot species. Interestingly, we found that only the monocot-specific group of rice ENDO genes exhibited differential regulation in response to P deficiency, a response not observed in Arabidopsis. Additionally, overexpression of OsPHR2, a central regulator of P homeostasis, resulted in increased DNA fragmentation and degradation, along with upregulation of OsENDO3 and OsENDO4. Transient expression assays further demonstrated that OsPHR2 activates both OsENDO3 and OsENDO4, suggesting that P-starved conditions trigger the expression of two OsPHR2-dependent rice ENDO genes. Overall, our findings suggest that OsENDO3 and OsENDO4 play a role in recycling P sources by regulating DNA decay under P deficient conditions. This insight could have significant implications for improving P use efficiency in agriculture, addressing a critical and enduring agricultural challenge.

Keywords: DNA degradation; endonuclease; phosphate recycling; phosphate starvation; rice.


Figures

FIGURE 1
FIGURE 1
Illustrates a phylogenetic tree generated using the neighbor‐joining method, depicting the distribution of Endonuclease (ENDO) family proteins across four monocot plants [ Brachypodium distachyon (five genes), rice (four genes), Sorghum bicolor (five genes), and Z. mays (four genes)] and three dicot plants [Arabidopsis (five genes), Glycine max (eight genes), and S. lycopersicum (three genes)]. The analysis revealed three distinct groups: Group I include ENDO proteins present in both monocots and dicots, marked by an orange vertical line; Group II comprises Dicot‐specific ENDO proteins, indicated by a green vertical line; and Group III consists of Monocot‐specific ENDO proteins, marked by a blue vertical line. The phylogenetic tree construction was performed using MEGA 11 under the neighbor‐joining method.
FIGURE 2
FIGURE 2
Transcriptome analysis was conducted on four rice ENDO genes and five Arabidopsis ENDO genes under Pi starvation using publicly available RNA‐seq data and microarray data (A). The average normalized three FPKM values and three intensity values of ENDO genes from RNA‐seq and microarray data were presented. In this Average of normalized intensity values, blue represents the lowest level of gene expression, while yellow represents the highest level of expression. Additionally, heat maps were generated to visually represent the differential expression levels under two conditions: −P/+P: Log2(Pi‐deficient conditions)/(Pi‐sufficient condition)) and Re/−P: Log2(Pi‐resupply condition)/ (Pi‐deficient conditions). In the Log2 fold change value heat maps, red indicates up‐regulation of gene expression, while green indicates down‐regulation. The expression analysis of four rice ENDO genes under Pi starvation conditions [+P (0.320 mM), –P (0 mM)] using qRT‐PCR. The X‐axis represents the tissues and conditions utilized for the qPCR analysis, while the Y‐axis indicates the relative expression level compared to that of OsUbi5 (B). The values are presented as means ± SE (n = 4), and asterisks denote significant differences (p < 0.05) in expression compared to the Pi‐sufficient condition. Statistical significance levels are denoted as ***p < 0.001, **p < 0.01, and *p < 0.05, based on a t‐test.
FIGURE 3
FIGURE 3
Subcellular localization of the rice OsENDO proteins in tobacco leaves using laser scanning confocal fluorescence microscopy. (A) Left panels shows green fluorescence in tobacco epidermal cells in leaves infiltrated with four OsENDO‐green fluorescence protein (GFP) fusion proteins, the center panels shows RFP fluorescence in tobacco epidermal cells in leaves infiltrated with mCherry fused HDEL protein (mCherry::HDEL), and the right panel shows the merged images from GFP and RFP field. The red signal shows the endoplasmic reticulum (ER). Yellow signals show a merged image from the OsENDO protein localizations and ER signal. (B) Confocal images of a tobacco leaf epidermal cell showing colocalization of GFP::OsENDO proteins (left), Calcofluor White (central) and merge (right). The red signal shows the cell wall. Yellow signals show a merged image from the OsENDO protein localizations and cell wall signal. (C) Confocal images of a tobacco leaf epidermal cell showing colocalization of GFP::OsENDO proteins (left), NLS::MCherry (central) and merge (right). The red signal shows the nucleus. Yellow signals show a merged image from the OsENDO protein localizations and nucleus signal. Scale bar = 10 μm.
FIGURE 4
FIGURE 4
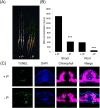
Morphological appearance of wild type ( Oryza sativa L. cv. Dongjin) grown for 21 d on Pi‐sufficient (+P (0.320 mM)) or ‐deficient (–P (0 mM)) media (A). Scale bar = 5 cm. Measurement DNA concentration from rice shoot and root samples under Pi starvation conditions [+P (0.320 mM), –P (0 mM)] was determined using NanoDrop 2000 (B). Detection of DNA fragmentation by the Terminal deoxynucleotidyl transferase dUTP nick‐end labeling (TUNEL) assay in rice shoot samples for 21 d on Pi‐sufficient (+P (0.320 mM)) or ‐deficient (–P (0 mM)) media (C). Terminal deoxynucleotidyl transferase (TdT) reacts with fluorescein (FITC)‐labeled dUTP to attach uridine to 3′‐hydroxyl (3′OH) terminus in DNA strand breaks. Double‐stranded DNA is counterstained by DAPI which intercalates between strands of double‐stranded DNA. Scale bar = 50 μm.
FIGURE 5
FIGURE 5
Morphological appearance of wild type and two osendo3 knock‐out (KO) mutant grown for 21 d on Pi‐sufficient (+P (0.320 mM)) or ‐deficient (–P (0 mM)) media (A). Scale bar = 5 cm. Diagram of T‐DNA insertions in the third intron and the fourth exon of the two osendo3 KO mutants (B). Confirmation of OsENDO3 expression in the two KO line shoot samples under +P and ‐P conditions. Four biological replicates were prepared and analyzed separately (C). Measurement DNA concentration from rice shoot under Pi starvation conditions [+P (D), –P (E)] was determined using NanoDrop 2000. Detection of DNA fragmentation by the Terminal deoxynucleotidyl transferase dUTP nick‐end labeling (TUNEL) assay in wild type and two KO shoot samples for 21 d on Pi‐sufficient (+P (0.320 mM)) or ‐deficient (–P (0 mM)) media (F). Terminal deoxynucleotidyl transferase (TdT) reacts with fluorescein (FITC)‐labeled dUTP to attach uridine to 3′‐hydroxyl (3′OH) terminus in DNA strand breaks. Double‐stranded DNA is counterstained by DAPI, which intercalates between strands of double‐stranded DNA. Scale bar = 20 μm.
FIGURE 6
FIGURE 6
Morphological appearance of wild type and OxPHR2 grown for 21 d on Pi‐sufficient (+P (0.320 mM)) or ‐deficient (–P (0 mM)) media (A). Scale bar = 5 cm. Measurement of DNA concentration from rice shoot and root samples under Pi starvation conditions [+P (0.320 mM), –P (0 mM)] was determined using NanoDrop 2000 (B). The expression analysis of four rice ENDO genes under Pi starvation conditions [+P (0.320 mM), –P (0 mM)] between WT and OxPHR2 using qRT‐PCR and dual‐luciferase (LUC) reporter assay. The X‐axis represents the tissues and conditions utilized for the qPCR analysis, while the Y‐axis indicates the relative expression level compared to that of OsUbi5 (C). The values are presented as means ± SE (n = 4), and asterisks denote significant differences (p < 0.05) in expression compared to the Pi‐sufficient condition. Statistical significance levels are denoted as ***p < 0.001, **p < 0.01, and *p < 0.05, based on a t‐test. Detection of DNA fragmentation by the Terminal deoxynucleotidyl transferase dUTP nick‐end labeling (TUNEL) assay in wild type and OxPHR2 shoot samples for 21 d on Pi‐sufficient (+P (0.320 mM)) or ‐deficient (–P (0 mM)) media (D). Terminal deoxynucleotidyl transferase (TdT) reacts with fluorescein (FITC)‐labeled dUTP to attach uridine to 3′‐hydroxyl (3′OH) terminus in DNA strand breaks. Double‐stranded DNA is counterstained by DAPI, which intercalates between strands of double‐stranded DNA. Scale bar = 50 μm. The sketch map shows the constructs for dual‐LUC assay. The coding sequence of OsPHR2 was fused to the GFP fluorescent protein in the pGreen vector to make the effector construct. Empty vectors were used as negative controls. Promoters of OsENDO3 and OsENDO4 were fused with the N‐terminal of the LUC gene for the preparation of reporter constructs. For the dual‐LUC analysis, transient expression was achieved in Nicotiana benthamiana leaves by infiltration with Agrobacterium GV3101 cells carrying equal concentrations of the effector and reporter constructs (E). Relative luciferase activities were measured and reported as the ratio of Renilla luciferase (rLuc) to firefly luciferase (fLuc). The results revealed a notable upregulation of OsENDO3 and OsENDO4 promoter activities in the presence of the OsPHR2 effector construct. The data are presented as the mean ± standard deviation (SD) from four separate infiltration experiments, with error bars depicting the SD for n = 4. Statistical analysis was performed using a two‐tailed paired Student's t‐test, and findings indicated a high level of significance with **p < 0.01.
FIGURE 7
FIGURE 7
Proposed working model of the OsENDO3 regulated by OsPHR2 for gDNA degradation‐mediated Pi recycling under Pi starvation. In rice, OsPHR2 acts as a key regulator of the Pi signaling pathway. Under conditions of low Pi, OsPHR2 leads to the upregulation of OsENDO3 gene expression. This promotes gDNA degradation, facilitated by OsENDO3, probably resulting in increased internal Pi concentration during Pi starvation.

References

    1. Aoyagi, S. , Sugiyama M., and Fukuda H.. 1998. “BEN1 and ZEN1 cDNAs Encoding S1‐Type DNases That Are Associated With Programmed Cell Death in Plants.” FEBS Letters 429, no. 2: 134–138. - PubMed
    1. Bariola, P. A. , Howard C. J., Taylor C. B., Verburg M. T., Jaglan V. D., and Green P. J.. 1994. “The Arabidopsis Ribonuclease Gene RNS1 Is Tightly Controlled in Response to Phosphate Limitation.” Plant Journal 6, no. 5: 673–685. - PubMed
    1. Bhadouria, J. , Singh A. P., Mehra P., et al. 2017. “Identification of Purple Acid Phosphatases in Chickpea and Potential Roles of CaPAP7 in Seed Phytate Accumulation.” Scientific Reports 7, no. 1: 11012. - PMC - PubMed
    1. Canetti, L. , Lomaniec E., Elkind Y., and Lers A.. 2002. “Nuclease Activities Associated With Dark‐Induced and Natural Leaf Senescence in Parsley.” Plant Science 163, no. 4: 873–880.
    1. Chow, C. N. , Lee T. Y., Hung Y. C., et al. 2019. “PlantPAN3.0: A New and Updated Resource for Reconstructing Transcriptional Regulatory Networks From ChIP‐Seq Experiments in Plants.” Nucleic Acids Research 47, no. D1: D1155–D1163. - PMC - PubMed

LinkOut - more resources