. 2025 Oct;12(40):e06883.
doi: 10.1002/advs.202506883. Epub 2025 Aug 12.

ACSS2/AATF Drives Soluble FasL-Mediated CD8+ T Cell Apoptosis in Pancreatic Neuroendocrine Tumors

Affiliations

ACSS2/AATF Drives Soluble FasL-Mediated CD8+ T Cell Apoptosis in Pancreatic Neuroendocrine Tumors

Qin Dang et al. Adv Sci (Weinh). 2025 Oct.

Abstract

Besides the traditional carbon sources, Acetyl coenzyme A has recently been shown to be generated from acetate in various cancers, which subsequently promotes tumor growth and immune escape. However, the mechanism of Acetyl coenzyme A availability in pancreatic neuroendocrine tumors (PNETs) remains largely unknown. Herein, the metabolic-epigenetic modification driven by acetyl coenzyme A synthase 2 (ACSS2) and its effect on the Fas/FasL system in PNETs is investigated. ACSS2 is highly expressed in PNETs and significantly correlated with patient prognosis. Mechanistically, ACSS2 activity or acetate supplementation induces histone H3/H4 hyperacetylated in PNET cells. This epigenetic modification recruits the transcription factor AATF to co-regulate FasL transcription, specifically enhancing soluble FasL secretion. Secreted FasL binds Fas receptors on CD8+ T cells, activating caspase-8/3 cascades to trigger T-cell apoptosis and promote immune evasion. Notably, the finding indicated the non-redundant and synergistic effects of ACSS2 and AATF in modulating FasL expression, which might support emerging strategies for immunotherapy of PNETs.

Keywords: AATF; ACSS2; Acetyl‐CoA; Fas/FasL pathway; pancreatic neuroendocrine tumors.


Conflict of interest statement

The authors declare no conflict of interest.

Figures
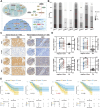
Figure 1
Figure 1
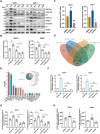
The expression level of ACSS2 was highly elevated in PNETs and predicts poor outcomes. A) Diagram of the major pathways of intracellular acetyl‐CoA anabolism and the dynamically regulated pattern of acetylation modifications occurring in histones. Intracellular sites of acetyl‐CoA anabolism and products of ACLY (substrate: citrate), ACSS1 (substrate: acetate), ACSS2 (substrate: acetate), and PDH (substrate: pyruvate). B) Immunohistochemistry (IHC) staining of human PNET tissues and paired adjacent normal tissues arrays using ACLY, ACSS1, ACSS2, and PDH‐specific antibodies (n = 105). C) Classification of tumor tissues (T) and adjacent normal tissues (A) according to the staining intensity of ACLY, ACSS1, ACSS2, and PDH (n = 105). D) ACLY, ACSS2, and PDH expression were significantly higher in PNET tissues than in paired adjacent normal tissues in IHC staining of tissue arrays, while there was no significance in the expression of ACSS1 expression between tumor tissues and paired adjacent normal tissues (* p < 0.05, ** p < 0.01, *** p < 0.001, ns indicates not significant, n = 105). E) Kaplan‐Meier analysis of the overall survival rate of patients with PNET according to the expression of ACLY, ACSS1, ACSS2, and PDH, respectively (n = 105, log‐rank test).
Figure 2
Figure 2
Increased ACSS2 catalyzes PNETs cells histone acetylation modification through pan‐acetylation regulation, and promotes FasL transcription and exocytosis of sFasL in PNET cells. A) ACSS2 enhances histone pan‐acetylation in PNET cell lines. After overexpression or knockdown of ACSS2, immunoblotting was performed with an antibody against ACSS2, using β‐actin as the loading control, and was performed with the antibodies against Ace‐H3, Ace‐H4, H3K9ac, H3K27ac, and H4K16ac, using H3 or H4 as the loading control. B) ACSS2 was overexpressed or knocked down in PNET cell lines, and acetyl‐CoA content was determined by fluorescence ELISA. The assay was repeated independently 3 times (* p < 0.05, ** p < 0.01). C) Cellular acetyl‐CoA content assay in BON‐1 and QGP‐1 cells after treatment with acetate supplementation or ACSS2i, respectively. D) Cross‐analysis of differentially expressed genes in the four comparison pairs (ACSS2‐OE vs EV‐up, ACSS2‐KO1 vs Ctrl‐down, ACSS2‐KO2 vs Ctrl‐down, ACSS2i vs DMSO‐down) yielded a total of 69 common genes. E) Ranking of the total number of pathways enriched for common genes. The vertical coordinate is the total number of pathways enriched to, and the horizontal coordinate is the gene name. F) FasLG gene expression levels were analyzed at the RNA level as verified by RT‐qPCR assays in different treatment groups of ACSS2 in BON‐1 and QGP‐1 cell lines, respectively (* p < 0.05, ** p < 0.01, **** p < 0.0001). G) ELISA assay of soluble FasL (sFasL) levels in BON‐1 and QGP‐1 cell culture supernatants from overexpression or silencing of ACSS2. Five independent repetitions for each group (* p < 0.05, ** p < 0.01, *** p < 0.001). H) ELISA assay of sFasL levels in BON‐1 and QGP‐1 cell culture supernatants from different treatment groups. Five independent repetitions for each group (* p < 0.05, ** p < 0.01).
Figure 3
Figure 3
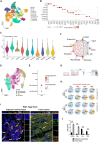
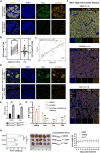
ACSS2‐mediated increase in sFasL in PNET cells induces apoptosis in Jurkat cells through non‐classical manner. A) Dimensionality reduction plot depicting the scRNA‐seq data, identifying a total of 10 major cell types across the tumor tissues. B) Dot plot showing the expression of classical cell type markers across identified cell subpopulations. Dot size represents the percentage of cells expressing each marker and color intensity reflecting average expression. C) Violin plot comparing the expression levels of FAS across major cell subpopulations, with T cells exhibiting significantly higher expression than other subpopulations. D) The uniform manifold approximation and projection (UMAP) representation of four cell subpopulations generated from sub‐clustering T cells. F) Dot plot showing the expression levels of FAS across four T cell subpopulations. G) CellChat infers intercellular communication networks between different cell types. H) The flowchart for the co‐culture of PNETs cells and Jurkat cells. Tumor cells and Jurkat cells were inoculated in the lower and upper chambers of a six‐well plate and co‐cultured for 48 h. Subsequently, Jurkat cells in the upper chamber were aspirated and flow assayed to observe the proportion of cells undergoing apoptosis. Each group of experiments was independently repeated three times. I) Tumor cells with specific ratios (tumor cell: Jurkat cell ratio of 5W:5 W, 10W:5 W, 25W:5 W, and 50W:5 W respectively) wer e co‐cultured with Jurkat cells according to the co‐culture model, and differences in apoptotic proportion of Jurkat cells caused by PNET cells from ACSS2‐OE versus ACSS2‐EV were examined (** p < 0.01). J) Multicolor immunofluorescence staining of paraffin‐embedded Rip1‐Tag2 mouse tissue sections for FasL (green), Fas (red), CD8 (white), ACSS2 (orange), and nuclei (DAPI, blue). Yellow arrows indicate magnified cells. To quantify CD8±Fas± T cells or ACSS2±FasL± tumor cells, 3 randomly photographed spot areas were taken on the 3 slides using a 40 × oil immersion objective, respectively. K) The expression scores of mIF of ACSS2, FASL, Fas, and CD8 in tumor and adjacent normal tissues of Rip1‐Tag2 mice models (** p < 0.01, n = 3).
Figure 4
Figure 4
Transcription‐promoting factor AATF synergizes with ACSS2 to increase FasL expression A) Silver staining of SDS‐PAGE gels indicated ACSS2‐interacting proteins. Flag‐ACSS2 expression stable BON‐1 cells were lysed and immunoprecipitated with anti‐Flag Ab or rabbit IgG control Ab, and then subjected to SDS‐PAGE gel and silver staining. B) Representative tandem MS spectrum of the peptide LLSFMAPIDHTTMNDDAR from AATF as determined by IP‐Mass Spec. C) AATF was further identified to bind with ACSS2 by immunoprecipitation. Flag‐ACSS2 expression stable BON‐1 cells were lysed and immunoprecipitation with anti‐Flag Ab or abbit IgG control Ab, and then subjected to immunoblotting using antibodies against AATF. D) Endogenous ACSS2 colocalized with AATF in PNET cells. Localization of AATF (green) and ACSS2 (red) in BON‐1 and QGP‐1 cells was detected by double immunofluorescence labeling and confocal microscopy. The merged image with the yellow signal represented their colocalization. E) A ChIP‐re‐ChIP assay was conducted using anti‐AATF antibody first (AATF) in BON‐1 and QGP‐1 cells. The eluents were then subjected to a second ChIP assay using anti‐Flag‐ACSS2 antibody (AATF + Flag‐ACSS2) or control IgG antibody (AATF + IgG) (n = 3). F) Dual luciferase validation of AATF positive regulation of FasL transcription. Schematic representations of the reporter and effector constructs used in the dual‐LUC assay. Firefly luciferase (LUC) driven by the FasLG promoter was used as the reporter. Renilla luciferase (REN) was used as an internal control. G) The binding sites of ACSS2 and AATF protein were simulated using AutoDock Vina v.1.2.2 molecular docking analysis, whose low binding energy is −11.3 kcal mol−1. H) Surface plasmon resonance (SPR) analysis using a Biacore 8K system (Cytiva) quantified the binding kinetics and affinity between the analyte (AATF) and immobilized ligand (ACSS2). Six serially diluted concentrations of AATF (range: 12.5 – 400 nm) were injected over ACSS2‐coupled CM5 sensor chips. Real‐time binding curves demonstrated concentration‐dependent responses, yielding an equilibrium dissociation constant (K D ) of 33.3 ± 1.7 nm, indicative of high‐affinity molecular recognition. I) Overexpression (or knockdown) of AATF in PNET cells could lead to increased (or decreased) sFasL levels. ELISA assay of sFasL concentration levels in BON‐1 cell culture supernatants from different treatment groups. Five independent repetitions for each group (* p < 0.05, ** p < 0.01).
Figure 5
Figure 5
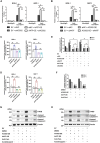
AATF acts as an intranuclear guide that binds ACSS2 and localizes to the FasLG promoter region to enhance transcription in concert with histone pan‐acetylation modification. A) AATF binding to the FasLG promoter region and promoting transcription requires synergistic ACSS2‐mediated histone acetylation modifications. ChIP qRT‐PCR detection of AATF occupancy on the promoters of FasLG in BON‐1 cells and QGP‐1 cells. ChIP‐level antibodies against acetylation‐modified H3 and H4 were used to specifically pull down H3ac/H4ac histones in each treatment group. Silencing of ACSS2 expression after overexpression of AATF reversed the increase in FasLG promoter region occupancy caused by AATF overexpression (siNC + AATF‐OE vs EV + siNC, siNC + AATF‐OE vs AATF‐OE + siACSS2). The decrease in FasLG promoter region occupancy after silencing ACSS2 expression was not reversed by overexpression of AATF (EV + siACSS2 vs EV + siNC, EV + siACSS2 vs AATF‐OE + siACSS2) (** p < 0.01, ns indicates not significant). B) Enhancement of FasLG transcription by ACSS2 requires endogenous guidance of AATF and pro‐transcriptional regulation of the FasLG promoter region by AATF. ChIP qRT‐PCR detection of AATF occupancy on the promoters of FasLG in BON‐1 cells and QGP‐1 cells. ChIP‐level antibodies against acetylation‐modified H3 and H4 were used to specifically pull down H3ac/H4ac histones in each treatment group. Silencing of AATF expression after overexpression of ACSS2 reversed the increase in FasLG promoter region occupancy caused by ACSS2 overexpression (siNC + ACSS2‐OE vs EV + siNC, siNC + ACSS2‐OE vs ACSS2‐OE + siAATF). The decrease in FasLG promoter region occupancy after silencing AATF expression was not reversed by overexpression of ACSS2 (EV + siAATF vs EV + siNC, EV + siAATF vs ACSS2‐OE + siAATF) (** p < 0.01, ns indicates not significant). C,D) ELISA assay of sFasL concentration levels in BON‐1 and QGP‐1 cell culture supernatants from different treatment groups. Consistency in intergroup comparisons of different cell lines. Five independent repetitions for each group (** p < 0.01, ns indicates not significant). E) The percentage of apoptotic Jurkat cells after co‐cultured with BON‐1 and QGP‐1 cells among distinct groups (** p < 0.01, ns indicates not significant). F) FasL antibody (0.1 µg mL−1) was detected after 48 h of incubation in the lower chamber of co‐cultured six‐well plates (** p < 0.01). G,H) Validation of expression levels of key pro‐apoptotic proteins in the Fas/FasL pathway. After overexpression of ACSS2 or AATF, immunoblotting was performed using FADD, cleaved caspase‐8, and cleaved caspase‐3 antibodies with β‐actin as upload control in BON‐1 (G) and QGP‐1 (H) cell lines, respectively.
Figure 6
Figure 6
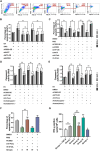
Detection of apoptotic proteases in primary T cells and histological validation of the correlation between ACSS2 and FasL expression in PNETs. A) Flow sorting procedure for primary CD8+ T cells. B,C) The percentage of apoptotic primary CD8+ T cells after co‐cultured with BON‐1 and QGP‐1 cells among distinct groups. Animal‐free recombinant human soluble Fas ligand (rh‐sFasL, 4 units/mL) was detected after 18 h co‐incubation of independent treatment (* p < 0.05, ** p < 0.01, ns indicates not significant). D,E) Changes in the activity of caspase‐8 (D) and caspase‐3 (E) in BON‐1 and QGP‐1 cell lines were determined by fluorescence assay after the corresponding treatments. Acetate (1 mm) was detected after 48 h of independent treatment in the upper and lower chambers of co‐cultured six‐well plates. FasL antibody (0.1 µg mL−1) was detected after 48 h of incubation in the lower chamber of co‐cultured six‐well plates (* p < 0.05, ** p < 0.01, ns indicates not significant). F) The percentage of apoptotic primary CD8+ T cells after co‐cultured with PNET patient‐derived organoids (PDOs) among distinct groups. The ACSS2i (0.5 µM), anti‐FasL antibody (0.1 µg mL−1), or animal‐free recombinant human soluble Fas ligand (rh‐sFasL, 4 units/mL) was added to one well in a six‐well plate and then independently treated and co‐incubated for 48 h (** p < 0.01, ns indicates not significant). G) Bar plot showing the IFN‐γ positive spots/105 cells in the different suppression and co‐culturing conditions as indicated in the plot. TGF‐β treatment was added as a negative control for CD8+ T cell suppression. Error bars indicate mean ± SEM (* p < 0.05, ** p < 0.01, ns indicates not significant).
Figure 7
Figure 7
Histological expression correlation statistics and in vivo validation of mouse models of spontaneous tumors. A) Multiplex immunohistochemical (mIHC) staining of human PNET tissues and paired adjacent normal tissues arrays using ACSS2 and FasL‐specific antibodies (n = 105). B) FasL expression was significantly higher in human PNET tissues than in paired adjacent normal tissues in IHC staining of tissue arrays (** p < 0.01, n = 105). C) The expression level of FasL was positively correlated with the expression of ACSS2. Each data point represents one patient. The higher the expression of ACSS2, the higher the expression level of FasL. D) The mIHC staining of tumor tissues from mice models of spontaneous PNET and paired adjacent normal tissues using ACSS2 and FasL‐specific antibodies (n = 6). E) ACSS2 and FasL expression were significantly higher in tumor tissues from mice models of spontaneous PNET than in paired adjacent normal tissues in IHC staining (** p < 0.01, n = 6). F) The mIF staining of paraffin‐embedded Rip1‐Tag2 mouse tissue sections for FasL (green), Fas (red), CD8 (white), ACSS2 (orange) and nuclei (DAPI, blue). To quantify CD8±Fas± T cells or ACSS2±FasL± tumor cells, 3 randomly photographed spot areas were taken on the 3 slides using a 40 × oil immersion objective, respectively. G) The mIF scores of ACSS2, FASL, Fas, and CD8 in tumor tissues from control and drug‐treated groups of Rip1‐Tag2 mice models (* p < 0.05, ** p < 0.01, n = 5). H) Tumor tissues of Rip1‐Tag2 mice were collected and photographed (scale bar = 1 cm). Tumor size and weight were measured on the sacrificed day (mean ± SD, n = 5, ** p < 0.01).
Figure 8
Figure 8
The proposed working model of this study.

References

    1. Chang A., Sherman S. K., Howe J. R., Sahai V., Annu. Rev. Med. 2022, 73, 213. - PubMed
    1. Yan J., Yu S., Jia C., Li M., Chen J., Biochim. Biophys. Acta, Rev. Cancer 2020, 1874, 188367. - PubMed
    1. Dasari A., Shen C., Halperin D., Zhao B., Zhou S., Xu Y., Shih T., Yao J. C., JAMA Oncol. 2017, 3, 1335. - PMC - PubMed
    1. Strosberg J., El‐Haddad G., Wolin E., Hendifar A., Yao J., Chasen B., Mittra E., Kunz P. L., Kulke M. H., Jacene H., Bushnell D., O'Dorisio T. M., Baum R. P., Kulkarni H. R., Caplin M., Lebtahi R., Hobday T., Delpassand E., Van Cutsem E., Benson A., Srirajaskanthan R., Pavel M., Mora J., Berlin J., Grande E., Reed N., Seregni E., Öberg K., Lopera Sierra M., Santoro P., et al., N. Engl. J. Med. 2017, 376, 125. - PMC - PubMed
    1. Yao J. C., Shah M. H., Ito T., Bohas C. L., Wolin E. M., Van Cutsem E., Hobday T. J., Okusaka T., Capdevila J., de Vries E. G. E., Tomassetti P., Pavel M. E., Hoosen S., Haas T., Lincy J., Lebwohl D., Öberg K., N. Engl. J. Med. 2011, 364, 514. - PMC - PubMed

MeSH terms

LinkOut - more resources