. 2025 Nov;12(41):e07635.
doi: 10.1002/advs.202507635. Epub 2025 Aug 12.

Hepatic CBP/p300 Orchestrate Amino Acid-Driven Gluconeogenesis through Histone Crotonylation

Affiliations

Hepatic CBP/p300 Orchestrate Amino Acid-Driven Gluconeogenesis through Histone Crotonylation

Chunxiang Sheng et al. Adv Sci (Weinh). 2025 Nov.

Abstract

The role of amino acid metabolism dysregulation in the development of type 2 diabetes remains elusive. Here, significant associations of human CREBBP/EP300 gene polymorphisms with circulating amino acid and glucose levels are reported. Through integrated transcriptomic, metabolomic, and CUT&Tag analyses, the molecular mechanisms underlying these correlations are investigated. Liver-specific Crebbp/Ep300 double knockout mice display elevated plasma amino acid levels and impaired hepatic glucose production caused by the downregulation of amino acid metabolism genes, which is closely linked to altered histone crotonylation and acetylation patterns at their promoters. However, key gluconeogenic genes Pck1 and G6pc are not downregulated in knockout mice. Interestingly, the level of 2-aminoadipic acid (2-AAA), a biomarker of diabetes, is significantly increased due to decreased glutaryl-CoA dehydrogenase (GCDH) expression in CBP/p300-deficient livers. Treatment with 2-AAA or overexpression of GCDH enhances amino acid-driven gluconeogenesis through histone crotonylation-mediated transcriptional activation of amino acid metabolism genes in primary mouse hepatocytes, whereas GCDH knockdown exhibits an opposite result. Furthermore, targeted hepatic knockdown of CBP/p300 markedly attenuates hepatic glucose production from amino acids in diabetic mice. In sum, these findings underscore the pivotal role of CBP/p300 in linking amino acid catabolism to gluconeogenesis through histone crotonylation in a cell-autonomous manner.

Keywords: 2‐aminoadipic acid; CBP/p300; GCDH; amino acids; gluconeogenesis; histone crotonylation; type 2 diabetes.


Conflict of interest statement

The authors declare no conflict of interest.

Figures
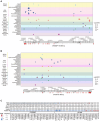
Figure 1
Figure 1
Association of CREBBP/EP300 SNPs with circulating amino acid levels. A,B) SNPs within CREBBP and EP300 loci exhibit significant correlations with circulating amino acids levels among Chinese adults. The SNP positions are depicted as colored circles, with circle size proportional to statistical significance (−log 10(p‐value)). Different colors on the left of the y‐axis distinguish amino acid families. The x‐axis shows physical positions of each SNP spanning the two genes. C) Correlations between SNPs in CREBBP/EP300 gene loci and key clinical parameters of type 2 diabetes. The size of each circle is proportional to the significance level, and the shading in each square corresponds proportionally to the beta coefficient.
Figure 2
Figure 2
Hepatic Crebbp and Ep300 double knockout mice exhibit elevated levels of plasma amino acids. A) Schematic diagram illustrating the generation of liver‐specific Crebbp and Ep300 knockout (CBP/p300LivDKO) mice. B) Hepatic Crebbp and Ep300 mRNA expressions from WT and CBP/p300LivDKO mice (n = 5). C) Immunohistochemistry staining of CBP and p300 in the livers of WT and CBP/p300LivDKO mice. Scale bar = 100 µm. D,E) Blood glucose and plasma total amino acid levels in 6‐h fasted mice from six groups: WT (n = 11), CBPLivKO (n = 5), p300LivKO (n = 5), CBPLivKO/p300HET (n = 7), CBPHET/p300LivKO (n = 6), CBP/p300LivDKO (n = 7). F) Schematic workflow for sample collection and targeted metabolomics profiling of plasma from 6‐h fasted WT and CBP/p300LivDKO mice (n = 8). A PCA score plot illustrating distinct metabolic signatures in the two groups. G) Volcano plot showing metabolite abundance discrepancies between WT and CBP/p300LivDKO mice. Significantly differentially abundant metabolites are represented in red (n = 101) and blue (n = 8). The horizontal line indicates the significance cut‐off of p < 0.05. H) Known metabolic pathways involved in amino acid metabolism are enriched among the plasma metabolites in WT and CBP/p300LivDKO mice. The circle colors indicate the level of enrichment significance, with red indicating high significance and yellow indicating low significance. Additionally, larger bubble radii indicate greater pathway impact (Hypergeometric test; p < 0.05). I) Interleaved box and whiskers plot showing amino acid levels in WT and CBP/p300LivDKO mice (n = 8). Data are presented as mean ± SEM. Statistical significance was determined using two‐tailed unpaired Student's t‐test (B,I), or Mann–Whitney U test (I) based on data distribution, or one‐way ANOVA followed by Fisher's LSD test (D,E), compared with WT group: * p < 0.05, ** p < 0.01, and *** p < 0.001; N.S., not significant.
Figure 3
Figure 3
Amino acid metabolic reprogramming in the liver of CBP/p300LivDKO mice. A) Volcano plot depicting differential hepatic metabolites in 6‐h fasted WT and CBP/p300LivDKO mice (n = 8). Red (n = 78) and blue (n = 57) indicate significantly up‐ and down‐regulated metabolites, respectively. B) Bubble plot illustrates pathway enrichment analysis using significantly altered metabolites (Hypergeometric test; p < 0.05). C) Heatmap of significant changes in amino acid metabolites in the livers of WT and CBP/p300LivDKO mice. Rows represent the Z scores calculated for each group. D) Volcano plot showing differentially expressed genes in the livers of 6‐h fasted WT and CBP/p300LivDKO mice (n = 3). The two vertical lines denote cutoff points for a 1.5‐fold change, while the horizontal line indicates the significance cut‐off of p < 0.05. E) KEGG Pathway enrichment analysis of RNA‐seq data from the livers of WT and CBP/p300LivDKO mice. Pathways are clustered with similar colors based on their overall function. F,G) GSEA plots demonstrating the valine, leucine, and isoleucine degradation pathway and tryptophan metabolism pathway in RNA‐seq data. NES, normalized enrichment score. H) Integration map of metabolomic and transcriptomic analysis related to amino acid metabolism. Circles represent metabolites detected by LC‐MS/MS (n = 8), while rectangles represent transcripts from RNA‐seq data (n = 3). Integration based on KEGG pathway annotations.
Figure 4
Figure 4
CBP/p300LivDKO mice display severely impaired amino acid‐driven gluconeogenesis. A,B) Blood glucose levels of alanine or glutamine tolerance tests comparing WT (n = 5) and CBP/p300LivDKO mice (n = 4). Area under the curve was calculated and compared using two‐tailed unpaired Student's t‐test. C) Amino acid‐driven gluconeogenesis by primary hepatocytes isolated from WT and CBP/p300LivDKO mice, supported by 10 m L‐alanine or 10 mMm L‐glutamine (n = 4). D,E) Hepatic mRNA (n = 5) and protein (n = 4) expressions of genes related to amino acid metabolism in 6‐h fasted WT and CBP/p300LivDKO mice. F,G) Blood glucose levels of alanine or glutamine tolerance tests comparing AAV‐CON (n = 9) and AAV‐CRE mice (n = 9). The area under the curve was calculated. H) Amino acid‐driven gluconeogenesis by primary hepatocytes isolated from AAV‐CON and AAV‐CRE mice, supported by 10 mM L‐alanine or 10 mM L‐glutamine (n = 4). I,J) Hepatic mRNA (n = 5) and protein (n = 4) expressions of genes related to amino acid metabolism from 6‐h fasted AAV‐CON and AAV‐CRE mice. K) RT‐qPCR analysis of hepatic mRNA expression of Pck1 and G6pc in WT and CBP/p30LivDKO mice (n = 5). L) Western blot analysis of gluconeogenesis‐related proteins in WT and CBP/p300LivDKO mice (n = 4). M) ChIP‐qPCR analysis of gluconeogenic gene promoters using antibodies against CREB and FOXO1 in the livers from 6‐h fasted WT and CBP/p300LivDKO mice (n = 3). N) Endogenous PEPCK protein was precipitated in the livers of WT and CBP/p300LivDKO mice, and its acetylation and ubiquitination were detected. O) Scheme illustrating the amino acid uptake and catabolism pathways for gluconeogenesis. Genes significantly downregulated in the livers of CBP/p300LivDKO mice are shown in blue. Data are presented as mean ± SEM. Statistical significance was determined using two‐tailed unpaired Student's t‐test, compared with WT or AAV‐CON group, * p < 0.05, ** p < 0.01, and *** p < 0.001; N.S., not significant.
Figure 5
Figure 5
Histone acylations act cooperatively in regulating amino acid metabolism gene expression. A) Western blot analysis of site‐specific histone acylations in WT and CBP/p300LivDKO mice (n = 4). Protein expression was normalized to total histone H3. B) Experimental design schematic depicting the assessment of H3K27Ac, H2BK12Ac, and H2BK12Cr histone marks in nuclei isolated from the livers of WT and CBP/p300LivDKO mice using the CUT&Tag technique. C) Genome‐wide distribution of H3K27Ac, H2BK12Ac, and H2BK12Cr peaks in WT mouse livers. D) Sankey plot illustrating the relevance of H3K27Ac, H2BK12Ac, and H2BK12Cr distributions on amino acid metabolism genes. “NA: Not detected” indicates the absence of the histone modification on the gene. E–G) Heatmaps displaying the signal of specified histone modifications H2BK12Cr, H2BK12Ac, and H3K27Ac at peaks associated with differentially expressed genes in WT versus CBP/p300LivDKO mice. H) KEGG analysis of the pathways showing decreased binding peaks of H2BK12Cr. I) Genome browser tracks of CUT&Tag signal at representative target gene loci. The green rectangles indicate significantly decreased peak regions of H3K27Ac, H2BK12Ac, and H2BK12Cr on target‐gene promoters. J) Fold‐change expression (CBP/p300LivDKO/WT; cut‐off: 1.5‐fold change) of genes that gain, lose, or have no difference (ND) in histone modifications H3K27Ac, H2BK12Ac, and H2BK12Cr (cut‐off: twofold change). K,L) ChIP‐qPCR analysis of the promoters of two amino acid metabolism genes and Pck1 was performed using antibodies against H3K27Ac and H2BK12Cr in the livers from 6‐h fasted WT and CBP/p300LivDKO mice (n = 3). Data are presented as mean ± SEM. Statistical significance was determined using two‐tailed unpaired Student's test: * p < 0.05, ** p < 0.01, and *** p < 0.001.
Figure 6
Figure 6
The 2‐AAA/GCDH/H2BK12Cr axis promotes hepatic expression of amino acid metabolism genes in a positive feedback loop. A) The 2‐AAA catabolism pathway. B) Restricted cubic spline (RCS) analysis depicting the association between circulating 2‐aminoadipic acid (2‐AAA) and incident type 2 diabetes. Gray dotted line represents an odds ratio (OR) of 1, while the pink shaded area signifies the 95% confidence interval (CI) of the OR. C) Spearman's correlation analysis of the association of circulating 2‐AAA with amino acids. Color key represents the regression coefficients of the independent variables. D) Correlations of four SNPs in human GCDH loci with fasting plasma glucose (FPG), 2‐h postprandial glucose (2h‐PG), and several circulating amino acids in the cohort. E,F) Glucose production driven by alanine and glutamine and related gene expressions in primary hepatocytes treated with or without 100 µM 2‐AAA (n = 4). G,H) ChIP‐qPCR analysis of Prodh and Pck1 promoters using antibodies against H2BK12Cr in primary hepatocytes treated with or without 100 µM 2‐AAA (n = 3). I,J) Glucose production driven by alanine and glutamine and related gene expressions in normal control (NC) and si‐Gcdh‐treated hepatocytes (n = 4). K,L) ChIP‐qPCR analysis of Prodh and Pck1 promoters using antibodies against H2BK12Cr in NC and si‐Gcdh‐treated hepatocytes (n = 3). M) Concentration of 2‐AAA in the plasma of WT and CBP/p300LivDKO mice (n = 8). N) Genome browser tracks of CUT&Tag signal at the Gcdh gene loci. Green rectangle indicates significantly decreased peak regions of H2BK12Cr on Gcdh promoter. O) ChIP‐qPCR analysis of Gcdh promoter using antibodies against H2BK12Cr in the livers from 6‐h fasted WT and CBP/p300LivDKO mice (n = 3). P,Q) Gcdh mRNA (n = 5) and protein (n = 4) expressions in the livers of WT and CBP/p300LivDKO mice. R,S) Glucose production driven by alanine and glutamine and amino acid metabolism gene expressions in primary hepatocytes isolated from WT and CBP/p300LivDKO mice (KO), followed by transfection with NC or overexpressing (OE)‐GCDH plasmids (n = 4). T) ChIP‐qPCR analysis of Prodh promoter using antibody against H2BK12Cr in WT, KO, and KO+OE‐GCDH hepatocytes (n = 3). Data are presented as mean ± SEM. Statistical significance was determined using two‐tailed unpaired Student's t‐test (E–P) or one‐way ANOVA, followed by Fisher's LSD test (R–T): * p < 0.05, ** p < 0.01, and *** p < 0.001; N.S., not significant.
Figure 7
Figure 7
Hepatic amino acid metabolism is upregulated in diabetic mice. A) Heatmap displaying the relative expression of selected amino acid metabolism‐related genes. Left: RNA‐seq data from CBP/p300LivDKO versus WT mice; Right: RNA‐seq data from GSE188344. B) RT‐qPCR analysis of the relative expression of amino acid metabolism genes in the livers of db/m versus db/db mice (n = 7). C) Experimental design schematic showing primary hepatocytes isolation from db/m and db/db mice, followed by treatment of db/db hepatocytes with 3 µM A‐485. D) Glucose production driven by alanine and glutamine in primary hepatocytes isolated from db/m and db/db mice treated with or without 3 µM A‐485(n = 4). E) RT‐qPCR analysis of the relative expression of amino acid metabolism genes in primary hepatocytes isolated from db/m and db/db mice treated with or without 3 µM A‐485 (n = 4). F) Experimental timeline showing the injection of AAV‐TBG‐miR30shNC or AAV‐TBG‐miR30shCrebbp‐miR30shEp300 and subsequent analysis in db/m and db/db mice. G,H) Alanine or glutamine tolerance tests were performed on db/m and db/db mice following Crebbp/Ep300 knockdown (n = 6 per group). Blood glucose levels were measured at indicated time points, and area under the curve (AUC) was calculated. I–N) mRNA expression of key amino acid metabolic genes in liver tissues from the four groups (n = 6 per group). O,P) ChIP‐qPCR analysis of H2BK12Cr enrichment of Gpt and Prodh promoters (n = 3 per group). Q) Schematic diagram illustrates the role of CBP/p300 in linking amino acid catabolism to hepatic glucose production by governing various aspects of amino acid metabolism. This regulatory loop is amplified under diabetic conditions. Disruption of this loop through CBP/p300 knockout or inhibition may serve as a therapeutic strategy to maintain amino acid and glucose homeostasis. Data are presented as mean ± SEM. Statistical analysis was performed using two‐tailed unpaired Student's t‐test (B) or one‐way ANOVA, followed by Fisher's LSD test (D,E,G–P): * p < 0.05, ** p < 0.01, and *** p < 0.001.

References

    1. Chandel N. S., Perspect. Biol. 2021, 13, a040584.
    1. Broer S., Broer A., Biochem. J. 2017, 474, 1935. - PMC - PubMed
    1. Ling Z., Jiang Y., Ru J., Lu J., Ding B., Wu J., Signal Transduction Targeted Ther. 2023, 8, 345. - PMC - PubMed
    1. Newgard C. B., An J., Bain J. R., Muehlbauer M. J., Stevens R. D., Lien L. F., Haqq A. M., Shah S. H., Arlotto M., Slentz C. A., Rochon J., Gallup D., Ilkayeva O., Wenner B. R., Yancy W. S., Eisenson H., Musante G., Surwit R. S., Millington D. S., Butler M. D., Svetkey L. P., Cell Metab. 2009, 9, 311. - PMC - PubMed
    1. Wang T. J., Larson M. G., Vasan R. S., Cheng S., Rhee E. P., McCabe E., Lewis G. D., Fox C. S., Jacques P. F., Fernandez C., O'Donnell C. J., Carr S. A., Mootha V. K., Florez J. C., Souza A., Melander O., Clish C. B., Gerszten R. E., Nat. Med. 2011, 17, 448. - PMC - PubMed

MeSH terms

LinkOut - more resources