. 2025 Jul 28:12:1552990.
doi: 10.3389/fnut.2025.1552990. eCollection 2025.

Dietary assessment in intermittent fasting: validation of a short food frequency questionnaire vs. food records in diurnal dry fasting and time-restricted eating

Affiliations

Dietary assessment in intermittent fasting: validation of a short food frequency questionnaire vs. food records in diurnal dry fasting and time-restricted eating

Isabelle C Schüssler et al. Front Nutr. .

Abstract

Objectives: Food frequency questionnaire (FFQ) is a cost-effective method of dietary assessment in nutritional and clinical research. It can be easily adapted to different research questions or populations, but modified versions require careful validation. This study assessed the validity of a short 14-item semi-quantitative FFQ compared to weighted food records in a secondary analysis of an intermittent fasting trial.

Methods: Dietary assessment was conducted during the ParoFastin study, a controlled trial investigating the effects of religious Bahá'í fasting (19 days of diurnal dry fasting) and 16:8 time-restricted eating (TRE) on oral health and metabolic state compared to the habitual food intake. Daily consumption of meals, snacks, food groups, and overnight fasting time were assessed using both the short FFQ and food records. Food records were collected for 1 week at baseline and 19-21 days during the intervention and analyzed using PRODI®, a professional dietary assessment software. The FFQ was completed once at baseline and twice during the intervention. Its validity was assessed using correlation and method agreement analysis, including Bland-Altman plots for continuous data. Energy and macronutrient intakes were quantified using food records only.

Results: Eight men and seven women, with a median age of 29 (27-34) years, were included in the validation analysis. Correlation coefficients ranged from 0.189 (tendency to snack) to 0.893 (meat consumption). Tendency to snack, frequency of snack consumption, and frequency of whole grain consumption showed insufficient agreement between the two methods. However, most questions of the short FFQ were found to be statistically valid in this population. According to food records, the energy, fat and carbohydrate intake were reduced during the Bahá'í fast and remained unchanged in the control and TRE groups compared to the baseline, while analysis of these parameters was not feasible based on the short FFQ.

Conclusion: Overall, good agreement for the methods was found, although data on snack tendency, frequency of snack consumption, and whole-grain consumption were unreliable, indicating a need for questionnaire modifications. In contrast to time-consuming food records, the short FFQ can be effectively used in clinical trials and medical practice for specific goals.

Clinical trial registration: https://drks.de/search/de/trial/DRKS00026701 German Clinical Trials Register (DRKS); identifier DRKS00026701.

Keywords: dietary assessment; food frequency questionnaire; intermittent fasting; religious fasting; time-restricted eating; validation.


Conflict of interest statement

AM and DK co-founded the Academy of Integrative Fasting (AIF). AM is also co-founder of the SALUFAST company, and DK serves as a consultant for a mobile application on intermittent fasting (FASTIC), as well as a company producing plant-based supplements (EVERYYIN). AM and DK are board members of the Medical Association for Therapeutic Fasting and Nutrition (Ärztegesellschaft für Heilfasten und Ernährung e.V.). The remaining authors declare that the research was conducted in the absence of any commercial or financial relationships that could be construed as a potential conflict of interest. OP-R declared that she was an editorial board member of Frontiers, at the time of submission. This had no impact on the peer review process and the final decision.

Figures

Timeline of an intervention study with four visits. Visit 0, occurs 5-7 days before the intervention, includes the start of food records. Visit 1, the day before or day of the intervention start, includes the 14-item FFQ and continuation of food records. Visit 2, 7-10 days after intervention start, involves the same tasks. Visit 3, 19-21 days after intervention start, includes the 14-item FFQ and collection of food records. Arrows indicate the start and end of the intervention.
FIGURE 1
Study design. After baseline, participants either observed the Bahá’í fast or followed a 16:8 TRE regimen for 19 days or did not change their dietary habits (control group). The 14-item FFQ data were collected at three visits: prior to intervention start (V1) and twice during the intervention (V2 and V3). Throughout the entire study period, participants completed paper-based weighted food records.
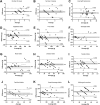
Twelve Bland-Altman plots illustrating the difference versus average for various food intakes and habits. Each plot (A-L) represents different metrics: number of meals, number of snacks, overnight fasting time, vegetable intake, fruit intake, sausage intake, meat intake, cheese intake, sweets intake, fast food intake, sweet beverage intake, and whole-grain product intake. Horizontal broken lines denote 95% limits of agreement and bias. Gray backround indicates the 95% confidence interval of the bias. Linear regression lines with significant slope are shown.
FIGURE 2
Bland–Altman plots as a measurement of method agreement. Difference between questionnaire and food record data plotted against the average value of the two methods. (A) Number of meals; (B) number of snacks; (C) overnight fasting time; (D) vegetable intake; (E) fruit intake; (F) sausage intake; (G) meat intake; (H) cheese intake; (I) confectionery (sweets) intake; (J) fast food intake; (K) sweet beverage intake; and (L) whole grain products. Notably, 95% limits of agreement (bias ±2*SD) as well as bias are shown as broken lines. The gray background indicates the 95% confidence interval of the bias. (G,J) Linear regression lines with significant slope (p < 0.05) are shown. (A,D–L) N = 42 data points = 15 participants in up to three recording periods. (B) N = 27 data points = 13 participants in up to three recording periods. (C) N = 40 data points = 15 participants in up to three recording periods.
Four scatter plots labeled A to D display log-transformed differences versus averages for food intake. Plot A shows log(Y+0.5) sausage intake, B log(Y+1) meat intake, C log(Y+1) cheese intake, and D log(Y+0.05) fast food intake. Each plot has a solid line indicating bias, and two solid lines above and below the bias for +2 standard deviations (SD) and -2 SD. Data points are dispersed around these lines, with many showing a downward trend.
FIGURE 3
Transformed Bland-Altman plots to correct for severe heteroscedasticity or proportional bias (N=42). Difference between log-transformed questionnaire and food record data plotted against the logarithmic average value of the two methods. Regression-based Bland-Altman analysis in case of significant slope of linear regression line (p < 0.05). (A) Sausage intake [log(Y+0.5)]. (B) Meat intake [log(Y+1)]. (C) Cheese intake [log(Y+1)]. (D) Fast food intake [log(Y+0.05)].
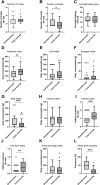
Twelve box plots compare dietary habits from questionnaire data vs. food records. Charts A to L display variables like the number of meals, number of snacks, and overnight fasting time, as well as intakes of vegetables, fruit, sausage, meat, cheese, sweets, fast food, sweet beverages, and whole-grain products. Asterisks indicate statistical significance. Circles indicate ouliners.
FIGURE 4
Average daily number of meals and snacks, overnight fasting time, and consumption of food groups according to FFQ and food records. (A) Number of meals; (B) number of snacks; (C) overnight fasting time; (D) vegetable intake; (E) fruit intake; (F) sausage intake; (G) meat intake; (H) cheese intake; (I) confectionery (sweets) intake; (J) fast food intake; (K) sweet beverage intake; and (L) whole grain products. Visualization of FFQ and food record data as Tukey boxplots. Circles represent outliers. Differences were statistically tested using a Wilcoxon signed-rank test. Stars indicate significance (*p < 0.05; **p < 0.01; ***p < 0.001). (A,D–L) N = 42 data points = 15 participants in up to three recording periods. (B) N = 27 data points = 13 participants in up to three recording periods. (C) N = 40 data points = 15 participants in up to three recording periods.
Bar graphs showing daily intake by category for Control, Bahá’í, and TRE groups, comparing Baseline (gray) and Intervention (black). Graph A: Energy intake (kcal), significant decrease for Bahá’í (*). Graph B: Proteins (g), significant decrease for control (*). Graph C: Fats (g), significant decrease for Bahá’í (*). Graph D: Carbohydrates (g), significant decrease for Bahá’í (**). Error bars indicate standard deviations.
FIGURE 5
Daily consumption of energy (A) and the macronutrients proteins (B), fats (C), and carbohydrates (D) derived from food records. Bar diagrams illustrating mean daily intake for the three different groups, control (N = 4), Bahá’í (N = 5), and time-restricted eating (TRE; N = 3), during baseline and intervention. Error bars represent standard deviations. Three participants were excluded from this analysis because baseline data were not available. Comparison of the nutrient intake during baseline (V1) and intervention (V2 and V3) per group using paired-samples t-tests (*p < 0.05; **p < 0.01).

References

    1. Pappe C, Maetschker J, Dujardin S, Peters B, Pivovarova-Ramich O, Kandil F, et al. Intermittent fasting regimes reduce gingival inflammation: A three-arm clinical trial. J Clin Periodontol. (2025) 52:681–94. 10.1111/jcpe.14151 - DOI - PMC - PubMed
    1. Peters B, Pappe C, Koppold D, Schipp K, Arnrich B, Michalsen A, et al. Twenty-four hour glucose profiles and glycemic variability during intermittent religious dry fasting and time-restricted eating in subjects without diabetes: A preliminary study. Nutrients. (2024) 16:2663. 10.3390/nu16162663 - DOI - PMC - PubMed
    1. van Staveren W, Ocké M, de Vries J. Estimation of dietary intake. 10th ed. In: Erdman J, Macdonald I, Zeisel S. editors. Present knowledge in nutrition. Hoboken, NJ: John Wiley & Sons, Inc; (2012). p. 1012–26.
    1. Johnson R. Dietary intake–how do we measure what people are really eating? Obes Res. (2002) 10:63S–8S. 10.1038/oby.2002.192 - DOI - PubMed
    1. Bailey R. Overview of dietary assessment methods for measuring intakes of foods, beverages, and dietary supplements in research studies. Curr Opin Biotechnol. (2021) 70:91–6. 10.1016/j.copbio.2021.02.007 - DOI - PMC - PubMed

LinkOut - more resources