[Preprint]. 2025 Jul 19:2025.07.18.664790.
doi: 10.1101/2025.07.18.664790.

SOX2 utilizes FOXA1 as a heteromeric transcriptional partner to drive proliferation in therapy-resistant prostate cancer

Affiliations

SOX2 utilizes FOXA1 as a heteromeric transcriptional partner to drive proliferation in therapy-resistant prostate cancer

John T Phoenix et al. bioRxiv. .

Abstract

Treatment options and diagnostic outlook for men with advanced, therapy resistant prostate cancer (PCa) are extremely poor; this is primarily due to the common lack of durable response to androgen receptor (AR) targeted therapies and phenotypic transdifferentiation into a particularly lethal subtype known as neuroendocrine prostate cancer (NEPC). In this study, we mechanistically determine that SOX2 (a transcription factor originally repressed by AR) physically binds and acts in a concerted manner with FOXA1 (a key AR pioneering cofactor) to regulate a subset of genes which promote cell cycle progression, and lineage plasticity in AR-refractory prostate cancers. Our findings assert the SOX2/FOXA1 interaction as an important mediator of resistance to AR-targeted therapy and a driver of NEPC and lineage plasticity; their coordinated action and downstream signaling offers a potential novel therapeutic opportunity in late-stage PCa.

Keywords: AR; ASCL1; CRPC; FGF; FGFR; FOXA1; NEPC; Prostate cancer; ROR1; SOX2; androgen; castration; enzalutamide; lineage plasticity; neuroendocrine; stem cells.


Conflict of interest statement

The authors declare no relevant conflicts of interest related to this study. E.S.A. reports grants and personal fees from Janssen, Johnson & Johnson, Sanofi, Bayer, Bristol Myers Squibb, Convergent Therapeutics, Curium, MacroGenics, Merck, Pfizer, and AstraZeneca; personal fees from Aadi Bioscience, Abeona Therapeutics, Aikido Pharma, Astellas, Amgen, Blue Earth, Boundless Bio, Corcept Therapeutics, Duality Bio, Exact Sciences, Hookipa Pharma, Invitae, Eli Lilly, Foundation Medicine, Menarini-Silicon Biosystems, Tango Therapeutics, Tempus, Tolmar Scientific, VIR Biotechnology, and Z-alpha; grants from Novartis, Celgene, and Orion; and has a patent for an AR-V7 biomarker technology that has been licensed to Qiagen. J.M.D. has no conflicts relevant to this work. However, he serves as a consultant and Chief Scientific Officer of Astrin Biosciences. The interest related to J.M.D. has been reviewed and managed by the University of Minnesota in accordance with its Conflict-of-Interest policies.

Figures
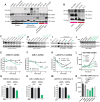
Figure 1.
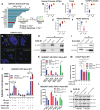
Figure 1.. SOX2 knockdown decreases survival of SOX2-positive adenocarcinoma and neuroendocrine prostate cancer cells.
A) Western blot panels of both non tumorigenic and malignant prostate cells for AR, FOXA1, and SOX2. Blots for β-actin were used as an internal loading control. B) Western blot panels of AR-negative PCa cell lines for AR, FOXA1, SOX2. Blots for β-actin were used as an internal loading control. C-D) Western blots show successful SOX2 shRNA knockdown at 48h in CWR-R1 and 22Rv1 adenocarcinoma cells. Protein bands were quantified using Empiria Studio. E-F) Normalized survival plots of CWR-R1 and 22Rv1 cells after doxycycline induction of shRNA targeting SOX2 or a non-specific scrambled shRNA (sh-SCR). Data points represent the mean normalized survival ± SD; each point is normalized to its own untreated control (without DOX) at each time interval. G-H) Bar graphs represent normalized survival of both CWR-R1 and 22Rv1 cells 7 days after dox-induction of shRNA. I-J) Western blot show successful SOX2 knockdown at 48h via shRNA in LASCPC-01 and siRNA in NCI-H660 NEPC cells. Protein bands were quantified using Empiria Studio. K) Normalized survival plots of LASCPC-01 NEPC cells after doxycycline induction of shRNA targeting SOX2 or a non-specific scrambled shRNA (sh-SCR). Data points represent the mean normalized survival ± SD; each point is normalized to its own untreated control (without DOX) at each time interval. L) Survival plot of NCI-H660 NEPC cells treated with siRNAs targeting SOX2. Data points represent mean luminescence +/− SD. M) Bar graph represents normalized survival of LASCPC-01 NEPC cells 7 days after dox-induction of shRNA. N) Bar graph represents raw survival of NCI-H660 NEPC cells 12 days after siRNA transfection. Data points represent mean luminescence +/− SD.
Figure 2.
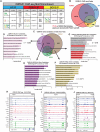
Figure 2.. SOX2 directly interacts with FOXA1 in PCa cells competitively with AR, as is corroborated with gene expression data in PCa patient samples.
A) All candidate TFs within 20bp of SOX2 peak in CWR-R1 cells. The e-value is the lowest p-value of any spacing of the secondary motif times the number of secondary motifs; it estimates the expected number of random secondary motifs that would have the observed minimum p-value or less. FOXA1 identified in red. The FOXA1-SOX2 motif enriched by ChIP-seq shows a potential direct interaction on the chromatin. B-F) Gene network signature analyses in PCa patient tumors using the Algorithm for Linking Activity Networks (ALAN) model. Datasets from publicly available sources are depicted across contexts of prostate cancer (GTEX, TCGA, SU2C, and Adeno and NEPC). Gene network signature for FOXA1 (orange) is visualized compared to the gene networks of AR (blue) and SOX2 (red) in each dataset where the median ALAN profile score for each gene network is noted with a black line. Overall network analysis is represented as positive for a median ALAN profile score above 0 and negative for a median ALAN profile score below 0. G) Proximity ligation assay (PLA) measures co-localization (red) of SOX2 and FOXA1 CWR-R1 castration-resistant prostate adenocarcinoma cells. H) Reciprocal co-immunoprecipitation of SOX2 and FOXA1 in CWR-R1 cells. I) Co-immunoprecipitation of FOXA1 with SOX2 in the NEPC cell line NCI-H660. J) Split nano-luciferase complementation reporter assay (Nano-BiT) demonstrating a specific interaction between SOX2 and FOXA1 in HEK293T cells. Tagged AR and FOXA1 were shown to interact as a positive control, and co-transfection of tagged AR and SOX2 were a negative control. Data points represent mean luminescence +/− SD. K) Lentiviral SOX2 overexpression (OE) ablates the AR-FOXA1 Nano-BiT interaction in HEK293T cells. Data points represent mean luminescence +/− SD. L) Lentiviral AR overexpression (OE) ablates the SOX2-FOXA1 Nano-BiT interaction in HEK293T cells, specifically in ARSI conditions. Data points represent mean luminescence +/− SD. M) Nano-BiT in prostate adenocarcinoma LNCaP cells demonstrates strong SOX2-FOXA1 interaction. No significant changes were observed across different AR-signaling contexts. Data points represent mean luminescence +/− SD. N) Western blots of CWR-R1 protein lysate from cells that underwent AR-pathway modulation. Protein bands were quantified using Empiria Studio.
Figure 3.
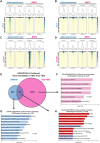
Figure 3.. SOX2 co-occupies sites on DNA with both FOXA1 and AR in CRPC adenocarcinoma cells, specifically near genes that promote cell proliferation.
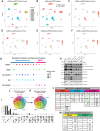
A) Binding motif enrichment near AR, FOXA1, and SOX2 peaks in CWR-R1 cells. Both MEME and STREME motif discovery analyses were included. Full lists of motifs discovered can be found in Supplementary Table 1. B) C) Venn diagram of AR, FOXA1, and SOX2 ChIP-seq peaks in CWR-R1 cells grown in whole media. Shared regions represent called peaks with >= 1bp of overlap. D) Venn diagram of AR, FOXA1, and SOX2 potential target genes. CWR-R1 ChIP-seq peaks were analyzed using Cistrome-GO to identify genes that had AR, FOXA1, and/or SOX2 transcription factor peaks less than 10kb from a TSS and an adjusted regulatory potential (RP) score of >0.01. E-H) Gene Ontology (GO) pathway analyses for the unique and shared AR, FOXA1, and SOX2 candidate target genes in CWR-R1. GO enrichment was performed using Enrichr. I-K) Track plots of AR, FOXA1, and SOX2 ChIP-seq peaks in CWR-R1 undergoing AR pathway modulation. Peaks visualized using IGV and mapped to the human hg38 chromosome build.
Figure 4.
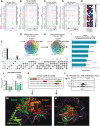
Figure 4.. SOX2 and FOXA1 share a cistrome in NEPC and co-regulate key genes implicated in cell proliferation and lineage plasticity.
A) Binding motif enrichment near FOXA1 and SOX2 peaks in NCI-H660 NEPC cells. Both MEME and STREME motif discovery analyses were included. Full lists of motifs discovered can be found in Supplementary Table 1. B) Venn diagram of SOX2 and FOXA1 ChIP-seq peaks in NCI-H660 cells grown in complete 5% FBS HITES media. Shared regions represent called peaks with >= 1bp of overlap. C) Venn diagram of SOX2 and FOXA1 potential target genes. NCI-H660 ChIP-seq peaks were analyzed using Cistrome-GO to identify genes that had AR, FOXA1, and/or SOX2 transcription factor peaks less than 10kb from a TSS and an adjusted regulatory potential (RP) score of >0.01. D-F) Gene Ontology (GO) pathway analyses for the unique and shared FOXA1 and SOX2 candidate target genes in NCI-H660. GO enrichment was performed using Enrichr. G-N) Track plots of SOX2 and FOXA1 ChIP-seq peaks near oncogenic/NEPC genes in NCI-H660. Peaks visualized using IGV and mapped to the human hg38 chromosome build.
Figure 5.
Figure 5.. SOX2 and FOXA1 reciprocally bind DNA sites and regulate proliferation in both adenocarcinoma and NEPC contexts.
A-D) Heatmaps of transcription factor binding in CWR-R1 and NCI-H660 cells. The vertical axis of each heatmap represents the top 1000 transcription factor binding sites by peak score in both adenocarcinoma and NEPC. E) Nested Venn diagram of the shared SOX2/FOXA1 candidate target genes (from Figures 3C and 4C) in both CWR-R1 and NCI-H660. We find 130 potentially SOX2/FOXA1 co-regulated genes across cell lines. F-H) Gene Ontology (GO) pathway analyses for the unique and shared CWR-R1 and NCI-H660 candidate SOX2/FOXA1 co-regulated genes. GO enrichment was performed using Enrichr.
Figure 6.
Figure 6.. SOX2 co-occupies sites with AR that are unaffected by AR signaling modulation, suggesting stabilizing the complex on the chromatin to promote AR-signaling inhibition (ARSI) resistance and lineage plasticity.
A-D) Track plots of AR, FOXA1, and SOX2 co-bound genes in CWR-R1 and NCI-H660. Peaks visualized using IGV and mapped to the human hg38 chromosome build. E) Heatmap of differential gene expression in Control vs. SOX2KO CWR-R1 cells. Data represent transcripts per million (TPM) values of RNA-seq triplicates. F) UpSet plot of AR and SOX2 ChIP-seq peaks in CWR-R1 cells. Shared regions represent called peaks with >= 1bp of overlap. G) Venn Diagram of AR and SOX2 ChIP-seq peaks in CWR-R1 cells. Shared regions represent called peaks with >= 1bp of overlap. H) Venn diagram of AR and SOX2 potential target genes. CWR-R1 ChIP-seq peaks were analyzed using Cistrome-GO to identify genes that had AR and/or SOX2 binding peaks less than 10kb from a TSS and an adjusted regulatory potential (RP) score of >0.01. I) Gene Ontology (GO) pathway analyses for the invariant AR and SOX2 candidate target genes in CWR-R1. GO enrichment was performed using Enrichr. J) Relative SOX2 and ROR1 mRNA expression in NCI-H660 cells following SOX2 siRNA knockdown normalized to β-actin. Data are represented as the fold change (2−ΔΔCT) ± SEM. K) The chosen sequence of the SOX2/FOXA1 co-bound region (peak summit) of the ROR1 gene used for computational modeling of the SOX2/FOXA1 interaction. L) Track plot of SOX2/FOXA1 co-binding in the ROR1 gene body. M) Computational modeling using the Chai-1 build of AlphaFold-3 to predict the structure of SOX2 and FOXA1 (UniProt IDs: P48431 and P55317, respectively) co-bound to DNA containing a single FOX motif within the ROR1 gene. N) Structure prediction of SOX2 and FOXA1 co-bound to DNA containing both an HMG-box and FOX motif within the ROR1 gene.
Figure 7.
Figure 7.. SOX2 expression is highest in AR-low patient tumors, especially in FGFR-driven Double Negative Prostate Cancer (DNPC) and displays a unique cistrome in cancer compared to normal tissues.
A) UMAP visualization of prostate cancer cell populations from 13 castration-resistant patients from the Human Metastatic Prostate (HMP) dataset. B) UMAP visualization of the same 13 patients categorized by histological type: adenocarcinoma and NEPC. C) NEPC signature analysis applied to CRPC patients. D-F) Expression analyses of AR, FOXA1, and SOX2 across the same UMAP coordinates G) Expression levels of genes (AR, FOXA1, SOX2) and pathway signatures (AR, NEPC scores) are shown through a bubble plot as organized by sample. H) Western blot panels of malignant prostate cancer cells for AR, FOXA1, SOX2, and the FGFR-family of proteins. Blots for β-actin were used as an internal loading control. I) UpSet plot of SOX2 ChIP-seq peaks in CWR-R1, NCI-H660, PrEC, WA-01 and NCCIT cells. Shared regions represent called peaks with >= 1bp of overlap. J) Venn Diagram SOX2 ChIP-seq peaks in CWR-R1, NCI-H660, PrEC, WA-01 and NCCIT cells. Shared regions represent called peaks with >= 1bp of overlap. K) Venn diagram of SOX2 potential target genes. SOX2 ChIP-seq peaks from all cell lines were analyzed using Cistrome-GO to identify genes that SOX2 binding peaks less than 10kb from a TSS and an adjusted regulatory potential (RP) score of >0.01. We find zero genes that are commonly bound by SOX2 across the different cell contexts. L) Binding motif enrichment near SOX2 peaks in PrEC, CWR-R1, and NCI-H660 cells. Both MEME and STREME motif discovery analyses were included. Full lists of motifs discovered can be found in Supplementary Table 1. M) Binding motif enrichment near SOX2 peaks in pluripotent WA-01 and NCCIT cells. Both MEME and STREME motif discovery analyses were included. Full lists of motifs discovered can be found in Supplementary Table 1.

References

    1. Sherman R.L., Firth A.U., Henley S.J., Siegel R.L., Negoita S., Sung H., Kohler B.A., Anderson R.N., Cucinelli J., Scott S., et al. (2025). Annual Report to the Nation on the Status of Cancer, featuring state-level statistics after the onset of the COVID-19 pandemic. Cancer 131, e35833. 10.1002/cncr.35833. - DOI - PMC - PubMed
    1. Huggins C., and Hodges C.V. (1972). Studies on prostatic cancer. I. The effect of castration, of estrogen and androgen injection on serum phosphatases in metastatic carcinoma of the prostate. CA Cancer J Clin 22, 232–240. 10.3322/canjclin.22.4.232. - DOI - PubMed
    1. De Marzo A.M., Meeker A.K., Epstein J.I., and Coffey D.S. (1998). Prostate stem cell compartments: expression of the cell cycle inhibitor p27Kip1 in normal, hyperplastic, and neoplastic cells. Am J Pathol 153, 911–919. 10.1016/S0002-9440(10)65632-5. - DOI - PMC - PubMed
    1. Isaacs J.T., Furuya Y., and Berges R. (1994). The role of androgen in the regulation of programmed cell death/apoptosis in normal and malignant prostatic tissue. Semin Cancer Biol 5, 391–400. - PubMed
    1. Teng M., Zhou S., Cai C., Lupien M., and He H.H. (2021). Pioneer of prostate cancer: past, present and the future of FOXA1. Protein Cell 12, 29–38. 10.1007/s13238-020-00786-8. - DOI - PMC - PubMed

Publication types