

This is a preprint.
High-Resolution EEG Source Reconstruction from PCA-Corrected BEM-FMM Reciprocal Basis Funcions: A Study with Visual Evoked Potentials from Intermittent Photic Stimulation
- PMID: 40791388
- PMCID: PMC12338504
- DOI: 10.1101/2025.07.11.664246
High-Resolution EEG Source Reconstruction from PCA-Corrected BEM-FMM Reciprocal Basis Funcions: A Study with Visual Evoked Potentials from Intermittent Photic Stimulation
Abstract
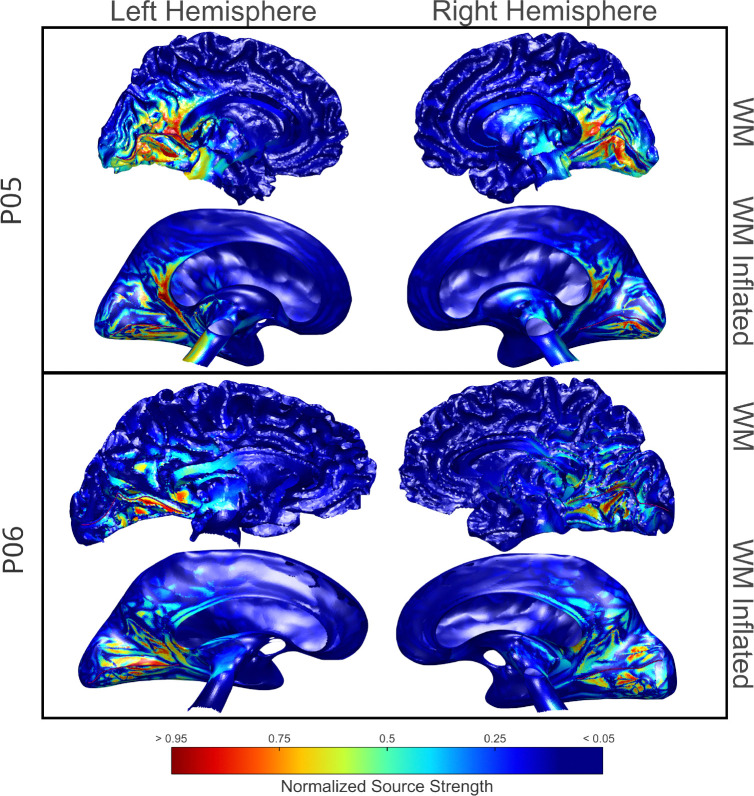
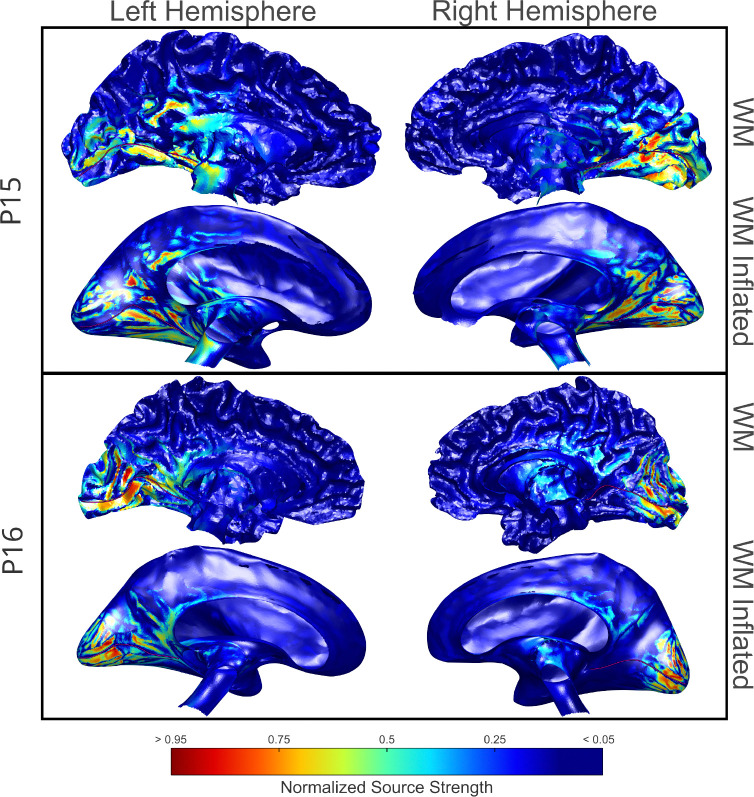
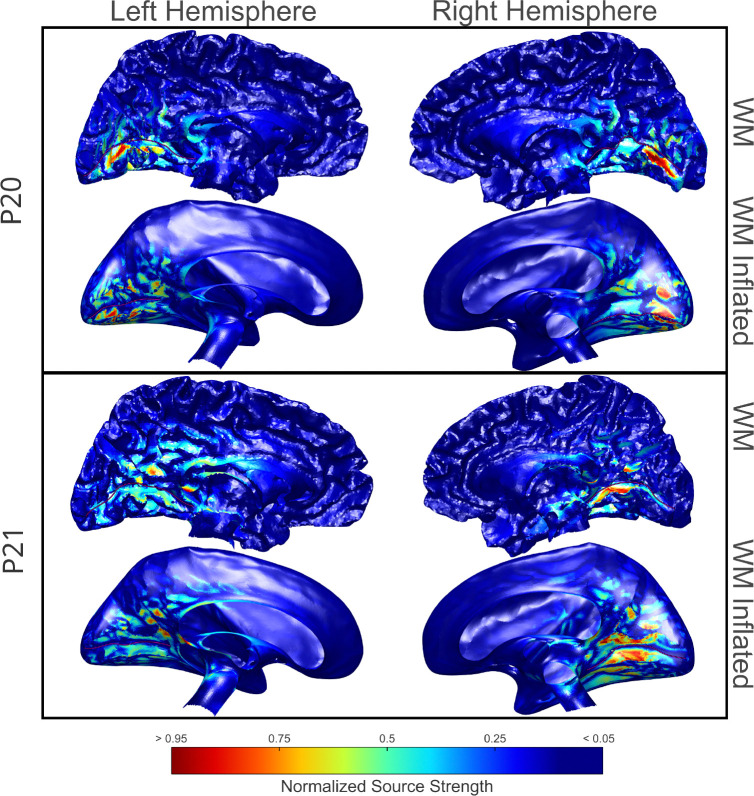
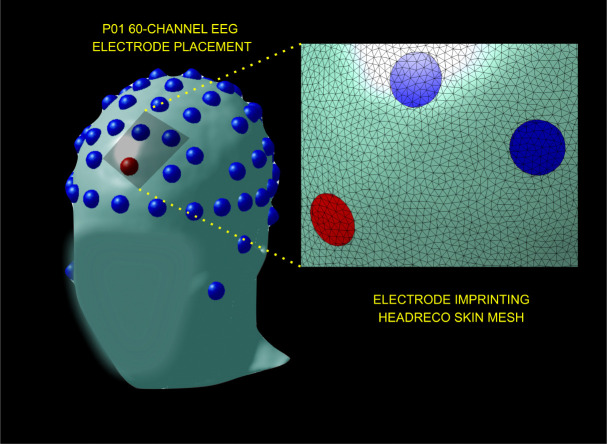
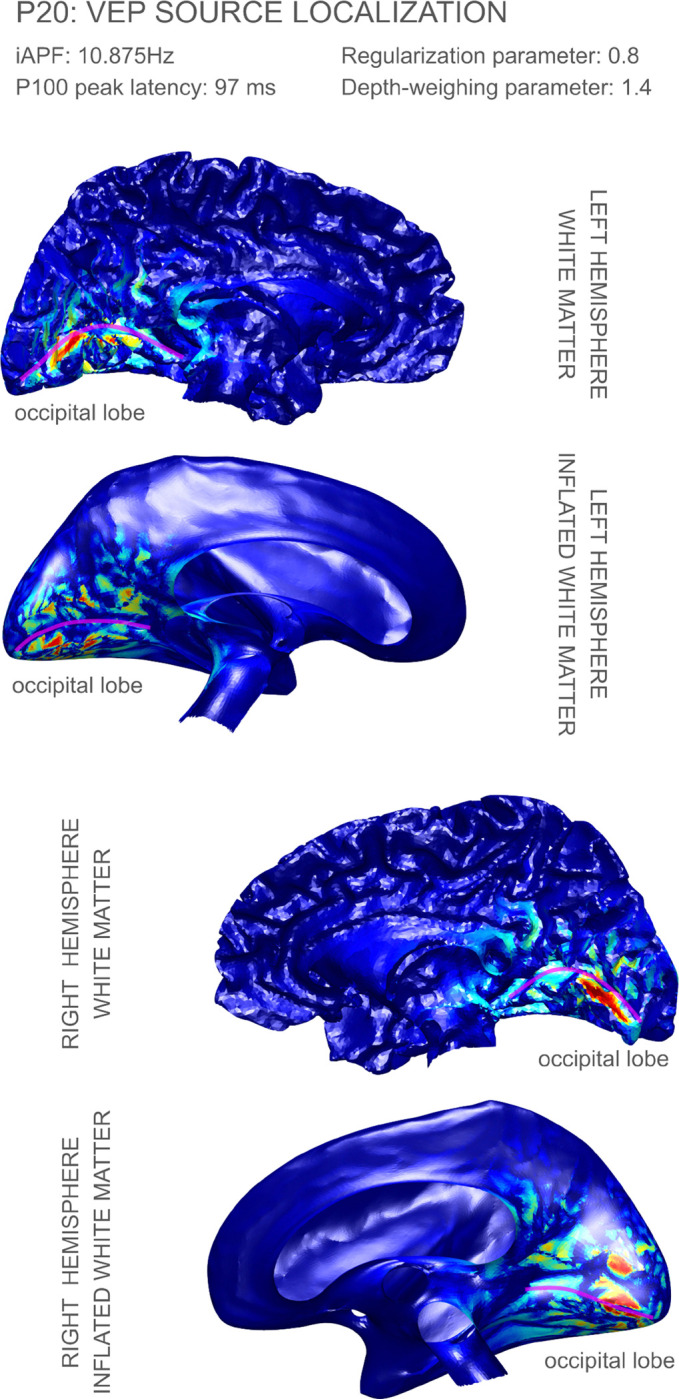
Modern automated human head segmentations can generate high-resolution computational meshes involving many non-nested tissues. However, most source reconstruction software is limited to 3 -4 nested layers of low resolution and a small number of dipolar sources ~10,000. Recently, we introduced modeling techniques for source reconstruction of magnetoencephalographic (MEG) signals using the reciprocal approach and the boundary element fast multipole method (BEM-FMM). The technique of BEM-FMM can process both nested and non-nested models with as many as 4 million surface elements. In this paper, we present an analogue technique for source reconstruction of electroencephalographic (EEG) signals based on cortical global basis functions. The present work uses Helmholtz reciprocity to relate the reciprocally-generated lead-field matrices to their direct counterpart, while resolving the issue of possible biases toward the reference electrode. Our methodology is tested with experimental EEG data collected from a cohort of 12, young and healthy, volunteers subjected to intermittent photic stimulation (IPS). Our novel high-resolution source reconstruction models can have impact on mental health screening as well as brain-computer interfaces.
Figures


Similar articles
-
Improved Source Localization of Auditory Evoked Fields using Reciprocal BEM-FMM.bioRxiv [Preprint]. 2025 Jul 11:2025.05.09.653081. doi: 10.1101/2025.05.09.653081. bioRxiv. 2025. PMID: 40462983 Free PMC article. Preprint.
-
Prescription of Controlled Substances: Benefits and Risks.2025 Jul 6. In: StatPearls [Internet]. Treasure Island (FL): StatPearls Publishing; 2025 Jan–. 2025 Jul 6. In: StatPearls [Internet]. Treasure Island (FL): StatPearls Publishing; 2025 Jan–. PMID: 30726003 Free Books & Documents.
-
Short-Term Memory Impairment.2024 Jun 8. In: StatPearls [Internet]. Treasure Island (FL): StatPearls Publishing; 2025 Jan–. 2024 Jun 8. In: StatPearls [Internet]. Treasure Island (FL): StatPearls Publishing; 2025 Jan–. PMID: 31424720 Free Books & Documents.
-
Systemic pharmacological treatments for chronic plaque psoriasis: a network meta-analysis.Cochrane Database Syst Rev. 2021 Apr 19;4(4):CD011535. doi: 10.1002/14651858.CD011535.pub4. Cochrane Database Syst Rev. 2021. Update in: Cochrane Database Syst Rev. 2022 May 23;5:CD011535. doi: 10.1002/14651858.CD011535.pub5. PMID: 33871055 Free PMC article. Updated.
-
Systemic pharmacological treatments for chronic plaque psoriasis: a network meta-analysis.Cochrane Database Syst Rev. 2020 Jan 9;1(1):CD011535. doi: 10.1002/14651858.CD011535.pub3. Cochrane Database Syst Rev. 2020. Update in: Cochrane Database Syst Rev. 2021 Apr 19;4:CD011535. doi: 10.1002/14651858.CD011535.pub4. PMID: 31917873 Free PMC article. Updated.
References
-
- Chota Samson et al. (2024). “Steady-state Visual Evoked Potentials Reveal Dynamic (Re)allocation of Spatial Attention during Maintenance and Utilization of Visual Working Memory”. In: Journal of Cognitive Neuroscience 36.5, pp. 800–814. ISSN: 0898–929X. DOI: 10.1162/jocn_a_02107. URL: - DOI - PubMed
-
- Compston Alastair (2009). “The Berger rhythm: potential changes from the occipital lobes in man, by E.D. Adrian and B.H.C. Matthews (From the Physiological Laboratory, Cambridge). Brain 1934: 57; 355–385.” In: Brain 133.1, pp. 3–6. ISSN: 0006–8950. DOI: 10.1093/brain/awp324. eprint: https://academic.oup.com/brain/article-pdf/133/1/3/894742/awp324.pdf. URL: https://doi.org/10.1093/brain/awp324. - DOI - DOI - PubMed
Publication types
Grants and funding
LinkOut - more resources
Full Text Sources