. 2025 Jul 23:10:100366.
doi: 10.1016/j.ijpx.2025.100366. eCollection 2025 Dec.

Release mechanisms of PLGA microparticles prepared using a microfluidics device or a beaker

Affiliations

Release mechanisms of PLGA microparticles prepared using a microfluidics device or a beaker

L A Lefol et al. Int J Pharm X. .

Abstract

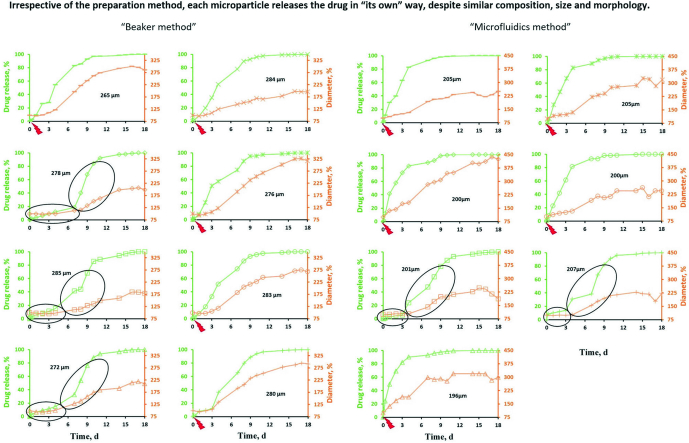
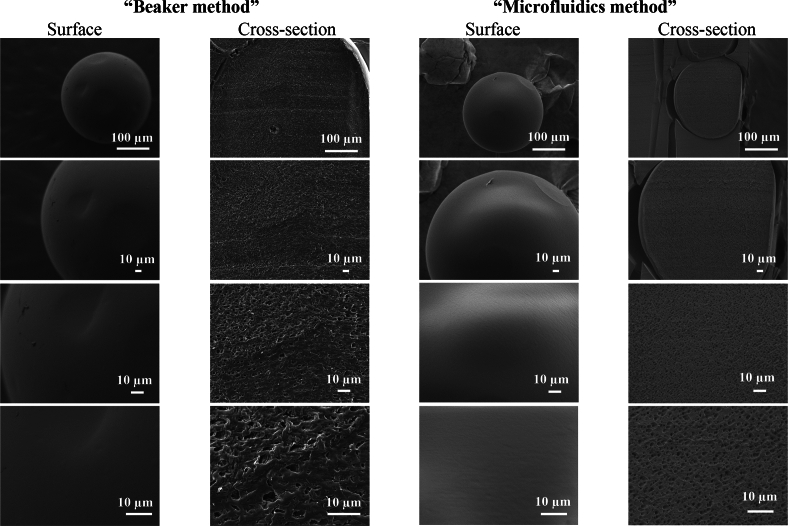
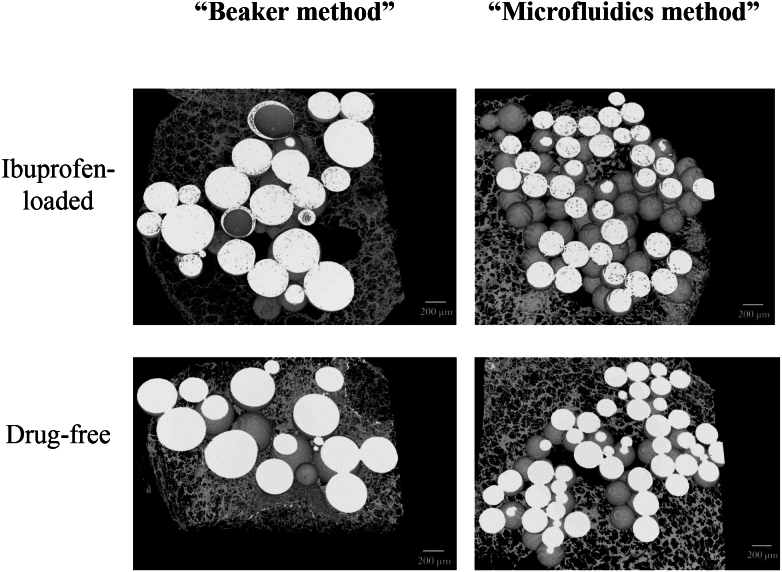
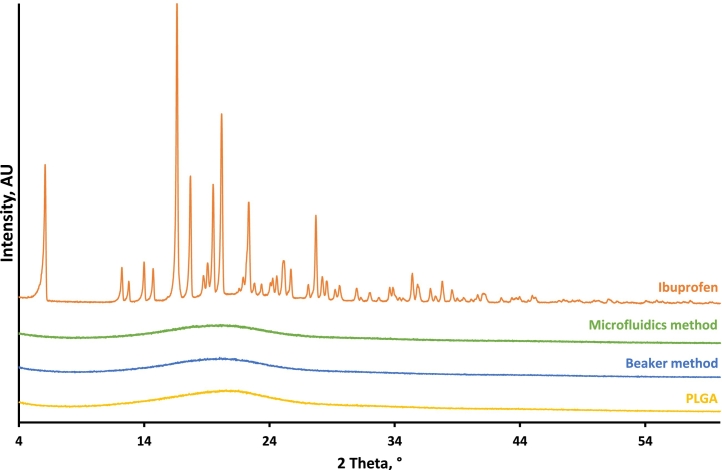
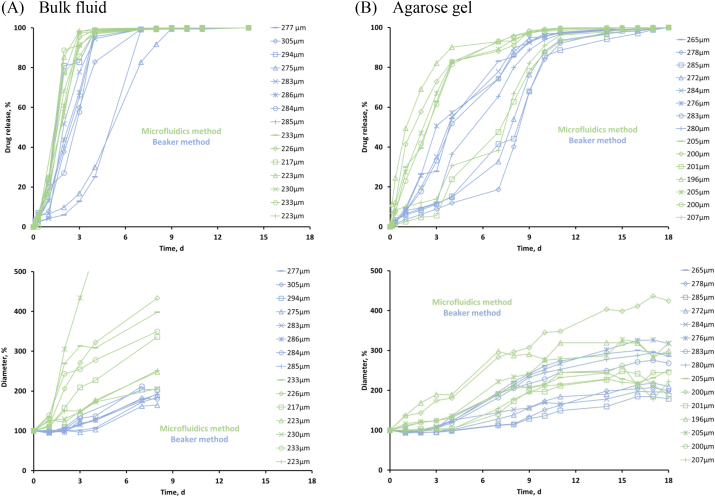
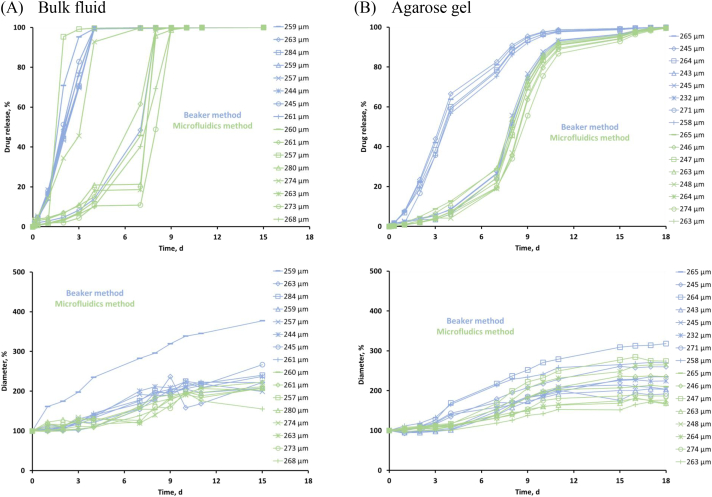
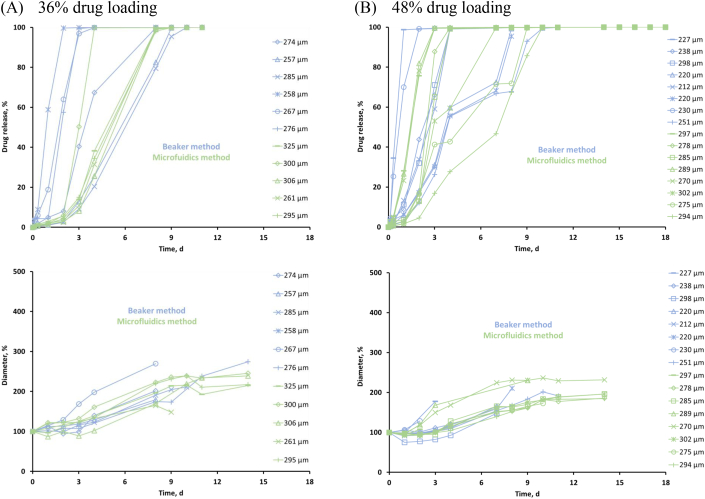
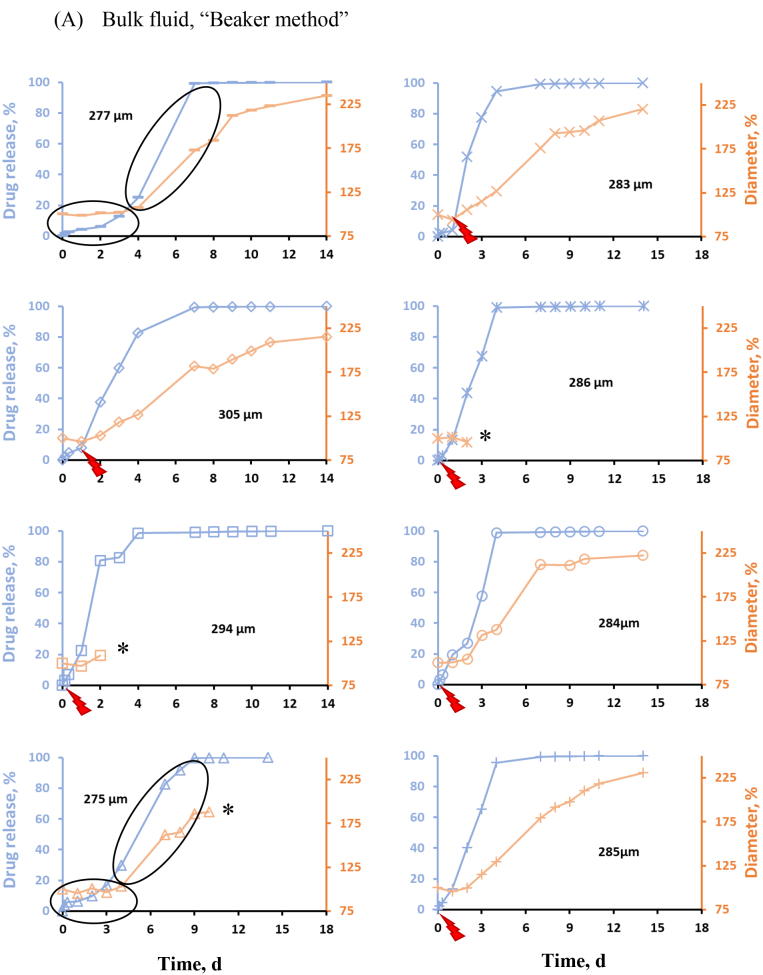
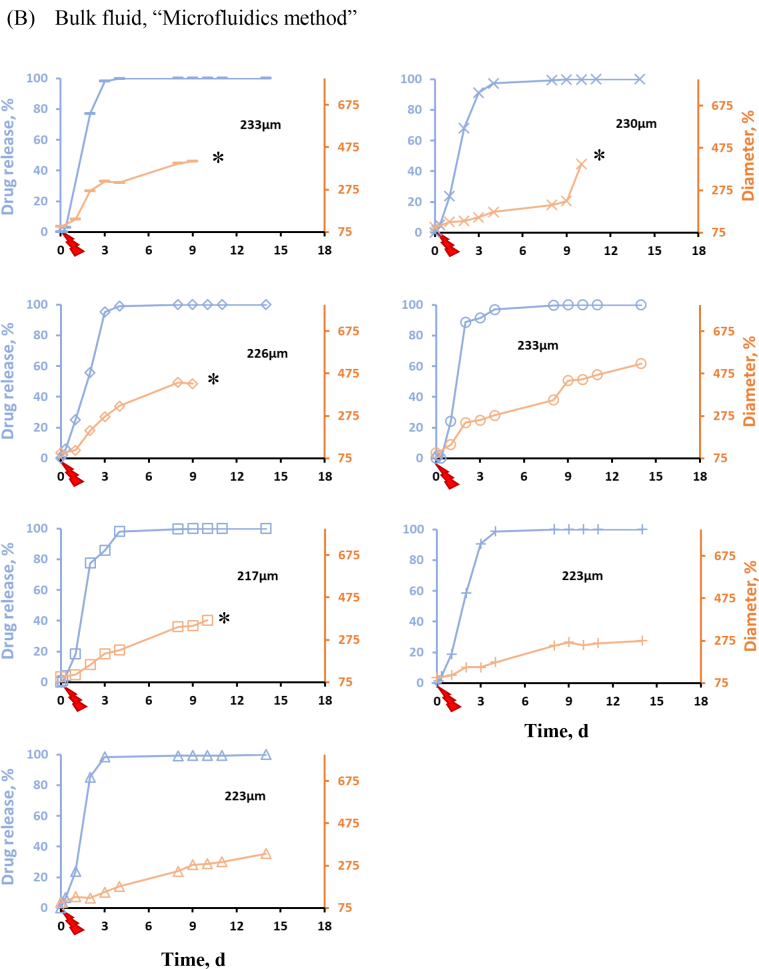
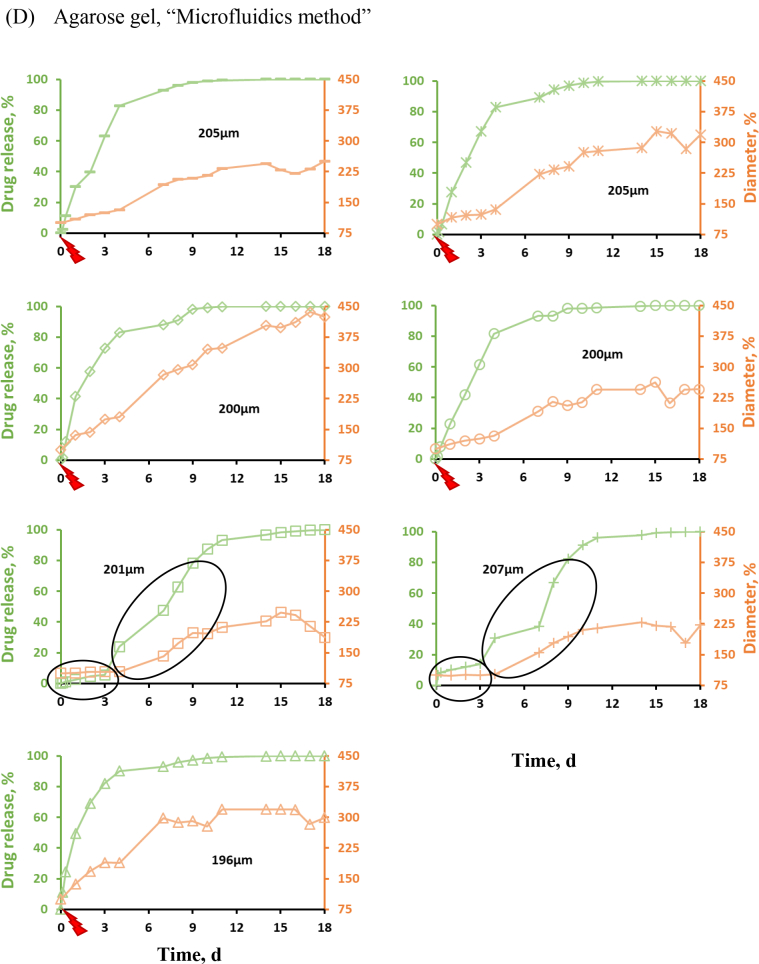
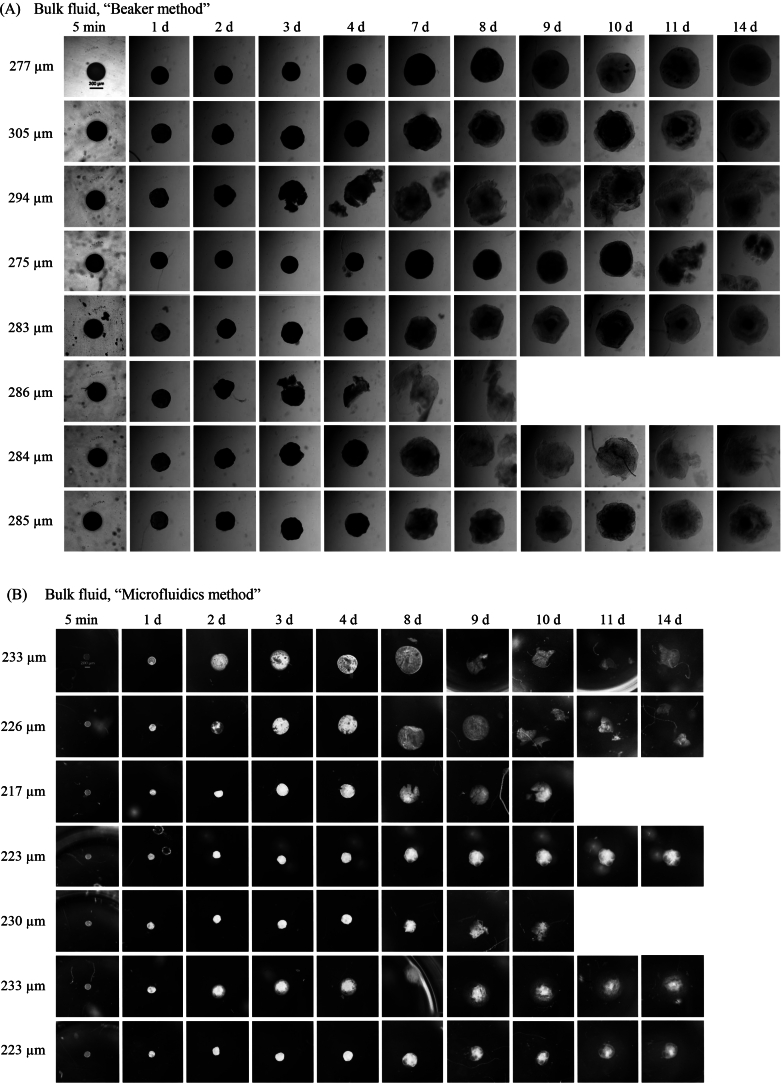
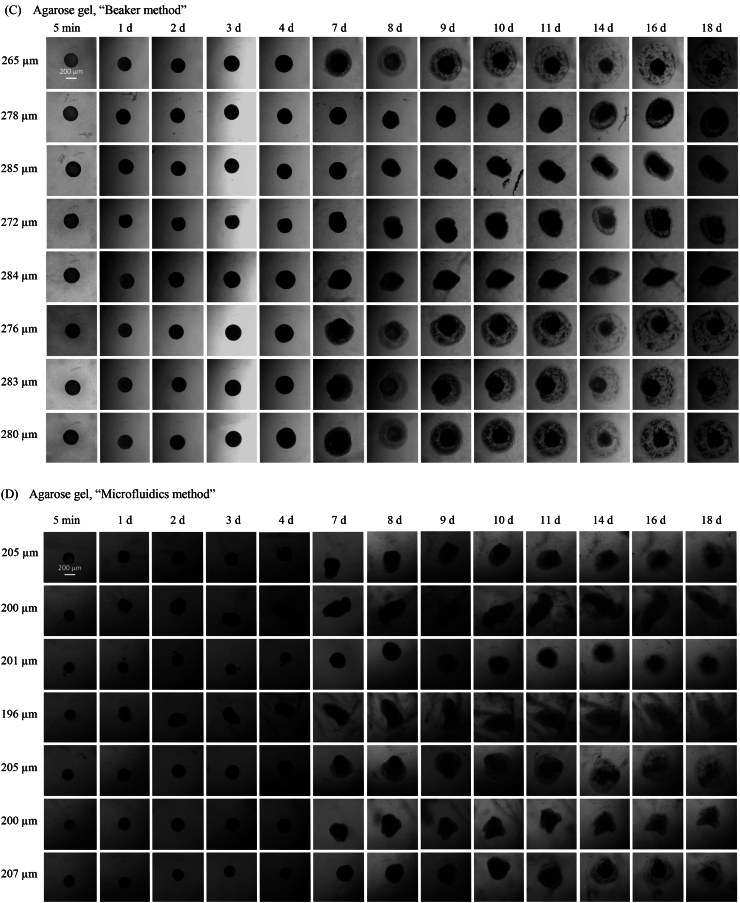
The aim of this study was to better understand the release mechanisms of poly(lactic-co-glycolic acid) (PLGA) microparticles prepared via emulsification - solvent extraction/evaporation using a "classical beaker" vs. a "microfluidics device". Ibuprofen-loaded microparticles were studied by optical microscopy, SEM, X-ray powder diffraction, X-ray μCT and drug release measurements from single microparticles in well agitated phosphate buffer pH 7.4 or agarose gel (mimicking living tissue). The use of a microfluidics device facilitated the preparation of microparticles with a less broad size distribution. However, in addition to the microparticle size, the inner system structure was found to be also of utmost importance for the resulting drug release kinetics in this case. Interestingly, even microparticles with similar size, composition and inner & outer structure exhibited a broad spectrum of individual drug release patterns. This was true, irrespective of the type of preparation method and experimental release set-up, and could be explained as follows: The investigated microparticles were characterized by a continuous inner pore network and an initially smooth & non-porous surface. Drug release set on as soon as: (i) the pore network got direct access to the release medium (e.g., due to a "weak point" in the PLGA surface layer), or (ii) substantial system swelling started (after a lag-time of several days). Importantly, each microparticle had its own, specific structure, which determined "its way" to release the drug. Furthermore, the experimental conditions were found to be of key importance: The presence of a surrounding agarose gel protected the microparticles from damage caused by convective fluid flow, and hindered microparticle swelling, thus, slowing down drug release.

Keywords: Agarose gel; Drug release mechanism; Ibuprofen; Microfluidics; Microparticles; PLGA; Swelling.


Conflict of interest statement

The authors declare the following financial interests/personal relationships which may be considered as potential competing interests: L.A. Lefol, P. Bawuah, J.A. Zeitler, J. Verin, J. Siepmann, F. Siepmann report financial support was provided by Interreg 2 Seas. L.A. Lefol, P. Bawuah, J.A. Zeitler, J. Verin, J. Siepmann, F. Siepmann report financial support was provided by European Regional Development Fund. J. Siepmann, F. Siepmann report financial support was provided by Interreg FWVL. Two co-authors of this article (J Siepmann and F Siepmann) are the guest editors of the special issue this article is part of. Furthermore, the Editor-in-Chief of the journal is one of the co-authors of this article (J Siepmann). The manuscript has been subject to all of the journal's usual procedures, including peer review, which has been handled independently of J Siepmann and F Siepmann. If there are other authors, they declare that they have no known competing financial interests or personal relationships that could have appeared to influence the work reported in this paper.

Figures

Unlabelled Image
Graphical abstract
Fig. 1
Fig. 1
Schematic presentations of the investigated microparticle preparation techniques, using a: (A) classical beaker, or (B) microfluidics-assisted device.
Fig. 2
Fig. 2
Optical microscopy pictures of ibuprofen-loaded microparticles prepared with the “Beaker method” or “Microfluidics-assisted technique” (before exposure to release medium, 15 % drug loading).
Fig. 3
Fig. 3
SEM pictures of surfaces and cross-sections of ibuprofen-loaded microparticles prepared with the “Beaker method” or “Microfluidics-assisted method” (before exposure to release medium, 15 % drug loading). The degree of magnification increases from the top to the bottom.
Fig. 4
Fig. 4
X-μCT images (virtual cross-sections) of microparticles loaded with 15 % ibuprofen prepared with the “Beaker method” or “Microfluidics-assisted method” (before exposure to release medium) (top row). For reasons of comparison, also drug-free microparticles are shown (bottom row).
Fig. 5
Fig. 5
X-ray diffraction patterns of PLGA microparticles loaded with 15 % ibuprofen, prepared with the “Beaker method” or “Microfluidics-assisted method” (before exposure to the release medium). For reasons of comparison, also the X-ray diffraction patterns of the raw materials are shown (PLGA, ibuprofen).
Fig. 6
Fig. 6
Drug release from and swelling of ibuprofen-loaded PLGA microparticles upon exposure to: (A) well agitated phosphate buffer pH 7.4, or (B) agarose gel. The microparticles were prepared with the “Beaker method” (marked in blue) or “Microfluidics-assisted method” (marked in green). Single microparticles were studied, their initial diameters are indicated on the right-hand side of the diagrams. The same symbols are used to illustrate drug release and swelling of the same microparticle. The drug loading was 15 %. (For interpretation of the references to colour in this figure legend, the reader is referred to the web version of this article.)
Fig. 7
Fig. 7
Drug release from and swelling of ibuprofen-loaded PLGA microparticles upon exposure to: (A) well agitated phosphate buffer pH 7.4, or (B) agarose gel. The microparticles were prepared with the “Beaker method” (marked in blue) or “Microfluidics-assisted method” (marked in green). Single microparticles were studied, their initial diameters are indicated on the right-hand side of the diagrams. The same symbols are used to illustrate drug release and swelling of the same microparticle. The drug loading was 22 %. (For interpretation of the references to colour in this figure legend, the reader is referred to the web version of this article.)
Fig. 8
Fig. 8
Drug release from and swelling of single PLGA microparticles loaded with: (A) 36 %, or (B) 48 % ibuprofen upon exposure to well agitated phosphate buffer pH 7.4. The microparticles were prepared with the “Beaker method” (marked in blue) or “Microfluidics-assisted method” (marked in green). The results obtained with microparticles containing 48 % drug prepared by the “beaker method” are reproduced from (Lefol et al., 2023), with permission. The initial microparticle diameters are indicated on the right-hand side of the diagrams. The same symbols are used to illustrate drug release and swelling of the same microparticle. (For interpretation of the references to colour in this figure legend, the reader is referred to the web version of this article.)
Fig. 9
Fig. 9
Ibuprofen release from and swelling kinetics of single microparticles: (A) prepared with the “Beaker method” upon exposure to well agitated bulk fluid, (B) prepared with the “Microfluidics method” upon exposure to well agitated bulk fluid, (C) prepared with the “Beaker method” upon exposure to agarose gel, and (D) prepared with the “Microfluidics method” upon exposure to agarose gel. The drug loading was 15 % in all cases. Each diagram shows the behavior of a specific single microparticle. The initial microparticle diameter is indicated in each diagram. The blue curves illustrate drug release in well agitated bulk fluid, the green curves in agarose gel. The orange curves show the swelling kinetics of the microparticles. Red flashes indicate time points at which the inner pore network gets direct surface access. Black ovals are used to mark the onset of significant system swelling, coinciding with an acceleration of drug release. An asterisk indicates microparticle fragmentation. (For interpretation of the references to colour in this figure legend, the reader is referred to the web version of this article.)
Fig. 9
Fig. 9
Ibuprofen release from and swelling kinetics of single microparticles: (A) prepared with the “Beaker method” upon exposure to well agitated bulk fluid, (B) prepared with the “Microfluidics method” upon exposure to well agitated bulk fluid, (C) prepared with the “Beaker method” upon exposure to agarose gel, and (D) prepared with the “Microfluidics method” upon exposure to agarose gel. The drug loading was 15 % in all cases. Each diagram shows the behavior of a specific single microparticle. The initial microparticle diameter is indicated in each diagram. The blue curves illustrate drug release in well agitated bulk fluid, the green curves in agarose gel. The orange curves show the swelling kinetics of the microparticles. Red flashes indicate time points at which the inner pore network gets direct surface access. Black ovals are used to mark the onset of significant system swelling, coinciding with an acceleration of drug release. An asterisk indicates microparticle fragmentation. (For interpretation of the references to colour in this figure legend, the reader is referred to the web version of this article.)
Fig. 10
Fig. 10
Optical microscopy pictures of ibuprofen-loaded microparticles: (A) prepared with the “Beaker method” upon exposure to well agitated bulk fluid, (B) prepared with the “Microfluidics method” upon exposure to well agitated bulk fluid, (C) prepared with the “Beaker method” upon exposure to agarose gel, and (D) prepared with the “Microfluidics method” upon exposure to agarose gel. The exposure times are indicated at the top, the initial microparticle diameters on the left-hand side. The drug loading was 15 %.
Fig. 10
Fig. 10
Optical microscopy pictures of ibuprofen-loaded microparticles: (A) prepared with the “Beaker method” upon exposure to well agitated bulk fluid, (B) prepared with the “Microfluidics method” upon exposure to well agitated bulk fluid, (C) prepared with the “Beaker method” upon exposure to agarose gel, and (D) prepared with the “Microfluidics method” upon exposure to agarose gel. The exposure times are indicated at the top, the initial microparticle diameters on the left-hand side. The drug loading was 15 %.

References

    1. Berkland C., King M., Cox A., Kim K., Pack D.W. Precise control of PLG microsphere size provides enhanced control of drug release rate. J. Control. Release. 2002;82(1):137–147. doi: 10.1016/S0168-3659(02)00136-0. - DOI - PMC - PubMed
    1. Blasi P., D’Souza S.S., Selmin F., DeLuca P.P. Plasticizing effect of water on poly(lactide-co-glycolide) J. Control. Release. 2005;108(1):1–9. doi: 10.1016/j.jconrel.2005.07.009. - DOI - PubMed
    1. Blasi P., Schoubben A., Giovagnoli S., Perioli L., Ricci M., Rossi C. Ketoprofen poly(lactide-co-glycolide) physical interaction. AAPS PharmSciTech. 2007;8(2):1–8. doi: 10.1208/pt0802037. - DOI - PMC - PubMed
    1. Bode C., Kranz H., Siepmann F., Siepmann J. In-situ forming PLGA implants for intraocular dexamethasone delivery. Int. J. Pharm. 2018;548(1):337–348. doi: 10.1016/j.ijpharm.2018.07.013. - DOI - PubMed
    1. Bode C., Kranz H., Siepmann F., Siepmann J. Coloring of PLGA implants to better understand the underlying drug release mechanisms. Int. J. Pharm. 2019;569 doi: 10.1016/j.ijpharm.2019.118563. - DOI - PubMed

LinkOut - more resources