. 2025 Jul 28:13:1615650.
doi: 10.3389/fbioe.2025.1615650. eCollection 2025.

Restoration of tendon repair microenvironment by grapefruit exosome-loaded microneedle system for tendinopathy therapy

Affiliations

Restoration of tendon repair microenvironment by grapefruit exosome-loaded microneedle system for tendinopathy therapy

Yuan Zhang et al. Front Bioeng Biotechnol. .

Abstract

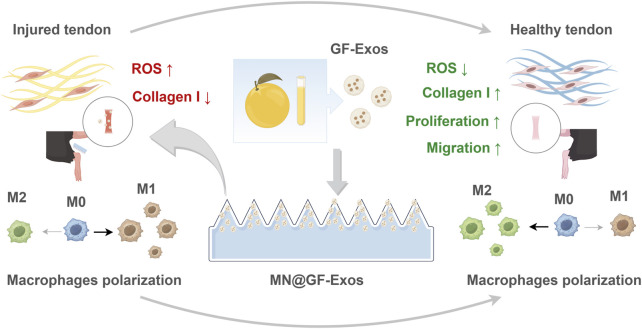
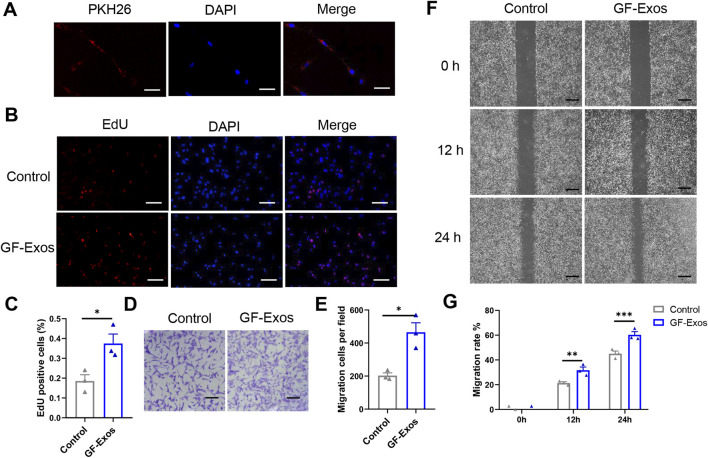
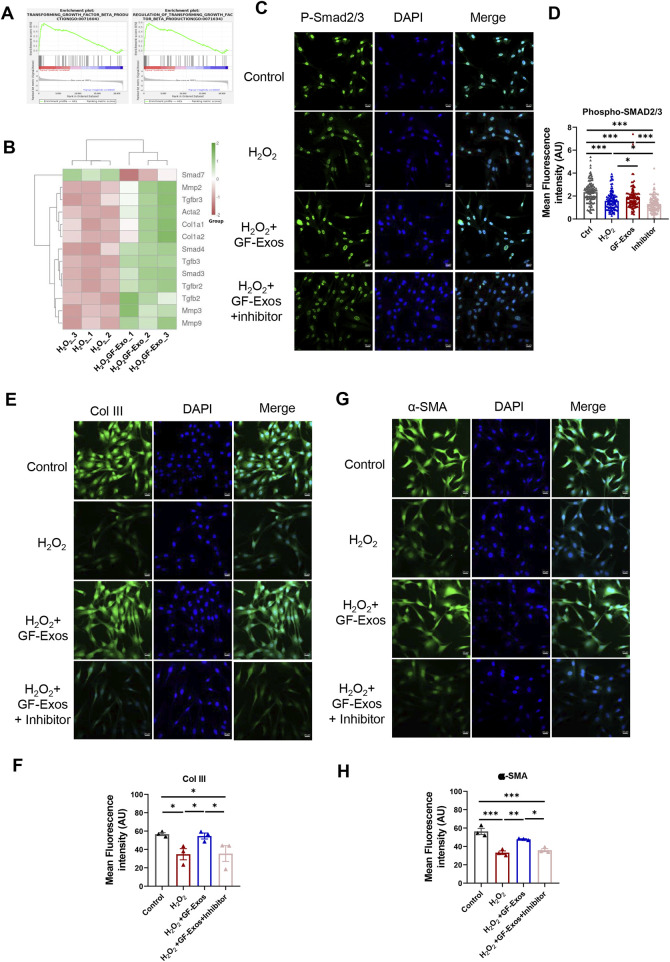
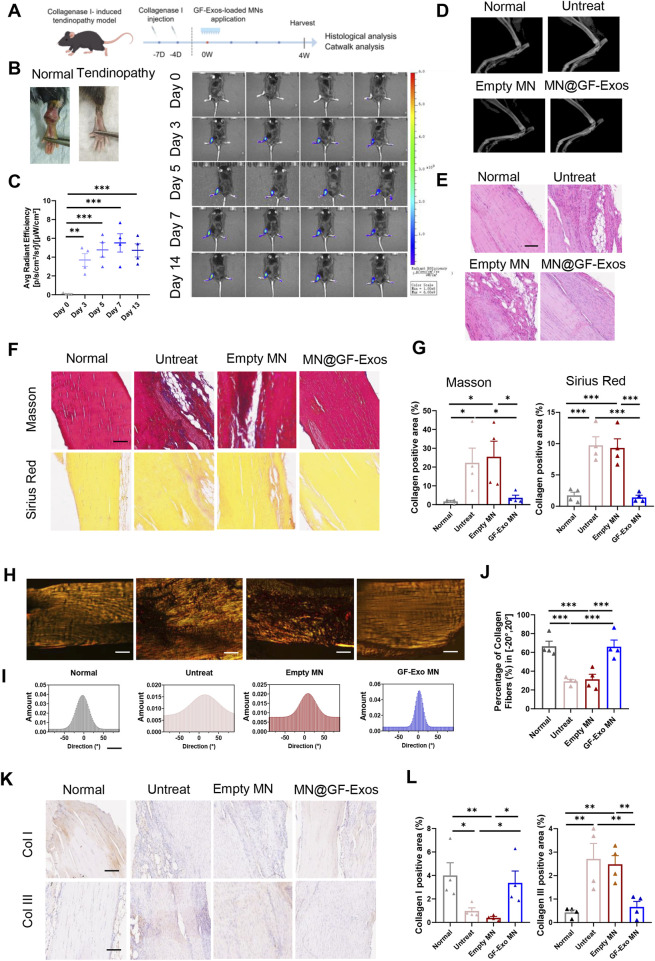
Tendinitis repair remains challenging due to the limited self-renewal capacity of tenocytes and persistent inflammatory microenvironment. Conventional therapies remain limited by systemic drug toxicity and fail to coordinate immunomodulation with matrix remodeling. Plant-derived extracellular vesicles have demonstrated tissue repair potential owing to their unique bioactive components and exceptional cross-species compatibility. Nevertheless, their therapeutic role in tendon matrix regeneration remains underexplored. Here, we developed a grapefruit-derived exosome-loaded microneedle patch (MN@GF-Exos) to synergistically restored tendon structure and functions. Grapefruit-derived exosomes (GF-Exos) were loaded into dissolvable hyaluronic acid microneedles (MNs) for sustained release. GF-Exos reversed oxidative stress in tenocytes, enhancing cellular proliferation and migration, restoring collagen I synthesis, and polarizing macrophages toward M2-repair phenotypes. Transcriptomics revealed GF-Exos modulated cytokine-cytokine receptor interactions, suppressing inflammation-related pathways and activating ECM organization genes. In collagenase-induced tendinopathy mice, MN@GF-Exos enhanced gait recovery and extracellular matrix remodeling. Histology confirmed reduced fibrosis without ectopic ossification. Systemic safety was validated by unchanged organ histology and within-normal-limits serum biomarkers. This dual-functional system leverages plant exosomes' multi-component synergy and MN's spatiotemporal control, offering a translatable strategy for chronic tendon regeneration.

Keywords: grapefruit-derived exosome; macrophage polarization; microneedles; oxidative stress; tendinopathy.


Conflict of interest statement

The authors declare that the research was conducted in the absence of any commercial or financial relationships that could be construed as a potential conflict of interest.

Figures

FIGURE 1
FIGURE 1
Schematic illustrating MN@GF-Exos-mediated therapeutic mechanisms against tendinopathy through coordinated modulation of tenocyte proliferation/migration enhancement, oxidative stress suppression, collagen I synthesis restoration, and M2 macrophage polarization (By Figdraw).
FIGURE 2
FIGURE 2
Characterization of GF-Exos and Microneedles. (A) Representing images of sucrose density gradient centrifugation. (B) Transmission electron microscopy (TEM) images depicting exosomes from Band 1 and Band 2. (Scale bar = 200 µm) (C) Particle size of GF-Exos determined by Nanoparticle tracking analysis (NTA). (D) Diagrammatic representation of the synthesis pathway for MN@GF-Exos. (E) Optical Micrographs of MN@GF-Exos. (Scale bar = 500 µm) (F) SEM Micrographs of MN@GF-Exos. (Scale bar = 200 µm) (G) Mechanical Characterization of MN@GF-Exos.
FIGURE 3
FIGURE 3
In vitro effect of GF-Exo on Tendon cells. (A) Uptake of PKH26-labeled GF-Exos by microglial cells in vitro. (Scale bar = 50 µm) (B) Proliferation of primary tendon cells treated with control or GF-Exos. The 5-ethynyl-2′-deoxyuridine (EdU)-positive cells represent new dividing cells and are stained (red). The nucleus was counterstained with 4′,6-diamidino-2-phenylindole (DAPI; blue). (Scale bar = 50 µm) (C) Quantification of Edu-positive cells in control and GF-Exos-treated groups. (D) Representative microscopic images of cells that migrated through the transwell in the migration assay (Giemsa stain). (Scale bar = 50 µm) (E) Quantification of migration cells per field in control and GF-Exos-treated groups. (F) Representative microscopic images of scratch closure in control and GF-Exos-treated groups at 0, 12, and 24 h (Scale bar = 200 µm) (G) Quantification of scratch closure in the different groups at 0, 12, and 24 h *p < 0.05, **p < 0.01, ***p < 0.001 vs. Control; n = 3; All data are shown as the mean ± Standard Error of the Mean (SEM); Statistical significance was determined by Student’s t-test.
FIGURE 4
FIGURE 4
GF-Exos alleviates H2O2-induced oxidative stress and type I collagen synthesis disorder and regulates macrophage polarization. (A) ROS detection in primary tendon cells treated with Control and GF-Exos under H2O2 stimulation, where green fluorescence (DCFHDA) indicates ROS levels, with DAPI staining for nuclei. (Scale bars: 50 µm) (B) Quantification of mean fluorescence intensity of DCF in control, H2O2 and H2O2+GF-Exos groups. (C) Immunofluorescence staining of the primary tendon cells after being cocultured with control, and GF-Exos under H2O2 stimulation. Collagen I (green); phalloidin (Yellow); Nucleus (Blue). (Scale bars: 50 µm) (D) Quantification of mean fluorescence intensity of Collagen I in control, H2O2 and H2O2+GF-Exos groups. (E) Immunofluorescence staining of the mouse alveolar macrophages cells after being cocultured with control, and GF-Exos under LPS stimulation. CD206 (green); CD86 (Red); Nucleus (DAPI, Blue). (Scale bars: 50 µm) (F) Quantification of mean fluorescence intensity of CD86 in control, LPS and LPS + GF-Exos groups. (G) Quantification of mean fluorescence intensity of CD206 in control, LPS and LPS + GF-Exos groups. *p < 0.05, **p < 0.01, ***p < 0.001; n = 3; All data are shown as the mean ± Standard Error of the Mean (SEM); Statistical significance was determined by one-way ANOVA with Fisher’s LSD test.
FIGURE 5
FIGURE 5
Changes in transcriptome profile of GF-Exo-treated tendon cells against ROS in vitro. (A) Pearson correlation between H2O2 and H2O2+GF-Exos RNA-Seq data. The change of the square (R 2) value of the correlation coefficient of Pearson is indicated by the change of the blue color. The deeper color indicates a bigger R 2 value and a higher correlation between samples. (B) The volcano plot of differentially expressed genes (DEGs) between H2O2+GF-Exos group and H2O2 group. (C) Hierarchical clustering of the differentially expressed genes. The blue bands represent downregulated genes, and the red bands represent upregulated genes. (D) The results of Gene Ontology (GO) enrichment analysis in upregulated genes. (E) The results of Gene Ontology (GO) enrichment analysis in downregulated genes. (F) Enrichment analysis of the KEGG pathways for the differentially expressed genes.
FIGURE 6
FIGURE 6
GF-Exos alleviates H2O2-induced oxidative stress through TGF-β signaling. (A) GSEA plot of the genes associated with transforming growth factor beta production and regulation of transforming growth factor beta transforming. (B) Expression profiles of genes related to TGF-β signaling. (C) Representative images of immunofluorescence staining of phospho-smad2/3 in control, H2O2, , H2O2+ GF-Exos and H2O2+ GF-Exos + TGF-β inhibitor groups. phospho-smad2/3 (green); Nucleus (DAPI, Blue). (Scale bars: 20 µm). (D) Quantification of mean fluorescence intensity of phospho-smad2/3 in control, H2O2, H2O2+GF-Exos, and H2O2+GF-Exos + TGF-β inhibitor groups. The signals from more than 100 cells per groups were quantified. (E) Representative images of immunofluorescence staining of collagen III in control, H2O2, H2O2+ GF-Exos and H2O2+ GF-Exos + TGF-β inhibitor groups. Collagen III (green); Nucleus (Blue). (Scale bars: 20 µm) (F) Quantification of mean fluorescence intensity of collagen III in control, H2O2, H2O2+ GF-Exos and H2O2+ GF-Exos + TGF-β inhibitor groups. (G) Representative images of immunofluorescence staining of α-SMA in control, H2O2, H2O2+ GF-Exos and H2O2+ GF-Exos + TGF-β inhibitor groups. α-SMA (green); Nucleus (Blue). (Scale bars: 20 µm) (H) Quantification of mean fluorescence intensity of α-SMA in control, H2O2, H2O2+ GF-Exos and H2O2+ GF-Exos + TGF-β inhibitor groups. p < 0.05, **p < 0.01, ***p < 0.001; n = 3 (E,F); All data are shown as the mean ± Standard Error of the Mean (SEM); Statistical significance was determined by one-way ANOVA with Fisher’s LSD test.
FIGURE 7
FIGURE 7
Local administration of MN@GF-Exos efficiently delays the progression of collagenase l-induced tendinopathies in mice. (A) Scheme of experiment design (By Figdraw). (B) Gross view of skin contours of tendons in the fourth week postoperatively. (C) In vivo imaging of mice after application of DiD-labeled GF-Exos MN at tendon site. Comparison of average radiance [p/s/cm2/sr] between different groups was measured at Day 0, 3, 5, 7, and 14 after GF-Exos MN administration. (D) Micro-CT scans of repaired Achilles tendons of each group in the fourth week postoperatively. (E) HE staining of tendons from different groups in the fourth week postoperatively. (Scale bar = 100 µm) (F) Sirius red and Masson’s trichrome staining of tendons from different groups in the fourth week postoperatively. (Scale bar = 100 µm) (G) Quantification analysis of Sirius red and Masson’s trichrome staining. (H) Representative images of Sirius red staining of tendons from different groups. (I) Representative results of collagen orientation analysis of tendon tissue from different group according to Pseudocolor images. (J) Quantification of percentage of collagen fibers with orientation between −20 to 20°. (K) Immunohistochemical staining of COL1 and COL3 of sections of each group in the fourth week postoperatively. (L) Quantification of COL1 and COL3 expression in different groups. *p < 0.05; **p < 0.01; ***p < 0.001; n = 4 (C to L); All data are shown as the mean ± Standard Error of the Mean (SEM). Statistical significance was determined by one-way ANOVA with Fisher’s LSD test.
FIGURE 8
FIGURE 8
Catwalk for gait analysis. (A) Representative 3D footprint intensity images of the left (control) and right hind leg (tendinitis) in the various experimental groups at 4 weeks after treatment. (B) The quantification analysis of catwalk for gait analysis. (C) Mechanical testing of the Achilles tendon. (D) Comparison of the Young’s Modulus, Tensile strength at Break, and Strain at Max. Force of the Achilles tendon in different group. *p < 0.05, **p < 0.01, ***p < 0.001; n = 4; All data are shown as the mean ± Standard Error of the Mean (SEM). Statistical significance was determined by one-way ANOVA with Fisher’s LSD test.
FIGURE 9
FIGURE 9
Evaluation of Biosafety of GF-Exo MN. (A) H&E-stained sections of rat heart, kidney, liver, lung, and spleen from normal, untreat, empty MN, and MN@GF-Exos groups after a 4-week intervention. (Scale bar = 100 µm) (B) Biochemical analysis of serum markers indicating organ function in mice with various interventions. The panels display levels of ALT, AST, TBIL, DBIL, CREA, and UREA. The green-shaded area indicates the established reference range for healthy control mice in this experiment. *p < 0.05; **p < 0.01; ***p < 0.001; n = 4; All data are shown as the mean ± Standard Error of the Mean (SEM). Statistical significance was determined by one-way ANOVA with Fisher’s LSD test.

Similar articles

References

    1. Andres B. M., Murrell G. A. (2008). Treatment of tendinopathy: what works, what does not, and what is on the horizon. Clin. Orthop. Relat. Res. 466 (7), 1539–1554. 10.1007/s11999-008-0260-1 - DOI - PMC - PubMed
    1. Aswani B. S., Hegde M., Vishwa R., Alqahtani M. S., Abbas M., Almubarak H. A., et al. (2024). Tackling exosome and nuclear receptor interaction: an emerging paradigm in the treatment of chronic diseases. Mil. Med. Res. 11 (1), 67. 10.1186/s40779-024-00564-1 - DOI - PMC - PubMed
    1. Birch H. L., Peffers M. J., Clegg P. D. (2016). Influence of ageing on tendon homeostasis. Adv. Exp. Med. Biol. 920, 247–260. 10.1007/978-3-319-33943-6_24 - DOI - PubMed
    1. Cammarano A., Dello Iacono S., Battisti M., De Stefano L., Meglio C., Nicolais L. (2024). A systematic review of microneedles technology in drug delivery through a bibliometric and patent overview. Heliyon 10 (23), e40658. 10.1016/j.heliyon.2024.e40658 - DOI - PMC - PubMed
    1. Chakraborty C., Bhattacharya M., Lee S. S. (2024). Current status of microneedle array technology for therapeutic delivery: from bench to clinic. Mol. Biotechnol. 66 (12), 3415–3437. 10.1007/s12033-023-00961-2 - DOI - PubMed

LinkOut - more resources