

Development and validation of an explainable machine learning model for predicting postoperative pulmonary complications after lung cancer surgery: a machine learning study
- PMID: 40791887
- PMCID: PMC12337024
- DOI: 10.1016/j.eclinm.2025.103386
Development and validation of an explainable machine learning model for predicting postoperative pulmonary complications after lung cancer surgery: a machine learning study
Abstract
Background: Early identification and prediction of postoperative pulmonary complications (PPCs) are vital for patient management in lung cancer (LC) surgery. However, existing predictive models often lack comprehensive validation and interpretability. This study aimed to develop and validate an explainable machine learning (ML) model to predict PPCs in patients with LC undergoing surgery.
Methods: A risk factor variable pool was determined by meta-analysis and Delphi surveys. Patients undergoing LC surgery who were admitted to the Thoracic Surgery Department at the Affiliated Hospital of Zunyi Medical University from 1st January 2022 to 31st October 2023 (retrospective) and from 1st November 2023 to 31st July 2024 (prospective) were used for model development and prospective validation, respectively. The retrospective cohort was randomly split into a training set and an internal validation set at an 8:2 ratio. Feature selection involved univariate analysis, collinearity analysis, nine ML algorithms, and expert consensus. Twelve independent ML models and 26 stacking ensemble models were developed. Predictive performance was evaluated using the area under the receiver-operating-characteristic curve (AUROC), accuracy, sensitivity, specificity, positive predictive value (PPV), negative predictive value (NPV), and F1 score. Prospective validation was analysed using AUC, Hosmer-Lemeshow test, calibration curves, and decision curve analysis (DCA). The Shapley Additive Explanation (SHAP) method was utilised to interpret the predictive model.
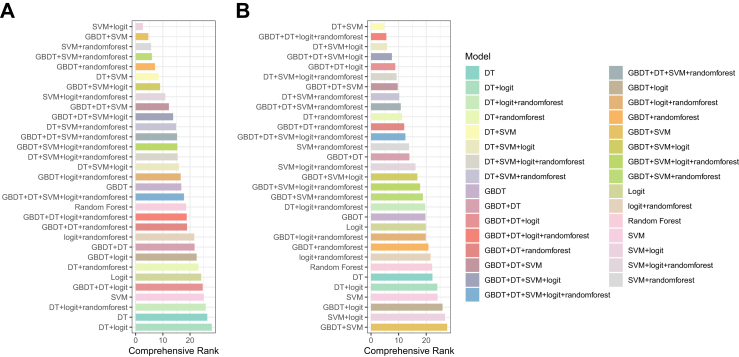
Findings: A total of 883 patients were included in the retrospective cohort with an incidence of PPCs of 35.4% (313/883), and a total of 308 patients were included in the prospective cohort with PPCs of 29.5% (91/308). Nine key characteristics were selected for model development: age, duration of surgery, Charson comorbidity index (CCI), tumour stage, measured carbon monoxide diffusion (DLCO, mmol/min/kPa), intra-operative infusion volume (IFIV, mL), red blood cell volume distribution width-coefficient of variation (RDW-CV, %), body mass index (BMI), and number of years of smoking. Amongst the independent models, the Gradient Boosting Decision Tree (GBDT) showed best performance, achieving an AUROC of 0.829 (95% CI: 0.774-0.885). The stacking ensemble combining Support Vector Machine (SVM) and Decision Tree (DT) showed the highest overall performance, with an AUROC of 0.860 (95% CI: 0.809-0.911), and DCA showed higher clinical utility compared to other models. In the prospective validation, the AUROC was 0.790 (95% CI: 0.744-0.835).
Interpretation: The stacking ensemble model combining SVM and DT demonstrated robust predictive performance and favourable clinical utility for prediction PPCs in patients undergoing LC surgery. However, the model has not been applied in clinical practice and requires future validation in large, multi-centre cohorts. Further work should aim to identify high-risk patients early through clinical data analysis, enabling timely interventions and more efficient allocation of limited healthcare resources.
Funding: The Science and Technology Foundation of Guizhou Provincial Health Commission; the Key Talent Team of Guizhou Provincial Science and Technology Innovation; and Guizhou Science and Technology Cooperation Basic Research Project.
Keywords: Lung cancer; Machine learning; Postoperative pulmonary complications; Stacking ensemble model.
© 2025 The Author(s).
Conflict of interest statement
All authors declare no competing interests.
Figures


References
-
- Bray F., Laversanne M., Sung H., et al. Global cancer statistics 2022: GLOBOCAN estimates of incidence and mortality worldwide for 36 cancers in 185 countries. CA Cancer J Clin. 2024;74(3):229–263. - PubMed
-
- Kidane B., Bott M., Spicer J., et al. The American Association for Thoracic Surgery (AATS) 2023 Expert Consensus Document: staging and multidisciplinary management of patients with early-stage non-small cell lung cancer. J Thorac Cardiovasc Surg. 2023;166(3):637–654. - PubMed
LinkOut - more resources
Full Text Sources
