. 2025 Jul 31:30:476-490.
doi: 10.1016/j.reth.2025.07.004. eCollection 2025 Dec.

Inhibition of the TLR4/RAGE pathway by clearance of extracellular HMGB1 is a potential therapeutic target for radiation-damaged salivary glands

Affiliations

Inhibition of the TLR4/RAGE pathway by clearance of extracellular HMGB1 is a potential therapeutic target for radiation-damaged salivary glands

Takashi I et al. Regen Ther. .

Abstract

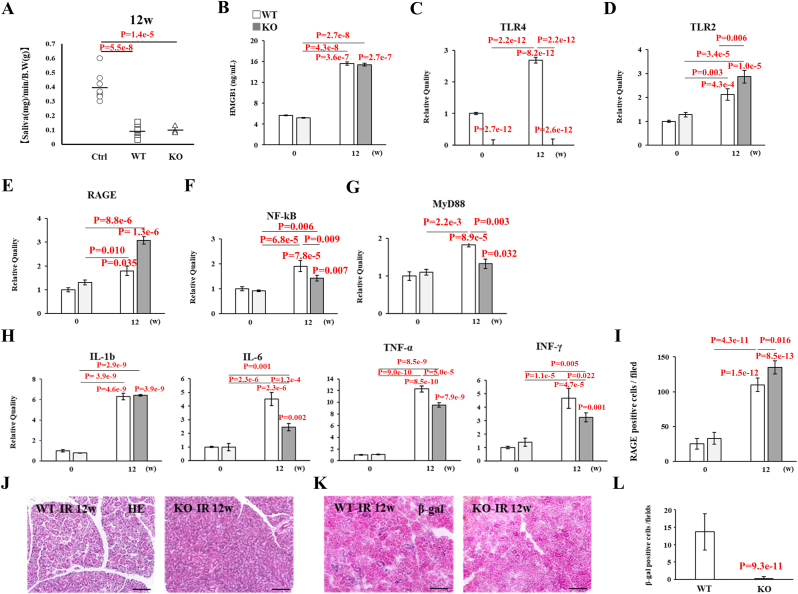
Introduction: We recently developed a new therapy using effective-mononuclear cells (E-MNCs) and demonstrated its efficacy in treating radiation-damaged salivary glands (SGs). The activity of E-MNCs in part involves constituent immunoregulatory -CD11b/macrophage scavenger receptor 1(Msr1)-positive-M2 macrophages, which exert anti-inflammatory and tissue-regenerating effects via phagocytic clearance of extracellular high mobility group box 1 (HMGB1). Focusing on the phenomena, this study investigated significance of regulating the HMGB1/toll-like receptor 4 (TLR4)/receptor for advanced glycation end products (RAGE) signaling pathway in the treatment of SG dysfunction caused by radiation damage.

Methods: E-MNCs were transplanted into radiation-damaged mice SGs, and changes of TLR4/RAGE expression were observed. Furthermore, the activation of downstream signals was investigated in both intact SGs and cultured SG epithelial cells after irradiation. Subsequently, TLR4-knock-out (KO) mice were employed to examine how HMGB1/TLR4/RAGE signaling affected damage progression.

Results: Expression of both TLR4 and RAGE was diminished in ductal cells and macrophages/vascular endothelial cells of damaged SGs with E-MNC transplantation, respectively. Meanwhile, expression of TLR2/4 and RAGE in damaged SGs markedly increased in association with extracellular HMGB1 accumulation. Downstream signals were activated, and intranuclear localization of phospho-nuclear factor-kappa B (p-NF-KB) in ductal cells and production of IL-6, tumor necrosis factor-α (TNF-α), and interferon-γ (IFN-γ) were observed. Additionally, culture supernatant of irradiated cultured SG epithelial cells contained damaged associated molecular pattern (DAMP)/senescence-associated secretory phenotype (SASP) factors. Treatment of cultured SG epithelial cells with this supernatant activated TLR4 signaling pathway and induced cellular senescence. In TLR4-KO mice, onset of radiogenic SG dysfunction was markedly delayed. However, TLR2/RAGE signalings were alternatively activated, and SG function was impaired.

Conclusions: Clearance of DAMPs such as HMGB1 may attenuate sterile inflammation in damaged SGs via suppression of the TLR4/RAGE signaling pathway. This cellular mechanism may have significant implications for the development of future cell-based regenerative therapies.


Conflict of interest statement

Author MS is the CEO of CellAxia Inc. The remaining authors declare that the research was conducted in the absence of any commercial or financial relationships that could be construed as a potential conflict of interest.

Figures

Fig. 1
Fig. 1
Schematic diagram describing 5G-culture and the characteristics of mouse E-MNCs. (A) PB-MNCs were cultured for 5 days in serum-free medium supplemented with five recombinant proteins: TPO, VEGF, SCF, Flt-3 ligand, and IL-6. After cultivation, effective-mononuclear cells (E-MNCs) were obtained. (B) Flow cytometry analysis. Percentages of M1 (CD11b+/CD206) and M2 (CD11b+/CD206+) macrophages among PB-MNCs and E-MNCs, and CCR2/galectin 3+ cells among the CD11b+ population.
Fig. 2
Fig. 2
Analysis of the therapeutic mechanism of E-MNC transplantation in mouse SGs. (A) Diagram of cellular mechanism of E-MNC treatment. M2 macrophages among E-MNCs might contribute to the conversion of damaged tissues from a pro-inflammatory to anti-inflammatory state by mediating HMGB1 clearance. (B) Relative mRNA expression of the TLR4 gene in SGs at 4 weeks post-IR. Data are presented as the mean ± standard deviation. (C) TLR4 expression (red, TLR4; blue, DAPI; scale bar, 100 μm) ( × 200) at 4 weeks post-IR. (D) RAGE expression (red, RAGE; blue, DAPI; scale bar, 100 μm) ( × 200) at 4 weeks post-IR.
Fig. 3
Fig. 3
Post-IR functional and pathologic changes in SGs. (A) Change in salivary flow rate (SFR) at 0, 2, 4, 8, and 12 weeks post-IR. (B) Hematoxylin and eosin staining (scale bar, 100 μm) ( × 200). (C) SA-β-Gal staining of SGs of 20- and 48-week-old mice (IR-20w; 20-week-old mice at 8 weeks post-IR) compared with non-irradiated mice (Ctrl) (scale bar, 100 μm) ( × 200). (D) Masson's trichrome staining (scale bar, 200 μm) ( × 100). Fibrotic areas are stained blue. (E, F) Relative expression of collagen-1 and elastin mRNAs in SGs of mice at 12 weeks post-IR (IR-12w) compared with non-irradiated mice (Ctrl) (∗∗p < 0.01, ∗∗∗p < 0.001). (G, H) Concentration of extracellular HMGB1 in SG tissues and saliva at 0, 2, 4, 8, and 12 weeks post-IR (∗p < 0.05, ∗∗p < 0.01, ∗∗∗p < 0.001). Data are presented as the mean ± standard deviation.
Fig. 4
Fig. 4
Expression of genes related to PRRs for HMGB1. (A–G) Relative expression of HMGB1 receptor mRNAs (TLR2, 3, 4, 7, 8, 9, and RAGE) in SGs from 4 to 12 weeks post-IR compared with non-irradiated mice (∗p < 0.05, ∗∗p < 0.01, ∗∗∗p < 0.001). Data are presented as the mean ± standard deviation.
Fig. 5
Fig. 5
Histological observations of TLR4 and RAGE expression in SGs at 12 weeks post-IR. (A) Expression of TLR4 (red, TLR4; blue, DAPI; scale bar, 100 μm) ( × 200). (B) Expression of TLR4 and AQP5 (red, TLR4; green, AQP5; blue, DAPI; scale bar, 100 μm) (upper, × 200; lower, × 400). (C) Expression of TLR4 and KRT14 (red, TLR4; green, KRT14; blue, DAPI; scale bar, 100 μm) (upper, × 200; lower, × 400). (D) Expression of RAGE (red, RAGE; blue, DAPI; scale bar, 100 μm) (upper, × 200; lower, × 400). (E) Expression of RAGE and CD31 (red, CD31; green, RAGE; blue, DAPI; scale bar, 20 μm) ( × 1000). (F) Expression of RAGE and F4/80 (red, RAGE; green, F4/80; blue, DAPI; scale bar, 20 μm) ( × 1000).
Fig. 6
Fig. 6
Analysis of NF-κB pathway activity in SGs post-IR. (A) Protein expression of p–NF–κB (p65) in SGs of non-irradiated mice (Ctrl) and irradiated mice (IR) at 1 week post-IR. (B, C) p–NF–κB expression at 4 weeks post-IR compared with non-irradiated mice (Ctrl) (red, p–NF–κB; blue, DAPI; scale bar, 100 μm) ( × 200). (D) NF-κB gene expression in SGs from 4 to 12 weeks post-IR compared with non-irradiated mice (∗∗p < 0.01, ∗∗∗p < 0.001). (E) MyD88 gene expression in SGs from 4 to 12 weeks post-IR compared with non-irradiated mice (∗∗p < 0.01, ∗∗∗p < 0.001). (F) Relative expression of TRAM and TRIF mRNAs post-IR compared with non-irradiated mice (∗∗p < 0.01, ∗∗∗p < 0.001). (G) Relative expression of IL-1β, IL-6, TNF-α, and INF-γ mRNAs (∗p < 0.05, ∗∗p < 0.01, ∗∗∗p < 0.001). Data are presented as the mean ± standard deviation.
Fig. 7
Fig. 7
Cultivation of SG epithelial cells and cellular changes in cultured SG cells post-IR. (A) Schematic diagram of the cultivation of SG epithelial cells and phase-contrast imaging (scale bar, 100 μm) ( × 400). (B) Phase-contrast image of cultured SG epithelial cells at 14 days after transfer to coating plate (scale bar, 50 μm) ( × 400). (C) Ep-CAM expression in cultured SG epithelial cells at 14 days after transfer to coating plate (green, Ep-CAM; blue, DAPI; scale bar, 50 μm) ( × 400). (D) Flow cytometry analysis of cultured SG epithelial cells. Percentages of Ep-CAM–positive cells among living cells are shown. (E) Immunocytochemistry analysis of HMGB1 in cultured SG epithelial cells post-IR (red, HMGB1; blue, DAPI; scale bar, 100 μm) ( × 200). (F) Change in concentration of HMGB1 in supernatant of cultured SG epithelial cells post-IR (∗p < 0.05, ∗∗p < 0.01, ∗∗∗p < 0.001). (G) Change in TLR4 expression in Ep-CAM–positive SG epithelial cells cultured in collected supernatant (red, TLR4; green, Ep-CAM; blue, DAPI; scale bar, 100 μm) ( × 400).
Fig. 8
Fig. 8
Pathologic changes in SG epithelial cells cultured in collected supernatant. (A) Phase-contrast image of SG epithelial cells cultured in the supernatant at 7 days (scale bar, 400 μm) ( × 100). (B) SA-β-Gal assay of SG epithelial cells cultured in supernatant; cells were assayed at 3-day intervals post-IR (scale bar, 100 μm) ( × 200). (C) Concentrations of HMGB1, p16ink4a, PRDX6, and TNF-α in supernatants collected at 3-day intervals post-IR (∗p < 0.05, ∗∗p < 0.01, ∗∗∗p < 0.001). (D) Expression of TLR genes in SG epithelial cells cultured in supernatant with/without HMGB1-neutralizing antibody at 7 days (Ctrl, cultured with supernatant [Ctrl]; Supernatant, cultured with supernatant [IR]; Anti, cultured with supernatant [IR] and HMGB1-neutralizing antibody) (∗p < 0.05, ∗∗p < 0.01, ∗∗∗p < 0.001). (E) Expression of NF-κB, MyD88, and inflammation-related cytokine genes in SG epithelial cells cultured in supernatant with/without HMGB1-neutralizing antibody at 7 days (Ctrl, cultured with supernatant [Ctrl]; Supernatant, cultured with supernatant [IR]; Anti, cultured with supernatant [IR] and HMGB1-neutralizing antibody) (∗p < 0.05, ∗∗p < 0.01, ∗∗∗p < 0.001). Data are presented as the mean ± standard deviation. (F) p–NF–κB expression in SG epithelial cells cultured in supernatant (IR) at 1 day (red, p–NF–κB; blue, DAPI; scale bar, 100 μm) ( × 400). (G) Protein expression of TRAM in SG epithelial cells cultured in supernatant (IR) at 7 days.
Fig. 9
Fig. 9
Analysis of functional and pathologic changes in SGs of TLR4-KO mice at 4 and 8 weeks post-IR. (A) Saliva production (salivary flow rate; SFR) in non-irradiated wild-type (WT) mice (Ctrl), irradiated WT mice (WT), and irradiated TLR4-KO mice (KO) (∗∗p < 0.01). (B) Concentration of HMGB1 in SGs (∗∗∗p < 0.001). (C) Relative expression of TLR2 mRNA post-IR compared with non-irradiated WT mice (∗p < 0.05, ∗∗p < 0.01, ∗∗∗p < 0.001). (D) Relative expression of TLR4 mRNA post-IR compared with non-irradiated WT mice (∗∗∗p < 0.001). (E) Relative expression of RAGE mRNA post-IR compared with non-irradiated WT mice (∗p < 0.05, ∗∗p < 0.01, ∗∗∗p < 0.001). (F) Relative expression of NF-κB mRNA post-IR compared with non-irradiated WT mice (∗∗∗p < 0.001). (G) Relative expression of MyD88 mRNA post-IR compared with non-irradiated WT mice (∗p < 0.05). (H) Relative expression of IL-1β, IL-6, TNF-α, and INF-γ mRNAs post-IR compared with non-irradiated WT mice (∗p < 0.05, ∗∗p < 0.01, ∗∗∗p < 0.001). (I) p–NF–κB expression in SG epithelial cells derived from WT or KO mice cultured in supernatant (IR) at 7 days (red, p–NF–κB; blue, DAPI; scale bar, 100 μm) ( × 200). (J) Number of RAGE-positive cells in SGs post-IR compared with non-irradiated WT mice (∗p < 0.05, ∗∗p < 0.01, ∗∗∗p < 0.001). Data are presented as the mean ± standard deviation.
Fig. 10
Fig. 10
Analysis of functional and pathologic changes in SGs of TLR4-KO mice at 12 weeks post-IR. (A) Saliva production (salivary flow rate; SFR) in non-irradiated wild-type (WT) mice (Ctrl), irradiated WT mice (WT), and irradiated TLR4-KO mice (KO) (∗∗p < 0.01). (B) Concentration of HMGB1 in SGs (∗∗∗p < 0.001). (C) Relative expression of TLR4 mRNA post-IR compared with non-irradiated WT mice (∗∗∗p < 0.001). (D) Relative expression of TLR2 mRNA post-IR compared with non-irradiated WT mice (∗∗p < 0.01, ∗∗∗p < 0.001). (E) Relative expression of RAGE mRNA post-IR compared with non-irradiated WT mice (∗∗∗p < 0.001). (F) Relative expression of NF-κB mRNA post-IR compared with non-irradiated WT mice (∗∗p < 0.01, ∗∗∗p < 0.001). (G) Relative expression of MyD88 mRNA post-IR compared with non-irradiated WT mice (∗p < 0.05, ∗∗p < 0.01, ∗∗∗p < 0.001). (H) Relative expression of IL-1β, IL-6, TNF-α, and INF-γ mRNAs post-IR compared with non-irradiated WT mice (∗∗p < 0.01, ∗∗∗p < 0.001). (I) Number of RAGE-positive cells in SGs post-IR compared with non-irradiated WT mice (∗p < 0.05, ∗∗∗p < 0.001). (J) Hematoxylin and eosin staining of SGs of 20-week-old mice (IR 20w; 20-week-old mice at 8 weeks post-IR) (scale bar, 100 μm) ( × 200). (K) SA-β-Gal staining of SGs of 20-week-old mice (IR 20w; 20-week-old mice at 8 weeks post-IR) (scale bar, 100 μm) ( × 200). (L) Number of SA-β-Gal–positive cells in SGs of 20-week-old mice. Data are presented as the mean ± standard deviation.
figs1
figs1

References

    1. Alajbeg I., Falcão D.P., Tran S.D., Martín-Granizo R., Lafaurie G.I., Matranga D., et al. Intraoral electrostimulator for xerostomia relief: a long-term, multicenter, open-label, uncontrolled, clinical trial. Oral Surg Oral Med Oral Pathol Oral Radiol. 2012;113(6):773–781. - PubMed
    1. Baum B.J., Kok M., Tran S.D., Yamano S. The impact of gene therapy on dentistry: a revisiting after six years. J Am Dent Assoc. 2002;133(1):35–44. - PubMed
    1. Baum B.J., Tran S.D. Synergy between genetic and tissue engineering: creating an artificial salivary gland. Periodontol. 2000. 2006;41:218–223. - PubMed
    1. Kagami H. The potential use of cell-based therapies in the treatment of oral diseases. Oral Dis. 2015;21(5):545–549. - PubMed
    1. Patel V.N., Hoffman M.P. Salivary gland development: a template for regeneration. Semin Cell Dev Biol. 2014;25–26:52–60. - PMC - PubMed

LinkOut - more resources