

Transcriptomic insights into grain size development in naked barley (Hordeum vulgare L. var. nudum Hook. f): based on weighted gene co-expression network analysis
- PMID: 40792006
- PMCID: PMC12338054
- DOI: 10.7717/peerj.19856
Transcriptomic insights into grain size development in naked barley (Hordeum vulgare L. var. nudum Hook. f): based on weighted gene co-expression network analysis
Abstract
Background: This study investigated the molecular mechanisms underlying grain size variation between two distinct naked barley varieties using comprehensive phenotypic and transcriptomic (RNA-Seq) analyses.
Methods: In this study, we employed a comparative transcriptomics approach to analyze two naked barley varieties: the large-grained Shenglibai and the small-grained Lalu Qingke. Our investigation focused on three critical developmental periods of grain growth (early, mid, and late grain-filling periods). By integrating longitudinal three-dimensional phenotypic data with temporal expression profiles and applying weighted gene co-expression network analysis (WGCNA), we successfully identified gene modules that co-vary with morphological expansion.
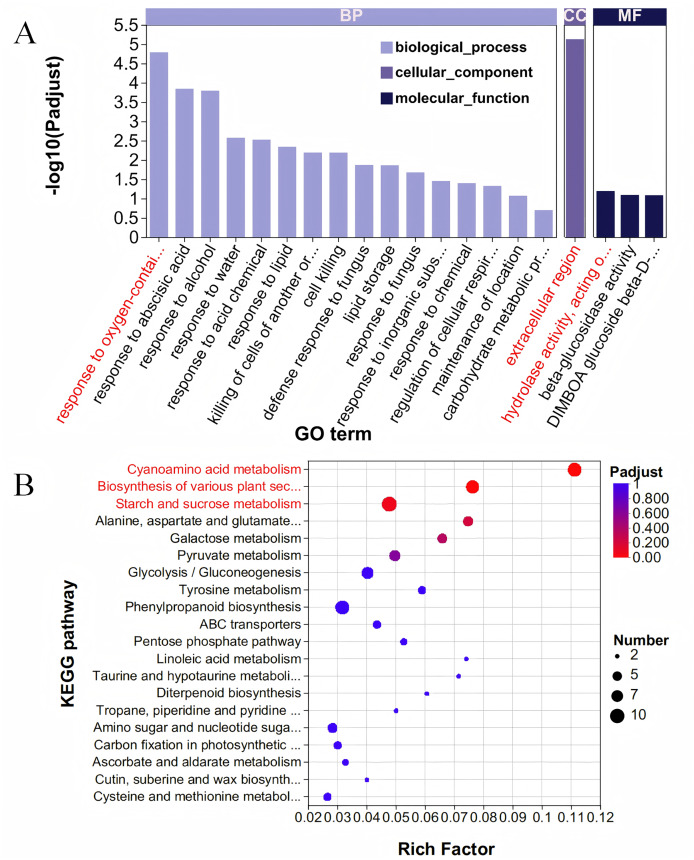
Results: Phenotypic assessments revealed that grains underwent rapid expansion during the filling period, with significant differences in grain width (GW) and thickness (GT) across all three developmental periods. In contrast, grain length (GL) remained relatively consistent by the end of the filling period. Transcriptome sequencing identified a peak in differentially expressed genes (DEGs) during the mid-filling period, indicating that the regulation of grain size development is most active in the early and mid-filling phases. WGCNA identified a blue module strongly correlated with grain size, which was significantly enriched in key metabolic pathways, including starch and sucrose metabolism. Further analysis identified seven hub genes, among which HvENO1 exhibited pronounced upregulation in large-grain varieties during the mid-to-late filling periods, closely aligning with the observed phenotypic traits. Real-time quantitative reverse transcription polymerase chain reaction (qRT-PCR) validation confirmed the period-specific and variety-specific expression patterns of these genes, further supporting the potential of these genes as targets for improving grain size in breeding.
Keywords: Grain size; Qingke; WGCNA; qRT-PCR.
© 2025 Wang et al.
Conflict of interest statement
The authors declare that they have no competing interests.
Figures


Similar articles
-
Mutagenesis of Highland barley (Hordeum vulgare L. Var. nudum) using nitrogen ion beam implantation: screening of phenotypic Var.ations and comparative transcriptome analysis.BMC Genomics. 2025 Jul 21;26(1):681. doi: 10.1186/s12864-025-11856-8. BMC Genomics. 2025. PMID: 40691530 Free PMC article.
-
Transcriptome dynamics and allele-specific regulation underlie wheat heterosis at the anthesis and grain-filling stages.BMC Genomics. 2025 Sep 2;26(1):798. doi: 10.1186/s12864-025-11983-2. BMC Genomics. 2025. PMID: 40898053 Free PMC article.
-
Transcriptomic Dynamics of Rice Varieties with Differential Cold Tolerance Under Low-Temperature Stress During Grain-Filling Stage.Genes (Basel). 2025 Aug 11;16(8):950. doi: 10.3390/genes16080950. Genes (Basel). 2025. PMID: 40869998 Free PMC article.
-
The effect of sample site and collection procedure on identification of SARS-CoV-2 infection.Cochrane Database Syst Rev. 2024 Dec 16;12(12):CD014780. doi: 10.1002/14651858.CD014780. Cochrane Database Syst Rev. 2024. PMID: 39679851 Free PMC article.
-
Audit and feedback: effects on professional practice.Cochrane Database Syst Rev. 2025 Mar 25;3(3):CD000259. doi: 10.1002/14651858.CD000259.pub4. Cochrane Database Syst Rev. 2025. PMID: 40130784
References
-
- Babu RC, Zhang J, Blum A, Ho THD, Wu R, Nguyen HT. HVA1, a LEA gene from barley confers dehydration tolerance in transgenic rice (Oryza sativa L.) via cell membrane protection. Plant Science. 2004;166(4):855–862. doi: 10.1016/j.plantsci.2003.11.023. - DOI
-
- Bull H, Casao MC, Zwirek M, Flavell AJ, Thomas WTB, Guo W, Zhang R, Rapazote-Flores P, Kyriakidis S, Russell J, Druka A, McKim SM, Waugh R. Barley SIX-ROWED SPIKE3 encodes a putative Jumonji C-type H3K9me2/me3 demethylase that represses lateral spikelet fertility. Nature Communications. 2017;8(1):936. doi: 10.1038/s41467-017-00940-7. - DOI - PMC - PubMed
-
- Böttger A, Vothknecht U, Bolle C, Wolf A. Lessons on Caffeine, Cannabis & Co. Learning Materials in Biosciences. Cham: Springer; 2018. Plant secondary metabolites and their general function in plants; pp. 3–17. - DOI
MeSH terms
LinkOut - more resources
Full Text Sources
Miscellaneous
