. 2025 Jul 1;28(8):112853.
doi: 10.1016/j.isci.2025.112853. eCollection 2025 Aug 15.

Ginsenoside 20(S)-Rg3 upregulates SQLE to reprogram cholesterol metabolism of ovarian cancer cells

Affiliations

Ginsenoside 20(S)-Rg3 upregulates SQLE to reprogram cholesterol metabolism of ovarian cancer cells

Fang He et al. iScience. .

Abstract

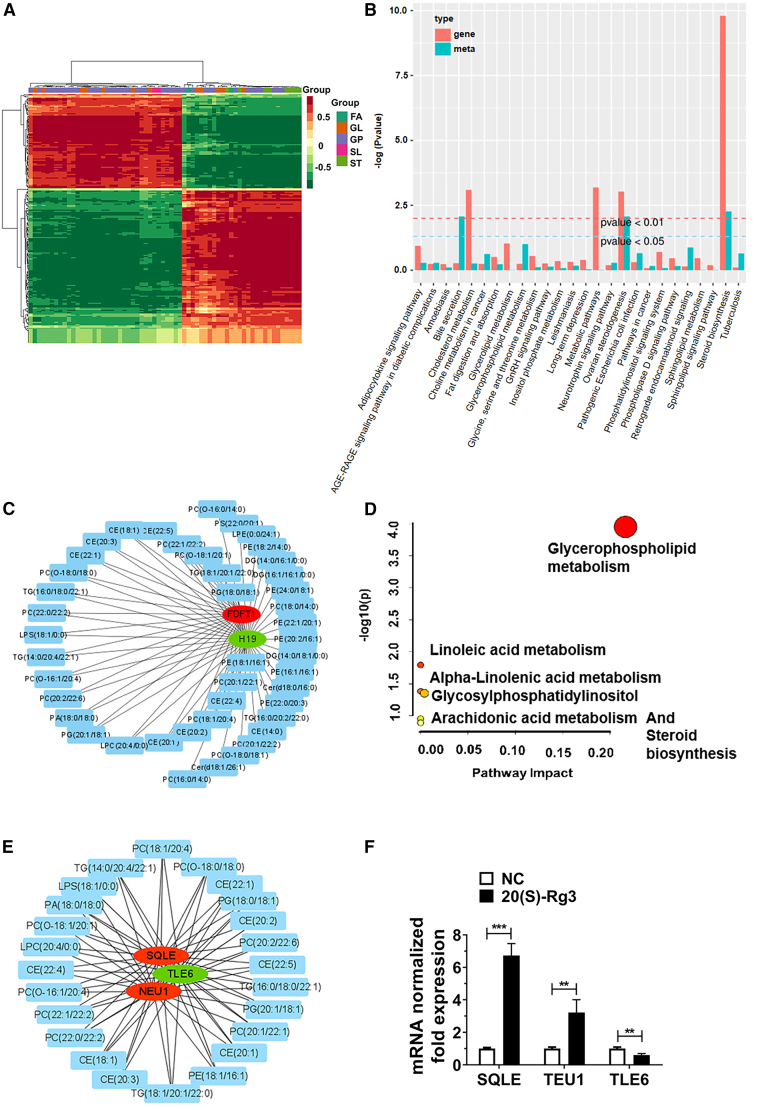
Ginsenoside 20(S)-Rg3 exhibits the anti-ovarian cancer activity by modulating aerobic glycolysis, but its role in reprogramming sterol metabolism remains unclear. This research utilized transcriptomic and lipidomic to identify the key metabolic pathways and targets influenced by 20(S)-Rg3. 20(S)-Rg3 altered 175 mRNAs and 64 metabolites in ovarian cancer cells, and cluster analysis found that the differentially expressed genes and metabolites were highly associated with the steroid biosynthesis. Multi-omics analysis revealed squalene epoxidase (SQLE), a rate-limiting enzyme in steroid biosynthesis, was upregulated by 20(S)-Rg3. Silencing of SQLE attenuated the inhibitory effects of 20(S)-Rg3 on ovarian cancer cell proliferation in vitro and in vivo, as well as cell migration, invasion, and cholesterol synthesis. 20(S)-Rg3 enhanced SQLE expression by downregulating HIF-1α. Co-immunoprecipitation confirmed the interaction between SQLE and farnesyl-diphosphate farnesyltransferase 1 (FDFT1), another rate-limiting enzyme in cholesterol metabolism. These findings suggest that 20(S)-Rg3 exerts anti-ovarian cancer effects by HIF-1α/SQLE/FDFT1 to reprogram cholesterol metabolism.

Keywords: cancer; health sciences; medical biochemistry; natural product chemistry; secondary metabolite sources.


Conflict of interest statement

The authors declare no conflict of interest.

Figures

None
Graphical abstract
Figure 1
Figure 1
20(S)-Rg3 induced the differential expression of 175 genes, mainly enriched in cholesterol biosynthetic, steroid biosynthetic, and sterol biosynthetic pathways (A) Heatmap of the 53 upregulated mRNAs in the 20(S)-Rg3 treatment group (EXP) vs. the control group (NC). (B) GO biological process analysis of the differentially expressed mRNAs. (C) KEGG pathway analysis of the differentially expressed genes.
Figure 2
Figure 2
Differential lipid metabolite changes induced by 20(S)-Rg3 in SKOV3 cells (A) PCA three-dimensional diagram. The PCA analysis revealed distinct clustering characteristics among the three groups: control (NC) represented by green dots, the experimental group (EXP) indicated by red dots, and the quality control group (Mix) depicted in purple. (B) OPLS-DA model validation diagram. The OPLS-DA model provided insights into the classification effectiveness of the groups. The x-axis represents the model accuracy, and the y axis indicates the frequency of model classification outcomes. A threshold of p < 0.05 indicates the optimal model performance. (C) Volcano plot of differential metabolites. The volcano plot illustrates the distribution of metabolites, highlighting 36 metabolites that were significantly upregulated (red circles) and 28 metabolites that were significantly downregulated (green circles). A total of 476 metabolites showed no significant change (gray circles). (D) Clustering heatmap of differential metabolites. The heatmap illustrates the relationships among metabolites, with the following abbreviations for key metabolites: GP (Glycerol Phosphate), GL (Glycerol Lipid), ST (Sterol lipids), FA (Fatty Acids), and SL (Sphingolipids). (E) KEGG pathway analysis of differential metabolites. The KEGG classification diagram annotates the number of differentially regulated metabolites in respective pathways, along with their proportion relative to the annotated total.
Figure 3
Figure 3
SQLE was a 20(S)-Rg3-stimulated gene crucial for lipid metabolic changes in ovarian cancer cells (A) Cluster heatmap of correlation coefficient between differential genes and metabolites. Differential metabolites with correlation coefficients above 0.8 were selected for calculation and analysis. (B) Histogram of differential metabolite and gene enrichment analysis. The enrichment degree of the pathway with both differential metabolites and differential genes was shown, and the higher the ordinate, the higher the enrichment degree. (C) Metabolites associated with H19 or FDFT1 were analyzed using Cytoscape. Ellipse: genes; Round Rectangle: metabolites; Red: upregulated; Green: downregulated. (D) Bubble diagram of significantly differed pathways by MetaboAnalyst. The pathways with large bubbles in the upper right quadrant are typically the core differential pathways. The horizontal axis represents pathway impact and the vertical axis represents -log10. (E) SQLE, TEU1, and TLE6 were closely linked to 24 20(S)-Rg3-related metabolites in the Cytohubba and Metscape analysis. (F) Relative mRNA expression of SQLE, TEU1 and TLE6 genes in 20(S)-Rg3 treated SKOV3 cells versus negative control cells. Significance :∗∗p < 0.01; ∗∗∗p < 0.001.
Figure 4
Figure 4
20 (S)-Rg3 upregulated SQLE in ovarian cancer cells (A) SQLE mRNA level was elevated by 20(S)-Rg3 in SKOV3 and 3AO cells. Statistics were based on three independent experiments. Asterisks indicated statistical significance (∗∗∗p < 0.001). (B) 20(S)-Rg3 increased SQLE protein level in SKOV3 and 3AO cells. (C) Cell immunofluorescence assay showed SQLE was increased in 20(S)-Rg3-treated SKOV3 and 3AO cells relative to negative control cells. Scale was 25 μm.
Figure 5
Figure 5
Knocking down of SQLE mitigated the anti-ovarian cancer activity of 20(S)-Rg3 (A) Knocking down of SQLE reduced SQLE in 20(S)-Rg3-treated cells at mRNA level. Statistical significance :∗p < 0.05. (B) SQLE was decreased at protein level by siRNA transfection in 20(S)-Rg3-treated cells. (C) Knocking down of SQLE reversed the inhibitory effect of 20(S)-Rg3 on cell proliferation as shown by EdU cell proliferation assay. Scale was 25 μm. (D) 20(S)-Rg3 impaired the plate colony formation ability of ovarian cancer cells, which was offset by SQLE siRNA. (E) SQLE interference weakened the inhibitory effect of 20(S)-Rg3 on the in vitro migration and invasion of SKOV3 and 3AO cells. Scale was 50 μm.
Figure 6
Figure 6
20(S)-Rg3 modulated cholesterol metabolism by upregulating SQLE in ovarian cancer cells (A and B) SQLE inhibition reversed the inhibitory effect of 20(S)-Rg3 on intracellular free cholesterol and cholesterol ester. Statistical significance :∗p < 0.05; ∗∗p < 0.01; ∗∗∗p < 0.001. (C) The expression correlation between SQLE and FDFT1 evaluated by GEPIA. (D) 20(S)-Rg3-stimulated FDFT1 mRNA level in SKOV3 and 3AO cells detected by real-time PCR. Statistical significance :∗p < 0.05; ∗∗∗p < 0.001. (E and F) Knockdown of SQLE expression reversed the upregulation of FDFT1 caused by 20(S)-Rg3 at both mRNA and protein levels.Statistical significance :∗∗p < 0.01; ∗∗∗p < 0.001. (G) Knocking down FDFT1 in SKOV3 and 3AO cells did not affect SQLE protein expression induced by 20(S)-Rg3. (H) Immunoprecipitation results showed the interaction between SQLE and FDFT1. IgG served as the negative control. Input as the positive control and anti-FDFT1-IP as the experimental sample. (I) Cellular immunofluorescence assays revealed the co-localization of SQLE and FDFT1. SQLE protein was labeled with red fluorescence, FDFT1 protein was labeled with green fluorescence, and DAPI-stained nucleus was labeled with blue fluorescence. The scale bar is 75 μm.
Figure 7
Figure 7
20(S)-Rg3 downregulated HIF-1α to upregulate SQLE (A) 20(S)-Rg3 reduced HIF-1α protein level in SKOV3 and 3AO cells. (B and C) Overexpression of HIF-1α suppressed 20(S)-Rg3-induced SQLE upregulation at mRNA and protein levels.Statistical significance :∗∗p < 0.01; ∗∗∗p < 0.001. (D–F) Knocking down HIF-1α increased SQLE at both mRNA and protein levels.Statistical significance :∗p < 0.05; ∗∗p < 0.01; ∗∗∗p < 0.001. (G–I) Overexpression of HIF-1α downregulated mRNA and protein levels of SQLE.Statistical significance :∗p < 0.05; ∗∗∗p < 0.001. (J and K) Inhibition of SQLE and FDFT1 did not recover 20(S)-Rg3-reduced HIF-1α protein level.
Figure 8
Figure 8
Knocking down of SQLE by shSQLE-lentivirus promoted tumor growth in ovarian cancer cell line-derived subcutaneous xenograft models (A) The images of SKOV3 cells infected by shSQLE lentivirus and control virus LV3-NC carrying GFP. The scale is 50 μm. (B, C) SQLE was knocked down by shSQLE lentivirus verified by qPCR and Western blot. Statistical significance: ∗∗∗p < 0.001. (D) No changes of mice body weights were observed between shSQLE and LV3-NC groups. (E) The subcutaneous tumor volumes were larger in nude mice of the shSQLE group than in the LV3-NC group. (F) The images of subcutaneous tumors after 23 days of inoculation. G) Images of H&E staining of xenograft tissues. Representative H&E staining of xenograft tissues (n = 3 per group) showed the presence of ovarian cancer cell morphology. The scale is 50 μm. (H) Immunohistochemical (IHC) staining of SQLE in xenograft tissues. According to the H-score system, the expression of SQLE protein was downregulated in the subcutaneous xenograft tumor tissues of shSQLE group nude mice compared with the control group. The scale is 50 μm.
Figure 9
Figure 9
Knocking down of SQLE interfered the therapeutic effects of 20(S)-Rg3 in ovarian cancer xenografts (A) Representative images of subcutaneous tumors (left panel) and corresponding excised masses (right panel) at experimental endpoint (Day 25). BALB/c nude mice (n=5/group) were randomly allocated into three experimental cohorts: control lentivirus (LV3-NC)+PBS administration; LV3-NC+20(S)-Rg3 monotherapy; and shSQLE+20(S)-Rg3 combination. (B) Terminal tumor weights demonstrating 84.5% reduction in 20(S)-Rg3 monotherapy group (0.11 ± 0.06 g) vs. control group (0.71 ± 0.26 g, p < 0.01), with partial recovery (85.9%) in the shSQLE+20(S)-Rg3 group (0.78 ± 0.22 g). Statistical significance: ∗∗p < 0.01. (C) Tumor growth curves validating therapeutic dynamics (20(S)-Rg3 monotherapy group vs. control group: p < 0.01; shSQLE+20(S)-Rg3 group vs. 20(S)-Rg3 monotherapy group: p < 0.01). Statistical significance: ∗∗p < 0.01. (D) Body weight trajectories showed time-dependent weight gain. (E) Histopathological evaluation of xenografts by H&E staining. Scale bar is 100 μm (black). (F) IHC results showed SQLE upregulation by 20(S)-Rg3 was reversed by SQLE knocking down. Scale bar is 100 μm (black). (G) Western blot analyses demonstrated that 20(S)-Rg3-induced SQLE upregulation was abolished by shSQLE knockdown.

Similar articles

References

    1. Chen J., Hong J.H., Huang Y., Liu S., Yin J., Deng P., Sun Y., Yu Z., Zeng X., Xiao R., et al. EZH2 mediated metabolic rewiring promotes tumor growth independently of histone methyltransferase activity in ovarian cancer. Mol. Cancer. 2023;22:85. doi: 10.1186/s12943-023-01786-y. - DOI - PMC - PubMed
    1. Chen Y., Liu L., Xia L., Wu N., Wang Y., Li H., Chen X., Zhang X., Liu Z., Zhu M., et al. TRPM7 silencing modulates glucose metabolic reprogramming to inhibit the growth of ovarian cancer by enhancing AMPK activation to promote HIF-1α degradation. J. Exp. Clin. Cancer Res. 2022;41:44. doi: 10.1186/s13046-022-02252-1. - DOI - PMC - PubMed
    1. Xuan Y., Wang H., Yung M.M., Chen F., Chan W.S., Chan Y.S., Tsui S.K., Ngan H.Y., Chan K.K., Chan D.W. SCD1/FADS2 fatty acid desaturases equipoise lipid metabolic activity and redox-driven ferroptosis in ascites-derived ovarian cancer cells. Theranostics. 2022;12:3534–3552. doi: 10.7150/thno.70194. - DOI - PMC - PubMed
    1. Zhang Y., Wang Y., Zhao G., Orsulic S., Matei D. Metabolic dependencies and targets in ovarian cancer. Pharmacol. Ther. 2023;245 doi: 10.1016/j.pharmthera.2023.108413. - DOI - PubMed
    1. Chen W., Yao P., Vong C.T., Li X., Chen Z., Xiao J., Wang S., Wang Y. Ginseng: A bibliometric analysis of 40-year journey of global clinical trials. J. Adv. Res. 2021;34:187–197. doi: 10.1016/j.jare.2020.07.016. - DOI - PMC - PubMed

LinkOut - more resources