Exploring fecal microbiota signatures associated with immune response and antibiotic impact in NSCLC: insights from metagenomic and machine learning approaches
- PMID: 40792105
- PMCID: PMC12336193
- DOI: 10.3389/fcimb.2025.1591076
Exploring fecal microbiota signatures associated with immune response and antibiotic impact in NSCLC: insights from metagenomic and machine learning approaches
Abstract
Background: Substantial interstudy heterogeneity in cancer immunotherapy-associated biomarkers has hindered their clinical applicability. To address this challenge, we performed a comprehensive integration of publicly available global metagenomic datasets. By leveraging metagenomic profiling and machine learning approaches, this study aimed to elucidate gut microbial signatures associated with immune response in lung cancer (LC) and to evaluate the modulatory effects of antibiotic exposure.
Methods: A systematic literature search was conducted to identify relevant datasets, resulting in the inclusion of 209 fecal metagenomic samples: 154 baseline samples (45 responders, 37 non-responders, and 72 healthy controls) and 55 longitudinal samples collected during immunotherapy. We performed taxonomic and functional characterization of gut microbiota (GM) differentiating responders from non-responders, delineated microbiome dynamics during treatment, and assessed the impact of antibiotics on key microbial taxa. Among eight machine learning algorithms evaluated, the optimal model was selected to construct a predictive framework for immunotherapy response.
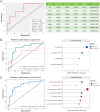
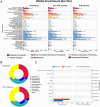
Results: Microbial α-diversity was significantly elevated in responders compared to non-responders, with antibiotic administration further amplifying this difference-most notably at the species level. Integrative multi-omics analysis identified two pivotal microbial biomarkers, s_Bacteroides caccae and s_Prevotella copri, which were strongly associated with immunotherapy efficacy. A random forest-based classifier achieved robust predictive performance, with area under the curve (AUC) values of 0.82 and 0.79 at the species and genus levels, respectively. Notably, P. copri was further enriched in responders with poor progression-free survival (PFS <3 months), indicating a potential deleterious role. Antibiotic exposure significantly influenced the abundance and functional potential of these key taxa. KEGG-based functional analysis revealed the enrichment of amino acid metabolism pathways in responders. Additionally, CARD database annotation demonstrated that the majority of antibiotic resistance genes were associated with Bacteroidetes and Proteobacteria, implicating these taxa in shaping microbial-mediated therapeutic responses.
Conclusions: This study represents the first large-scale, cross-cohort integration of metagenomic data to identify reproducible GM signatures predictive of immune checkpoint inhibitor efficacy in LC. The findings not only underscore the prognostic relevance of specific taxa but also establish a foundation for developing microbiome-informed, personalized immunotherapeutic strategies.
Keywords: antibiotics; gut microbiota; immunotherapy; lung cancer; machine learning; metagenome.
Copyright © 2025 Han, Zhou, Wang, Liu, Sun and Xu.
Conflict of interest statement
Author XL is employed by Liaoning Kanghui Biotechnology Co., Ltd. The remaining authors declare that the research was conducted in the absence of any commercial or financial relationships that could be construed as a potential conflict of interest.
Figures


Similar articles
-
ImmuProgML: machine learning-based dissection of cancer-immune dynamics during tumor progression to improve immunotherapy.J Transl Med. 2025 Jul 25;23(1):826. doi: 10.1186/s12967-025-06872-x. J Transl Med. 2025. PMID: 40713654 Free PMC article.
-
Interconnection of Gut Microbiome and Efficacy of Immune Checkpoint Inhibitors in Inoperable Non-Small-Cell Lung Cancer.Int J Mol Sci. 2025 Aug 11;26(16):7758. doi: 10.3390/ijms26167758. Int J Mol Sci. 2025. PMID: 40869080
-
Altered fecal microbial and metabolic profiles reveal potential mechanisms underlying anemia in patients with chronic renal failure.Microbiol Spectr. 2025 Aug 5;13(8):e0316624. doi: 10.1128/spectrum.03166-24. Epub 2025 Jun 17. Microbiol Spectr. 2025. PMID: 40525868 Free PMC article.
-
Pharmaco-psychiatry and gut microbiome: a systematic review of effects of psychotropic drugs for bipolar disorder.Microbiology (Reading). 2025 Jun;171(6):001568. doi: 10.1099/mic.0.001568. Microbiology (Reading). 2025. PMID: 40528728 Free PMC article. Review.
-
Systemic treatments for metastatic cutaneous melanoma.Cochrane Database Syst Rev. 2018 Feb 6;2(2):CD011123. doi: 10.1002/14651858.CD011123.pub2. Cochrane Database Syst Rev. 2018. PMID: 29405038 Free PMC article.
References
-
- Datar I., Sanmamed M. F., Wang J., Henick B. S., Choi J., Badri T., et al. (2019). Expression analysis and significance of Pd-1, Lag-3, and Tim-3 in human non-small cell lung cancer using spatially resolved and multiparametric single-cell analysis. Clin. Cancer Res. 25, 4663–4673. doi: 10.1158/1078-0432.CCR-18-4142, PMID: - DOI - PMC - PubMed
MeSH terms
Substances
LinkOut - more resources
Full Text Sources
Medical

