

Identification and validation of anoikis-related differentially expressed genes in nasopharyngeal carcinoma
- PMID: 40792128
- PMCID: PMC12335718
- DOI: 10.21037/tcr-2025-1263
Identification and validation of anoikis-related differentially expressed genes in nasopharyngeal carcinoma
Abstract
Background: Anoikis resistance is a critical feature enabling cancer cells to survive during detachment from the extracellular matrix. This study aimed to identify and validate anoikis-related differentially expressed genes (ARDEGs) in nasopharyngeal carcinoma (NPC), providing new insights into the molecular mechanisms underlying NPC progression and potential therapeutic targets.
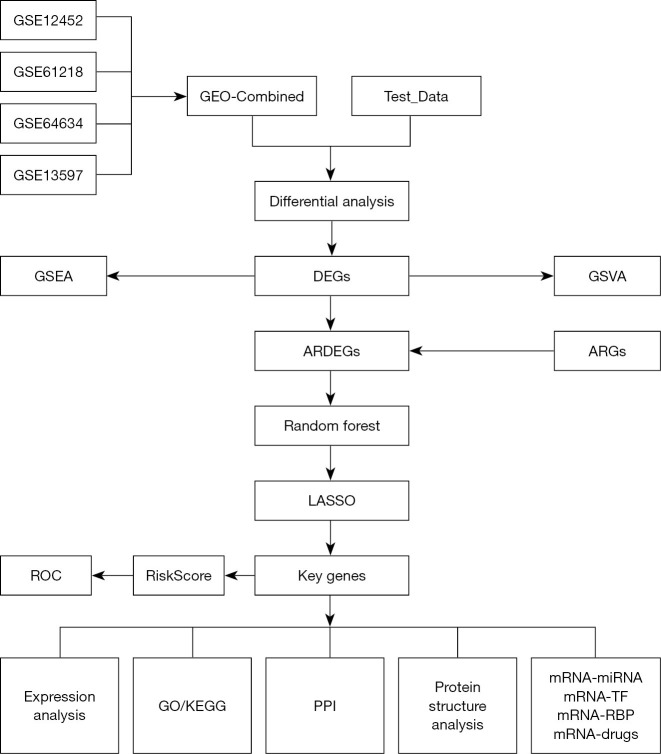
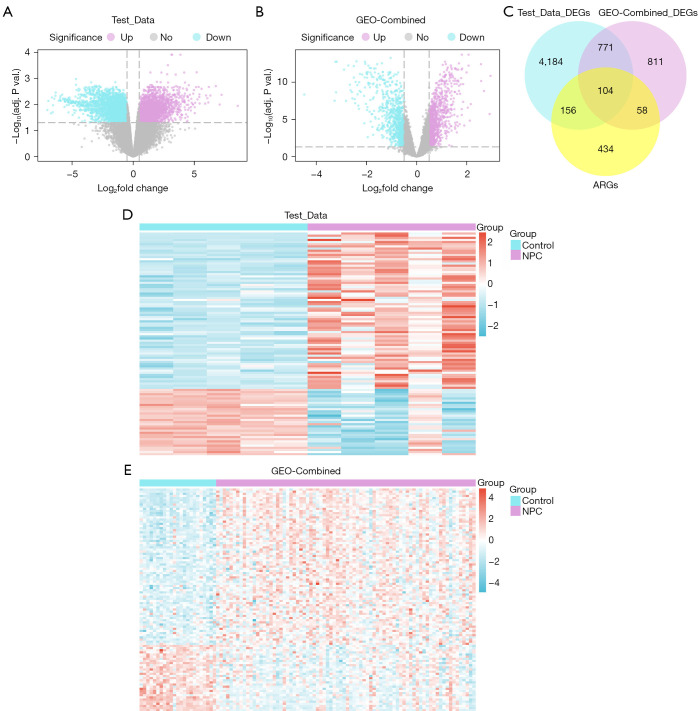
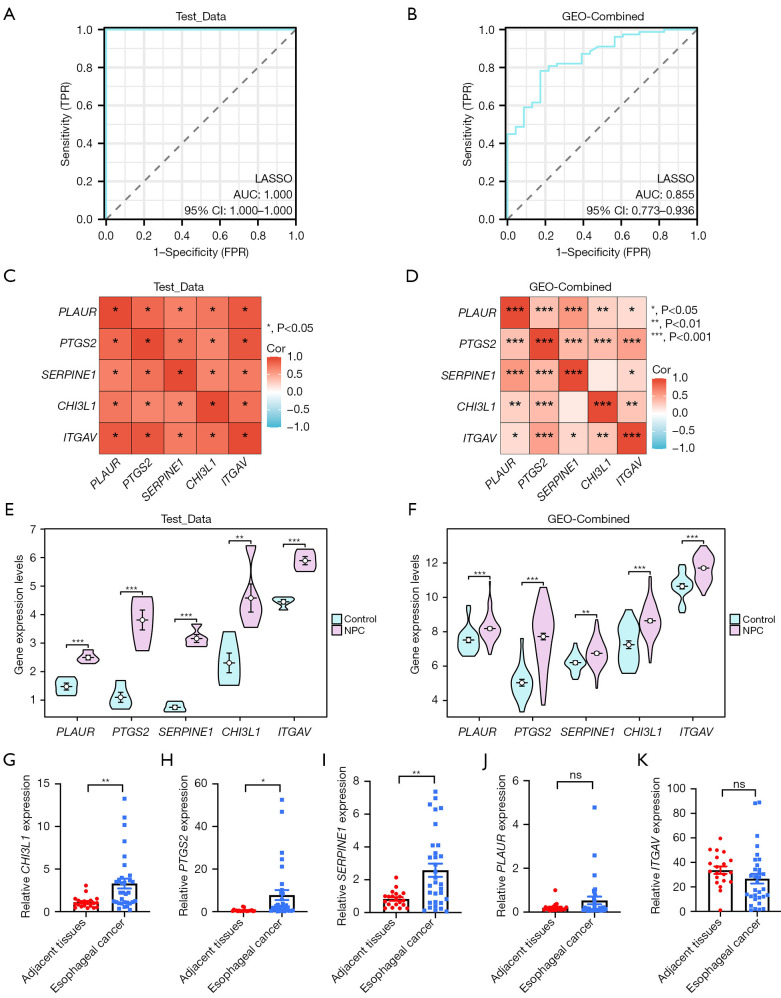
Methods: Four gene expression datasets from the Gene Expression Omnibus (GEO) database were integrated to form the GEO-Combined dataset. NPC and adjacent normal nasopharyngeal tissues comprising the Test_Data were subjected to RNA sequencing. The differentially expressed genes (DEGs) from the GEO-Combined and Test_Data datasets were screened. DEGs associated with anoikis were identified and termed as ARDEGs. The key genes were validated by quantitative real-time polymerase chain reaction (qRT-PCR).
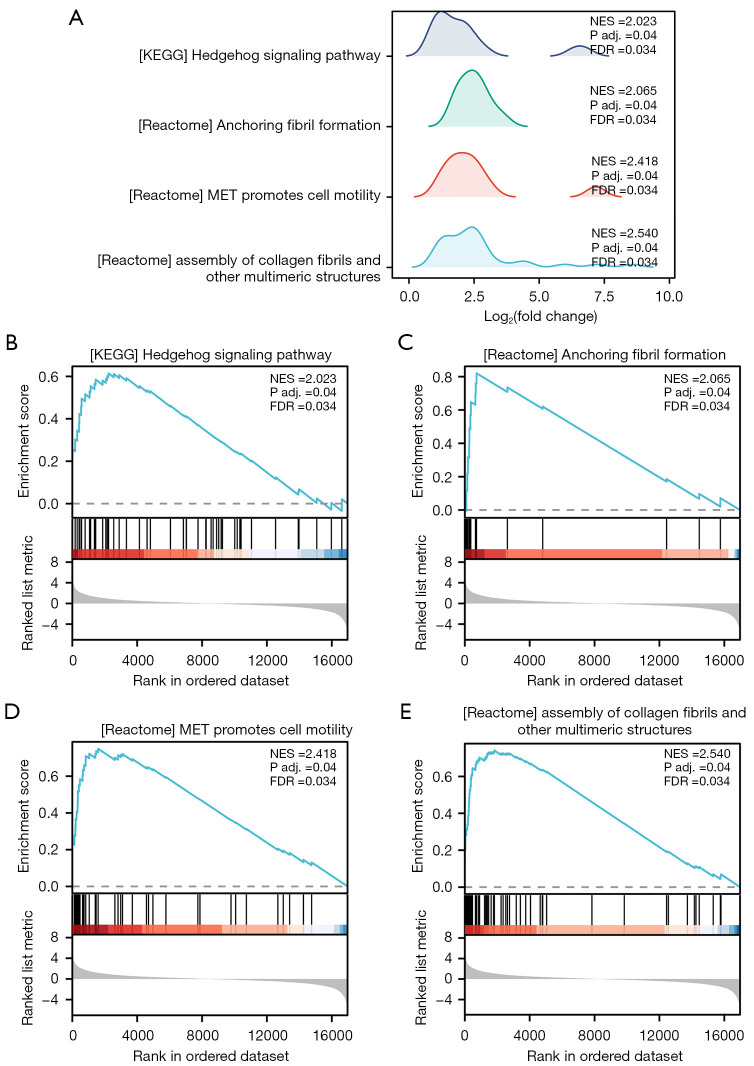
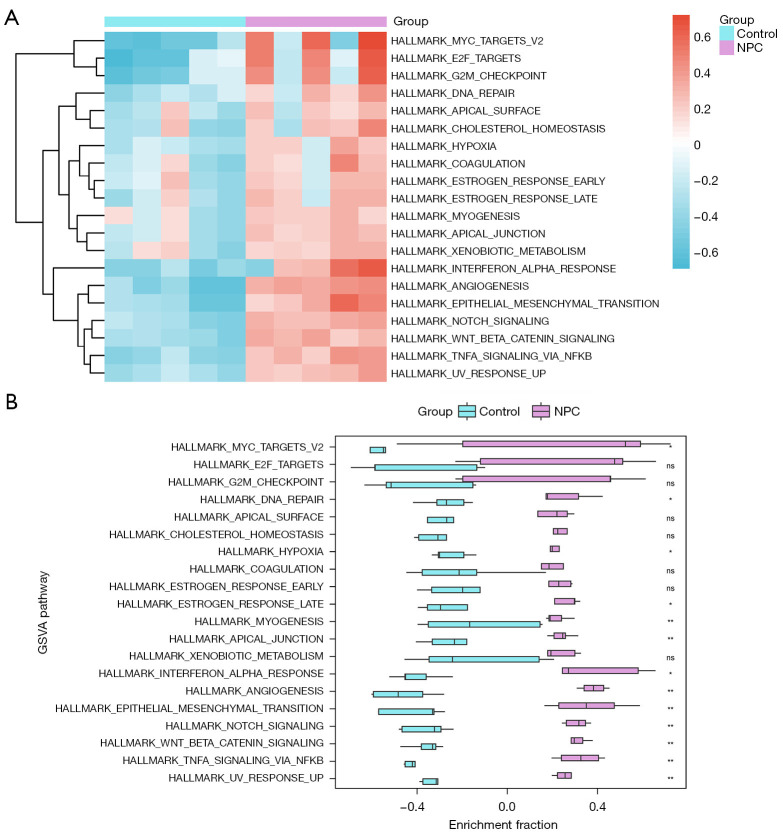
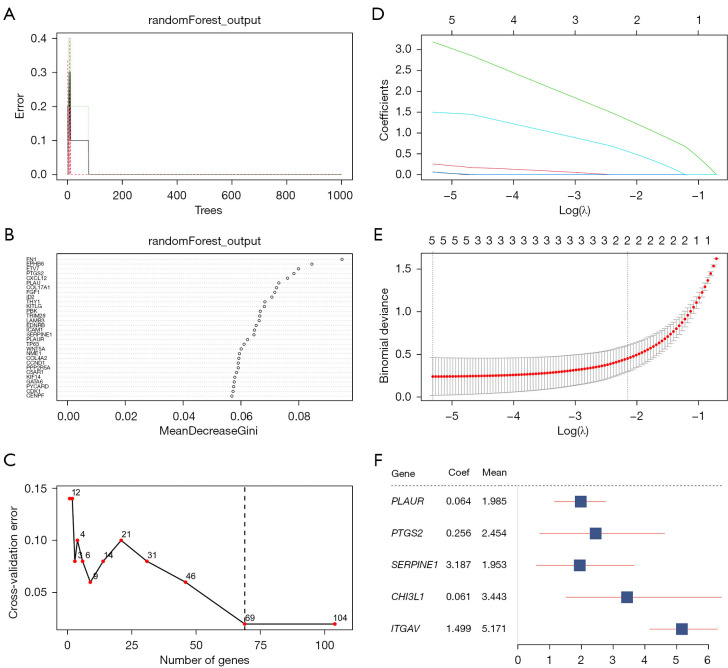
Results: A total of 104 ARDEGs were identified in our study. Five key genes (i.e., PLAUR, PTGS2, SERPINE1, CHI3L1, and ITGAV) were identified using the random forest (RF) and least absolute shrinkage and selection operator (LASSO) algorithms. A nomogram based on these five key genes showed robust diagnostic performance, with the area under the curve (AUC) underscoring its utility as a prognostic tool. Further, the functional enrichment analysis indicated that the risk model was associated with the biological pathways involved in tumor migration and invasion. Based on the model constructed from the five key genes, our study found 152 pairs of messenger RNA (mRNA)-transcription factor (TF) interaction relationships, which may provide insights into the mechanisms of metastasis and recurrence of NPC.
Conclusions: The identification and validation of ARDEGs in NPC highlighted critical molecular players in anoikis resistance, offering potential targets for therapeutic interventions. Our study provides a comprehensive understanding of the role of ARDEGs in NPC, paving the way for further research into targeted therapies for NPC.
Keywords: Nasopharyngeal carcinoma (NPC); anoikis; bioinformatics analysis; prognosis; therapeutic targets.
Copyright © 2025 AME Publishing Company. All rights reserved.
Conflict of interest statement
Conflicts of Interest: All authors have completed the ICMJE uniform disclosure form (available at https://tcr.amegroups.com/article/view/10.21037/tcr-2025-1263/coif). The authors have no conflicts of interest to declare.
Figures
Similar articles
-
Anoikis-related biomarkers PARP1 and SDCBP as diagnostic and therapeutic targets for asthma.Sci Rep. 2025 Jul 9;15(1):24779. doi: 10.1038/s41598-025-09979-9. Sci Rep. 2025. PMID: 40634444 Free PMC article.
-
Identification and verification of a novel anoikis-related gene signature with prognostic significance in clear cell renal cell carcinoma.J Cancer Res Clin Oncol. 2023 Oct;149(13):11661-11678. doi: 10.1007/s00432-023-05012-6. Epub 2023 Jul 5. J Cancer Res Clin Oncol. 2023. PMID: 37402968 Free PMC article.
-
Identification of osteoporosis ferroptosis-related markers and potential therapeutic compounds based on bioinformatics methods and molecular docking technology.BMC Med Genomics. 2024 Apr 22;17(1):99. doi: 10.1186/s12920-024-01872-0. BMC Med Genomics. 2024. PMID: 38650009 Free PMC article.
-
The effect of sample site and collection procedure on identification of SARS-CoV-2 infection.Cochrane Database Syst Rev. 2024 Dec 16;12(12):CD014780. doi: 10.1002/14651858.CD014780. Cochrane Database Syst Rev. 2024. PMID: 39679851 Free PMC article.
-
Gender differences in the context of interventions for improving health literacy in migrants: a qualitative evidence synthesis.Cochrane Database Syst Rev. 2024 Dec 12;12(12):CD013302. doi: 10.1002/14651858.CD013302.pub2. Cochrane Database Syst Rev. 2024. PMID: 39665382
References
LinkOut - more resources
Full Text Sources
Research Materials
Miscellaneous