. 2025 Jul 30;14(7):4160-4178.
doi: 10.21037/tcr-2024-2520. Epub 2025 Jul 25.

Construction and validation of an anoikis-related long non-coding RNA-based prognostic model for head and neck squamous cell carcinoma

Affiliations

Construction and validation of an anoikis-related long non-coding RNA-based prognostic model for head and neck squamous cell carcinoma

Sijie Yuan et al. Transl Cancer Res. .

Abstract

Background: As a unique form of apoptosis, anoikis significantly influences tumor biology. Studies have revealed the diverse roles of long non-coding RNAs (lncRNAs) in cancer signaling pathways; however, the prognostic significance of anoikis-related long non-coding RNAs (ARLncs) in head and neck squamous cell carcinoma (HNSCC) remains unexplored. Therefore, this research was undertaken to establish a risk model and assess its predictive ability for prognosis and immune landscape in individuals with HNSCC.

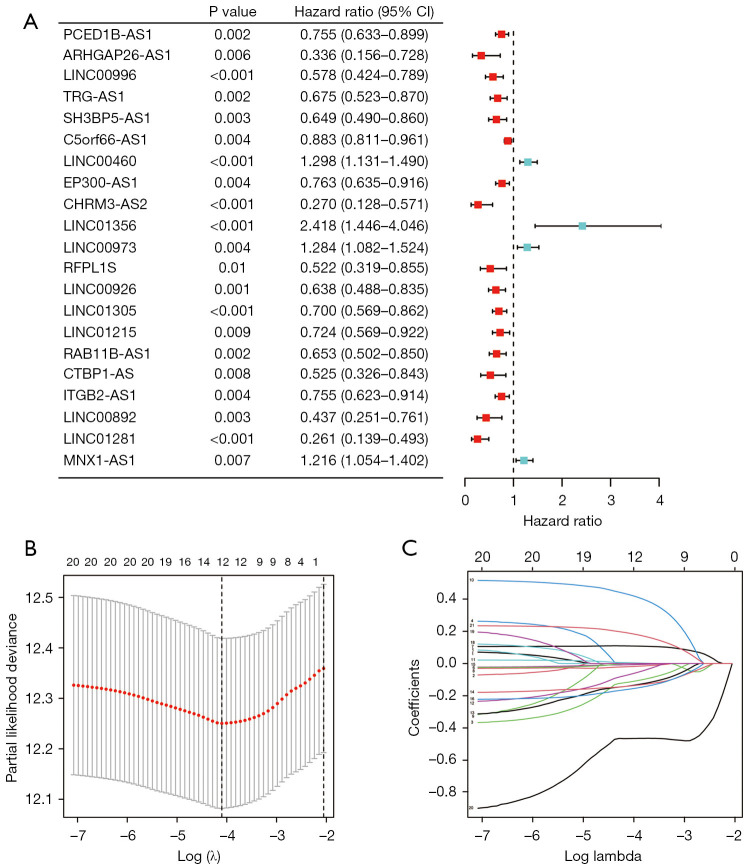
Methods: Data on HNSCC were retrieved from The Cancer Genome Atlas (TCGA). Anoikis-associated genes were acquired from GeneCards, followed by identification of ARLxncs using Pearson correlation analysis. A total of 268 ARLncs from HNSCC samples were extracted from TCGA, and highly relevant ARLncs were identified using Pearson analysis. These ARLncs were subjected to comprehensive bioinformatics analyses, including univariate Cox regression and least absolute shrinkage and selection operator analyses, and an overall survival (OS)-score and OS-signature were generated.

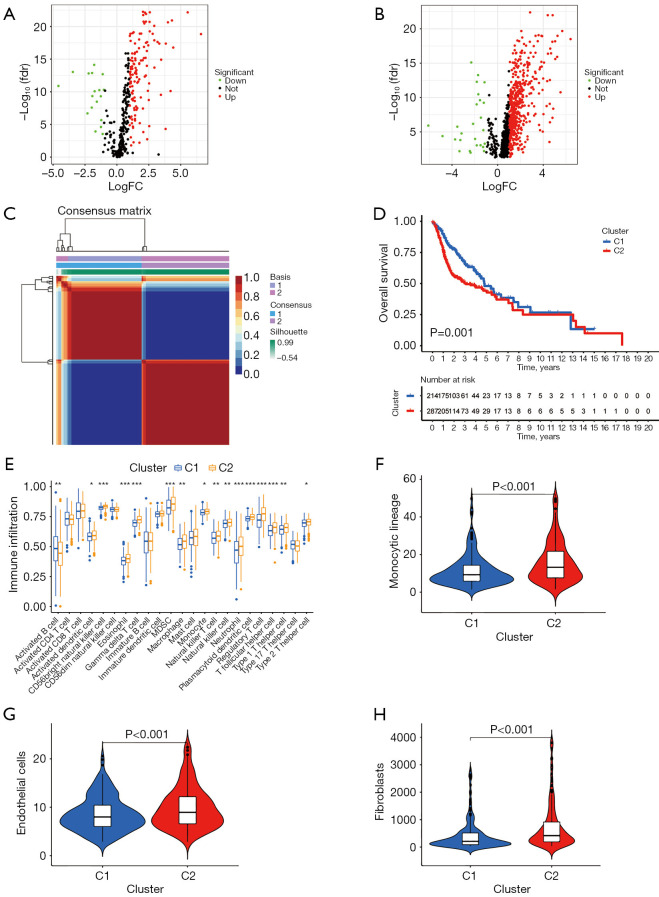
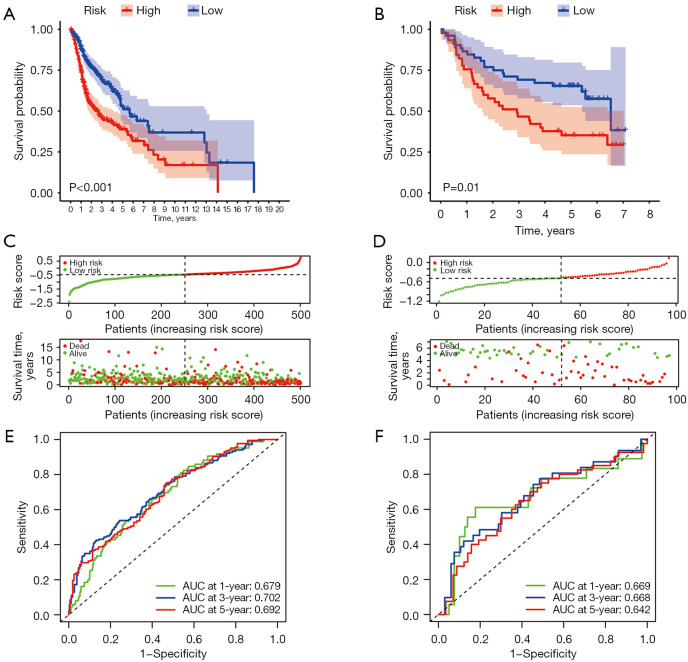
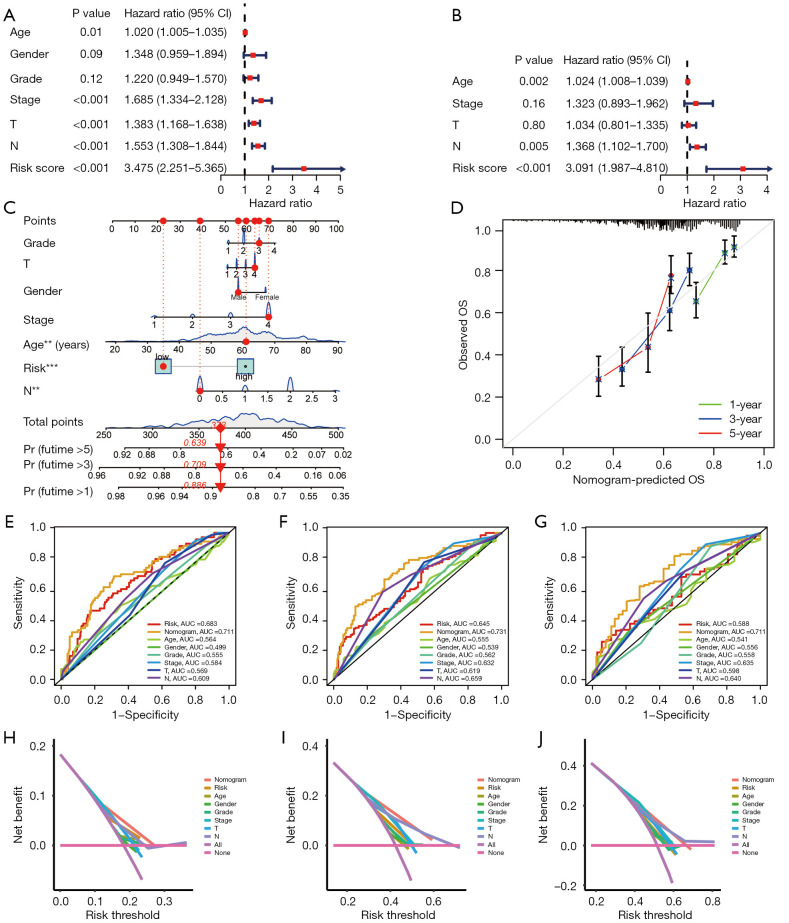
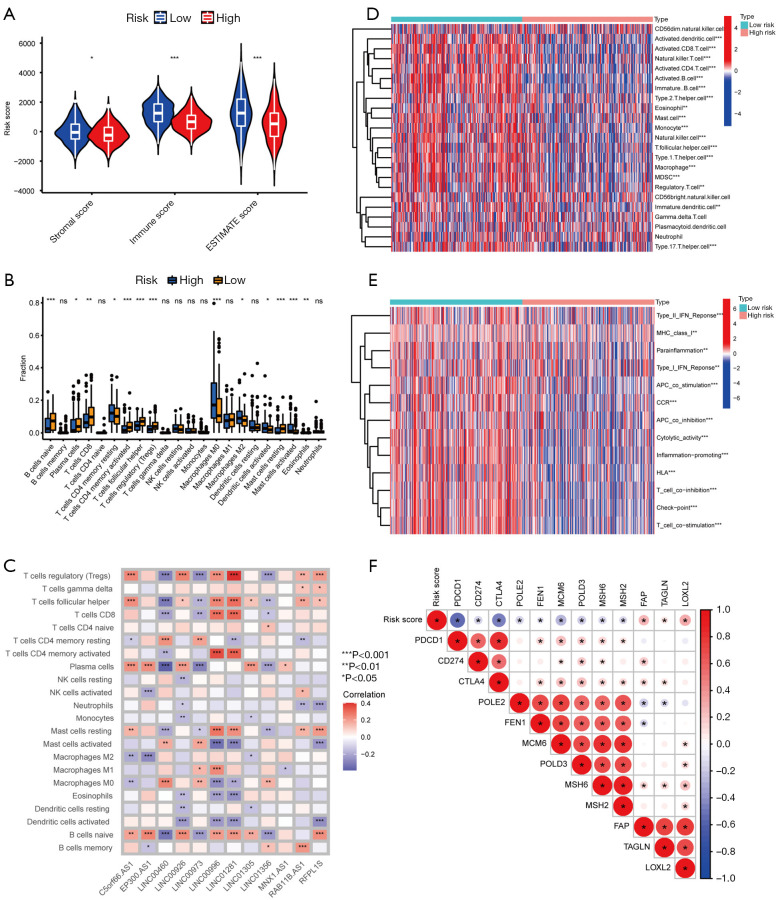
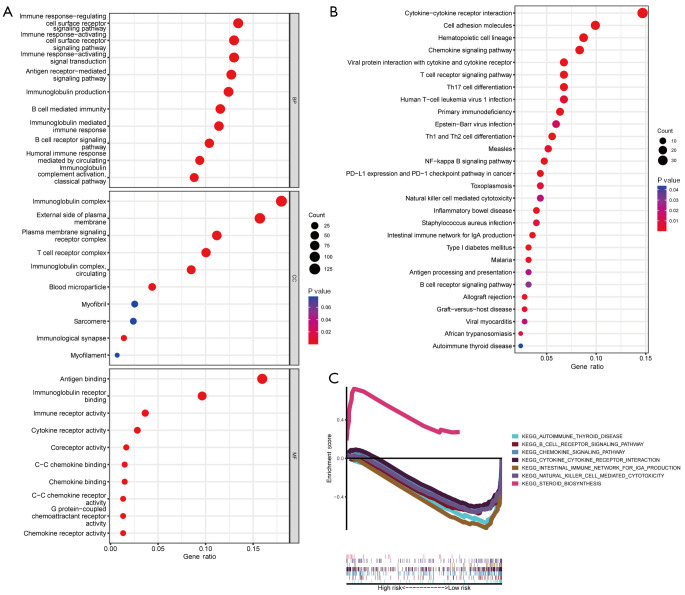
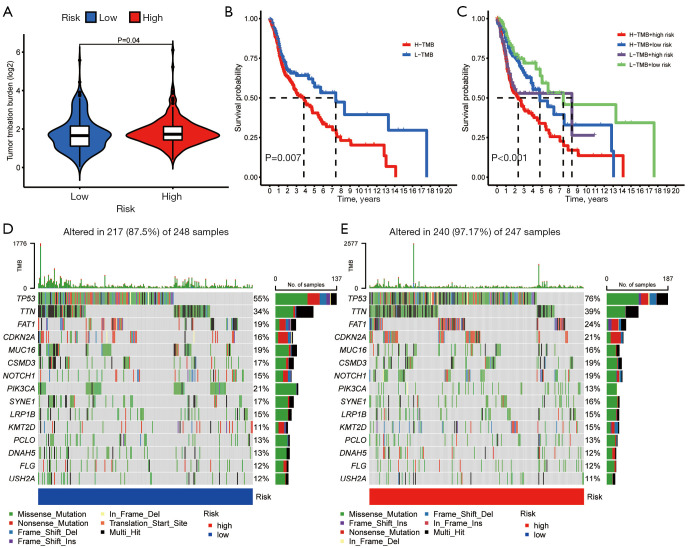
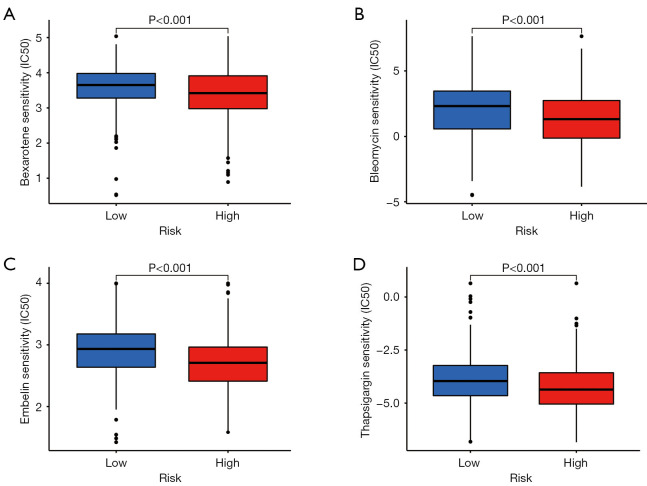
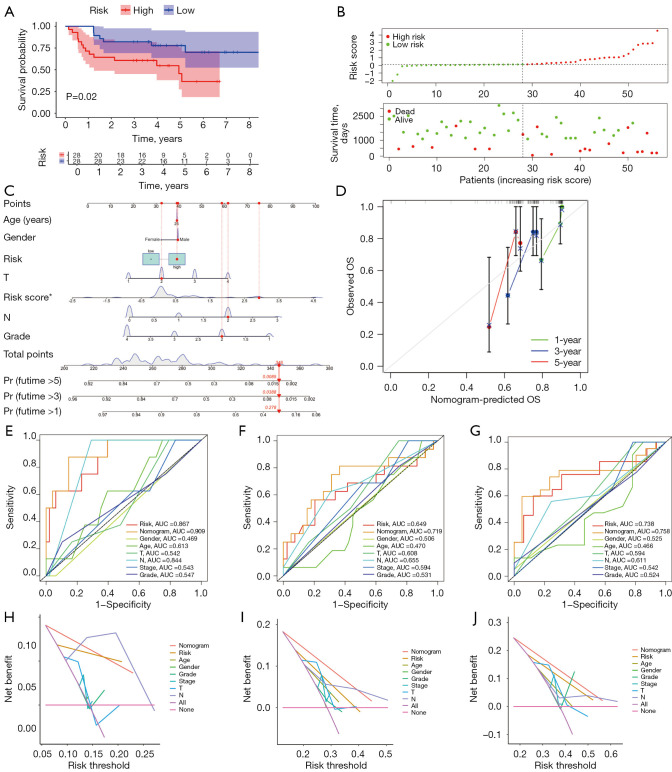
Results: Based on the risk score, patients with HNSCC were stratified into high- and low-risk subgroups to assess the differences in pathway enrichment, prognosis, immune infiltration level, tumor mutation burden, and drug susceptibility. TCGA-HNSCC samples were divided into two subtypes (clusters 1 and 2), with patients in cluster 2 exhibiting worse prognosis and higher levels of tumor-infiltrating lymphocytes (TILs) than patients in cluster 1. Subsequently, we constructed a valid prognostic risk model comprising 12 ARLncs in HNSCC that demonstrated efficacy in predicting prognosis. Patients with high-risk scores exhibited significantly worse OS, lower numbers of TILs, and lower sensitivity to chemotherapy drugs than patients with low-risk scores.

Conclusions: Overall, we successfully established a novel prognostic model based on ARLncs, which holds significant promise for predicting prognosis and personalized therapy for patients with HNSCC.

Keywords: Anoikis; head and neck squamous cell carcinoma (HNSCC); long non-coding RNA (lncRNA); overall survival (OS); prognosis.


Conflict of interest statement

Conflicts of Interest: All authors have completed the ICMJE uniform disclosure form (available at https://tcr.amegroups.com/article/view/10.21037/tcr-2024-2520/coif). The authors have no conflicts of interest to declare.

Figures

Figure 1
Figure 1
Identification and clustering analysis of DEGs in head and neck squamous cell carcinoma. (A) Visualization of the final DEGs through a volcano plot. (B) Differential expression of anoikis-related long non-coding RNAs. (C) Molecular subgroup clustering. (D) Kaplan-Meier survival curve illustrating the differences in overall survival between identified subtypes. (E) Boxplots depicting immune cell profiles in two distinct subtypes. *, P<0.05; **, P<0.01; ***, P<0.001. (F-H) Comparative infiltration of monocyte lineage cells, endothelial cells, and fibroblasts between two clusters. DEGs, differentially expressed genes; FC, fold change; FDR, false discovery rate; MDSC, myeloid-derived suppressor cell.
Figure 2
Figure 2
Construction of an anoikis‐related lncRNA risk signature for patients with head and neck squamous cell carcinoma. (A) Forest plot showing univariate Cox regression analysis results. (B,C) Least absolute shrinkage and selection operator regression analysis conducted to identify 12 anoikis-related lncRNA-associated risk signatures. CI, confidence interval; lncRNA, long non-coding RNA.
Figure 3
Figure 3
Validation of the risk model across independent cohorts. (A) Kaplan-Meier survival curves for the training set. (B) Kaplan-Meier survival curves for the validation set. (C) Survival status and risk score distribution in the training set (high- vs. low-risk groups). (D) Survival status and risk score distribution in the validation set (high- vs. low-risk groups). (E) Time-dependent receiver operating characteristic curves at 1-, 3-, and 5-year in the training set. (F) Time-dependent receiver operating characteristic curves at 1-, 3-, and 5-year in the validation set. AUC, area under the curve.
Figure 4
Figure 4
Construction and verification of a risk model nomogram. (A,B) Forest plot for univariate and multivariate Cox regression analyses. (C) Nomogram model for predicting the 1-, 3-, and 5-year OS of patients with head and neck squamous cell carcinoma. **, P<0.01; ***, P<0.001. (D) Calibration curves of the nomogram model. (E-G) Receiver operating characteristic curves for clinical survival in 1, 3, and 5 years. (H-J) Decision curve analysis indicates the good reliability of this prediction in 1, 3, and 5 years. AUC, area under the curve; CI, confidence interval; N, node; OS, overall survival; T, tumor.
Figure 5
Figure 5
Immune landscape of different risk groups. (A) ESTIMATE, stromal, and immune scores in the two risk groups. (B) Differences between tumor-infiltrating immune cells. (C) Correlation heatmap of the ratio of tumor-infiltrating immune cells. (D,E) Immune-related function was significantly activated in the low-risk group. (F) Higher levels of immune checkpoints were present in the low-risk group. ns, not significant; *, P<0.05; **, P<0.01; ***, P<0.001. APC, antigen-presenting cell; CCR, chemokine receptor; ESTIMATE, Estimation of Stromal and Immune cells in MAlignant Tumor tissues using Expression data; HLA, human leukocyte antigen; IFN, interferon; MDSC, myeloid-derived suppressor cell; MHC, major histocompatibility complex; NK, natural killer.
Figure 6
Figure 6
GO terms and pathway enrichment analysis in the high- and low-risk groups. (A) GO and (B) KEGG pathway enrichment analyses based on differentially expressed genes. (C) Gene set enrichment analysis shows the different pathways significantly enriched in the high- and low-risk groups. BP, biological process; CC, cellular component; GO, Gene Ontology; KEGG, Kyoto Encyclopedia of Genes and Genomes; MF, molecular function; NF, nuclear factor; PD-1, programmed cell death protein 1; PD-L1, programmed death-ligand 1.
Figure 7
Figure 7
Effect of TMB on head and neck squamous cell carcinoma. (A) TMB violin diagram for different risk groups. (B) Kaplan-Meier curves of overall survival stratified based on TMB. (C) Kaplan-Meier curves of different TMB groups. (D,E) Waterfall plots of mutant gene information in different risk groups. H, high; L, low; TMB, tumor mutational burden.
Figure 8
Figure 8
Differential sensitivity to chemotherapy drugs in the high- and low-risk groups. The IC50 values of (A) bexarotene, (B) bleomycin, (C) embelin, and (D) thapsigargin were higher in the low-risk group than in the high-risk group. IC50, half-maximal inhibitory concentration.
Figure 9
Figure 9
Verification of the predictive model using clinical data. (A) Kaplan-Meier curves of HNSCC patients. (B) Survival status and risk scores of HNSCC patients in the high- and low-risk groups. (C) Nomogram model for predicting the 1-, 3-, and 5-year overall survival of HNSCC patients. *, P<0.05. (D) Calibration curves of the nomogram model. (E-G) The receiver operating characteristic curves for clinical survival in 1, 3, and 5 years, respectively. (H-J) Decision curve analysis shows the good reliability of this prediction. AUC, area under the curve; HNSCC, head and neck squamous cell carcinoma; N, node; OS, overall survival; T, tumor.

Similar articles

References

    1. Barsouk A, Aluru JS, Rawla P, et al. Epidemiology, Risk Factors, and Prevention of Head and Neck Squamous Cell Carcinoma. Med Sci (Basel) 2023;11:42. 10.3390/medsci11020042 - DOI - PMC - PubMed
    1. Johnson DE, Burtness B, Leemans CR, et al. Head and neck squamous cell carcinoma. Nat Rev Dis Primers 2020;6:92. 10.1038/s41572-020-00224-3 - DOI - PMC - PubMed
    1. Bray F, Ferlay J, Soerjomataram I, et al. Global cancer statistics 2018: GLOBOCAN estimates of incidence and mortality worldwide for 36 cancers in 185 countries. CA Cancer J Clin 2018;68:394-424. 10.3322/caac.21492 - DOI - PubMed
    1. Ferris RL, Blumenschein G, Jr, Fayette J, et al. Nivolumab for Recurrent Squamous-Cell Carcinoma of the Head and Neck. N Engl J Med 2016;375:1856-67. 10.1056/NEJMoa1602252 - DOI - PMC - PubMed
    1. Bhat GR, Hyole RG, Li J. Head and neck cancer: Current challenges and future perspectives. Adv Cancer Res 2021;152:67-102. 10.1016/bs.acr.2021.05.002 - DOI - PubMed

LinkOut - more resources