. 2025 Jul 30;14(7):3943-3960.
doi: 10.21037/tcr-2025-277. Epub 2025 Jul 24.

Identification and validation of hub genes for kidney renal clear cell carcinoma treated with metformin and everolimus combination therapy

Affiliations

Identification and validation of hub genes for kidney renal clear cell carcinoma treated with metformin and everolimus combination therapy

Shenbao He et al. Transl Cancer Res. .

Abstract

Background: Renal cell carcinoma (RCC) is a prevalent malignancy of the urinary system that presents significant health and economic burdens. Despite existing treatments such as surgery and targeted therapies, challenges remain due to suboptimal efficacy and high recurrence rates. Previous studies have indicated that metformin and everolimus individually exhibit inhibitory effects on RCC. However, their synergistic potential when combined has not been fully elucidated. Therefore, this paper identified the antiproliferative effect and the hub genes that undergo significant changes in 786-O cells when treated with the combination drugs and their underlying mechanisms to inform the search for kidney renal clear cell carcinoma (KIRC) therapeutic targets.

Methods: The effects of the combination of metformin and everolimus on 786-O cells viability, migration and invasion were investigated. Differentially expressed genes (DEGs) among different drug treatment groups were identified through ribonucleic acid (RNA) sequencing, raw data processing and differential expression analysis. The target genes were obtained by taking the intersection of different DEGs, and hub genes were identified by Maximal Clique Centrality (MCC) and Molecular Complex Detection (MCODE) algorithms, expression validation, and Kaplan-Meier (K-M) survival curve plotting. Subsequently, transcription factors (TFs) regulating the hub genes were identified and drug-hub gene interactions were explored through molecular docking. In addition, gene set enrichment analysis (GSEA) demonstrated hub gene-related biological functions and pathways, and gene set variation analysis (GSVA) explored differential pathways between different drug treatment groups. Finally, quantitative real-time polymerase chain reaction (qRT-PCR) was performed to verify the expression difference of hub genes among four groups.

Results: The combination of metformin and everolimus is more effective than monotherapy at inhibiting cell viability, migration, and invasion in 786-O cells. In total, 3,030 DEG1, 2,953 DEG2, 3,591 DEG3, 1,571 DEG4 and 4,064 DEG5 were identified, yielding five target genes. After MCC and MCODE algorithms, expression validation, and K-M survival curve plotting, target genes were all noted as hub genes (SPC25, NCAPH, MCM10, UHRF1, SMC4). Eleven TFs regulated more than two hub genes, and the binding energy of metformin with SPC25 and everolimus with SMC4 was the lowest. Hub genes were negatively correlated with lysosome and positively associated with cell cycle, and the P13K/Akt/mTOR signaling pathway was significantly positively correlated with hub genes.

Conclusions: Metformin and everolimus are synergistic in anticancer effects on RCC. Based on transcriptomic data, this study obtained five hub genes associated with everolimus and metformin combination therapy in KIRC to inform KIRC-related research.

Keywords: Kidney renal clear cell carcinoma (KIRC); bioinformatics; everolimus; metformin; molecular docking.


Conflict of interest statement

Conflicts of Interest: All authors have completed the ICMJE uniform disclosure form (available at https://tcr.amegroups.com/article/view/10.21037/tcr-2025-277/coif). The authors have no conflicts of interest to declare.

Figures

Figure 1
Figure 1
Effects of metformin and everolimus on the biological behaviors of 786-O cells. (A) CCK-8 assay results. (B,C) Wound-healing assays graph and corresponding bar graph. (D,E) The Transwell’s transfection graph and the corresponding bar graph (crystal violet staining, scale bar =100 µm). Data were presented as mean ± SD. *, P<0.05; **, P<0.01; ***, P<0.001; ****, P<0.0001. CCK-8, Cell Counting Kit-8; Eve, everolimus; Met, metformin; SD, standard deviation.
Figure 2
Figure 2
Screening of differentially expressed genes and their functional enrichment. (A) Volcano map and heatmap of differentially expressed genes. Each point in the graph represents a gene. Red represents up-regulated differentially expressed genes, and blue represents down-regulated differentially expressed genes. (B) GO enrichment analysis of differentially expressed gene. (C) Bubble map of the DEG KEGG (A: 786-O cell samples; B: 786-O cell samples + 10 mM metformin). DEG, differentially expressed gene; FC, fold change; mRNA, messenger RNA; ncRNA, non-coding RNA; GO, Gene Ontology; KEGG, Kyoto Encyclopedia of Genes and Genomes; rRNA, ribosomal RNA.
Figure 3
Figure 3
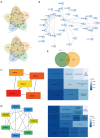
Identification of candidate genes. (A) Get intersecting genes. The upper panel shows the intersection up gene; the lower panel shows the intersection down gene. (B) Candidate gene PPI network. (C) Top five gene network and enrichment results in the MCC algorithm. (D) PPI network and enrichment results for MCODE screened genes. (E) PPI intersection genes for MCODE and MCC methods. DEG, differentially expressed gene; MCC, Maximal Clique Centrality; MCODE, Molecular Complex Detection; PPI, protein-protein interaction.
Figure 4
Figure 4
Identification of candidate genes. (A) Expression analysis of candidate genes in TCGA. Group A: 786-O cell samples; group B: 786-O cell samples + 10 mM metformin; group C: 786-O cell samples + 25 µM everolimus; group D: 786-O cell samples + 10 mM metformin + 25 µM everolimus. (B) Survival analysis of the hub gene. ****, P<0.0001. TCGA, The Cancer Genome Atlas.
Figure 5
Figure 5
Network construction and molecular docking of hub genes. (A) Construction of the TF-hub gene relationship network. (B) 2D structure of the drug and the hub gene docked to the active ingredient molecule. On the left is metformin and on the right is everolimus. The left side is the global view, and the right side is the local view. 2D, two-dimensional; TF, transcription factors.
Figure 6
Figure 6
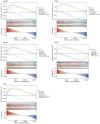
Hub gene enrichment analysis. Horizontal coordinates were genes sorted by correlation coefficients, the top part of the vertical coordinates are enrichment scores, the second part has no practical significance, and different colors represent different pathways.
Figure 7
Figure 7
Hub gene enrichment analysis. (A) GSVA enrichment analysis. Enrichment scores of different pathways in different samples between different groups. Darker colors represent higher enrichment (group A: 786-O cell samples; group B: 786-O cell samples + 10 mM metformin; group C: 786-O cell samples + 25 µM everolimus; group D: 786-O cell samples + 10 mM metformin + 25 µM everolimus). (B) Correlation of hub genes with enrichment scores of different pathways. Blue represented a negative correlation, and red represented a positive correlation. The deeper the color, the stronger the correlation. DEG, differentially expressed gene; GSVA, gene set variation analysis.
Figure 8
Figure 8
Expression results of five hub genes. (A) MCM10; (B) NCAPH; (C) SMC4; (D) SPC25; (E) UHRF1. Data are shown as mean ± SD. *, P<0.05; **, P<0.01; ***, P<0.001; ****, P<0.0001. Eve, everolimus; Met, metformin; ns, no significant difference; SD, standard deviation.

References

    1. Siegel RL, Giaquinto AN, Jemal A. Cancer statistics, 2024. CA Cancer J Clin 2024;74:12-49. 10.3322/caac.21820 - DOI - PubMed
    1. Rose TL, Kim WY. Renal Cell Carcinoma: A Review. JAMA 2024;332:1001-10. 10.1001/jama.2024.12848 - DOI - PMC - PubMed
    1. Bukavina L, Bensalah K, Bray F, et al. Epidemiology of Renal Cell Carcinoma: 2022 Update. Eur Urol 2022;82:529-42. 10.1016/j.eururo.2022.08.019 - DOI - PubMed
    1. Ivanyi P, Fröhlich T, Grünwald V, et al. The Treatment of Metastatic Renal Cell Carcinoma. Dtsch Arztebl Int 2024;121:576-86. 10.3238/arztebl.m2024.0147 - DOI - PMC - PubMed
    1. Barata PC, Rini BI. Treatment of renal cell carcinoma: Current status and future directions. CA Cancer J Clin 2017;67:507-24. 10.3322/caac.21411 - DOI - PubMed

LinkOut - more resources