. 2025 Jul 30;14(7):4115-4141.
doi: 10.21037/tcr-24-1925. Epub 2025 Jul 27.

Development of a quantitative genomic instability scoring system and a related competing endogenous RNA network in head and neck squamous cell carcinoma

Affiliations

Development of a quantitative genomic instability scoring system and a related competing endogenous RNA network in head and neck squamous cell carcinoma

Wei Li et al. Transl Cancer Res. .

Abstract

Background: Genomic instability (GI) is a hallmark of cancer and plays a crucial role in the progression of head and neck squamous cell carcinoma (HNSCC). This study aimed to quantitatively characterize GI features and construct a GI-related competing endogenous RNA (ceRNA) network in HNSCC.

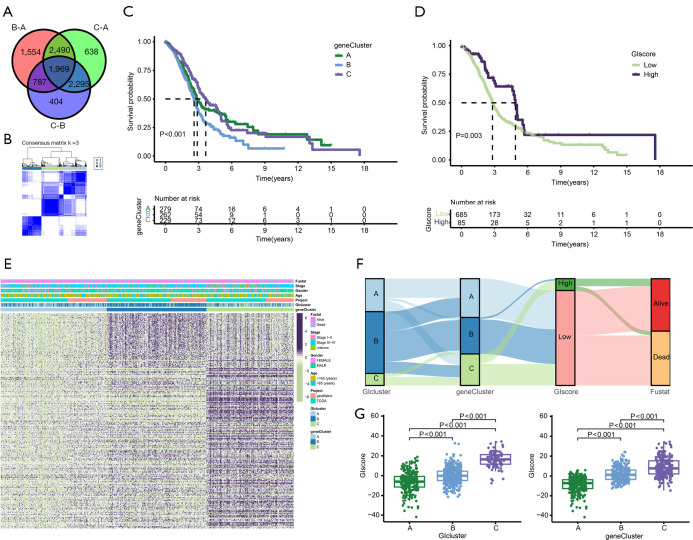
Methods: Weighted gene co-expression network analysis (WGCNA) and differential gene expression analysis were conducted to compare genomically stable and unstable HNSCC samples. Thirty-six hub GI-related genes (GIGs) were identified and used to categorize patients into distinct clusters through consensus clustering analysis. A GI scoring (GIS) system was then developed to assess its relationship with somatic mutations, tumor mutational burden (TMB), and differential gene expression, including genes such as KRAS and TP53. In vitro experiments were performed to explore the functional mechanism of the GI-associated ceRNA axis-RNF216P1/let-7b-5p/DUSP9. The expression levels of RNF216P1, let-7b-5p, and DUSP9 were also validated using clinical samples from a local hospital.

Results: The identified 36 GIGs enabled the categorization of HNSCC patients into three distinct clusters, each exhibiting unique prognostic and immune profiles. The developed GIS system effectively distinguished between somatic mutations, TMB, and differential gene expression. Patients with higher GIS scores had better prognoses compared to those with lower scores. Additionally, GIS was positively correlated with overall immune cell infiltration and immune function, highlighting its potential in predicting responses to immunotherapy. The GI-associated ceRNA axis RNF216P1/let-7b-5p/DUSP9 was established, with The Cancer Genome Atlas (TCGA) analysis revealing upregulation of RNF216P1 and DUSP9 in tumor tissues, while let-7b-5p was downregulated. These expression trends were corroborated in clinical samples. In vitro experiments demonstrated that RNF216P1 functioned as a molecular sponge for let-7b-5p, leading to upregulation of DUSP9 and promoting oncogenesis in HNSCC.

Conclusions: The GIS system is an effective biomarker for evaluating GI, prognosis, and immune features in HNSCC. The findings also clarify the functional mechanism of the GI-related ceRNA axis RNF216P1/let-7b-5p/DUSP9, providing valuable insights for future research and the development of therapeutic strategies for HNSCC.

Keywords: Genomic instability (GI); competing endogenous RNA (ceRNA); head and neck squamous cell carcinoma (HNSCC); immunity.


Conflict of interest statement

Conflicts of Interest: All authors have completed the ICMJE uniform disclosure form (available at https://tcr.amegroups.com/article/view/10.21037/tcr-24-1925/coif). The authors have no conflicts of interest to declare.

Figures

Figure 1
Figure 1
HNSCC data gathering and analysis flowchart. CeRNA, competing endogenous RNA; GIGs, genomic instability-related genes; GIS, genomic instability scoring; HNSCC, head and neck squamous cell carcinoma; MCC, maximal clique centrality; PCA, principal component analysis; qPCR, quantitative polymerase chain reaction; TCGA, The Cancer Genome Atlas; TMB, tumor mutational burden; WB, western blot; WGCNA, weighted gene co-expression network analysis.
Figure 2
Figure 2
Identification of GIGs. (A) Selection of the optimal power for the WGCNA, illustrated by the scale-free fit index (Y-axis) as a function of the soft-thresholding power (X-axis). (B) Dendrogram of all detected genes clustered based on a dissimilarity measure, where each color below represents a gene module. (C) Heatmap displaying the correlation between module eigengenes and clinical traits (tumor vs. normal), with each cell containing the corresponding correlation and P value. (D) Visualization of GS for HNSCC in the brown module, indicating the module’s relevance to the disease. (E) Heatmap representing DEGs between GS and GU samples, highlighting gene expression patterns. (F) Venn diagram illustrating the intersection of genes from the brown module and DEGs between GS and GU, identifying key overlapping genes. (G-I) Functional enrichment analyses including GO (G), KEGG (H), and DO (I), providing insights into the biological processes, pathways, and diseases associated with the 36 identified GIGs. BP, biological process; CC, cellular component; DEGs, differentially expressed genes; DO, Disease Ontology; GIGs, genomic instability-related genes; GO, Gene Ontology; GS, genomic stable; GU, genomic unstable; HNSCC, head and neck squamous cell carcinoma; KEGG, Kyoto Encyclopedia of Genes and Genomes; MF, molecular function; TCGA, The Cancer Genome Atlas; WGCNA, weighted gene co-expression network analysis.
Figure 3
Figure 3
Genetic variations in 36 GIGs. (A) Frequency of CNVs of the 36 GIGs in the TCGA cohort. (B) Mutation frequency of the 36 GIGs in the TCGA cohort. (C) Chromosomal distribution of CNV alterations in the 36 GIGs. (D) Comparative expression analysis of the 36 GIGs between normal and tumor tissues. ns, not significant (P>0.05); *, P<0.05; **, P<0.01; ***, P<0.001. CNVs, copy number variations; GIGs, genomic instability-related genes; TCGA, The Cancer Genome Atlas; TMB, tumor mutational burden.
Figure 4
Figure 4
Prognostic and immune characteristics of the constructed three GI clusters. (A) The consensus matrix depicting the stability and agreement of patient classification into the three GI clusters. (B) Kaplan-Meier survival curves of the three GI clusters in the TCGA and GSE65858 cohorts, illustrating differences in patient survival among the clusters. (C) Heatmap of the activation status of biological behaviors among the three GI clusters, showing the activity of various biological processes and pathways. (D-F) Differences in immune-related features among the three GI clusters: immune-related functional activation (D), immune cell infiltration abundances (E), and expression of immune checkpoint genes (F), demonstrating the distinct immune landscapes of each cluster. ns, not significant (P>0.05); **, P<0.01; ***, P<0.001. GI, genomic instability; KEGG, Kyoto Encyclopedia of Genes and Genomes; TCGA, The Cancer Genome Atlas.
Figure 5
Figure 5
Construction and characterization of the GIS system in HNSCC. (A) Intersection analysis revealing 1,969 overlapping DEGs among GI clusters A vs. B, A vs. C, and B vs. C. (B) The consensus matrix illustrating the stability and agreement in patient classification into three gene clusters. (C,D) Kaplan-Meier survival curves for the three gene clusters (C) and high vs. low GIS groups (D) in the TCGA and GSE65858 cohorts. (E-G) Comprehensive visual representations of the relationship between GIS, GI clusters, and gene clusters: gene expression and clinical feature heatmaps (E), Sankey diagram analysis (F), and patterns of GIS differential expression across GI and gene clusters (G), elucidating the intricate genomic interplay and its impact on patient stratification. DEGs, differentially expressed genes; GI, genomic instability; GIS, genomic instability scoring; HNSCC, head and neck squamous cell carcinoma; TCGA, The Cancer Genome Atlas.
Figure 6
Figure 6
Characterization and pathway insights of the GIS system in HNSCC. (A,B) Comparative analysis uncovering significant variances in somatic mutation count, TMB (A), as well as expression levels of critical genes including ARID1A, UBQLN4, KRAS, TP53, PIK3CA, and EGFR (B), distinctly contrasting between the high and low GIS groups. (C) Heatmap of biological function differences between high and low GIS groups based on GSVA-KEGG pathway analysis. (D) Visualization of pathway activation disparities between high and low GIS groups, determined through ssGSEA. ns, not significant (P>0.05); *, P<0.05; **, P<0.01; ***, P<0.001. GEO, Gene Expression Omnibus; GIS, genomic instability scoring; GSVA, gene set variation analysis; HNSCC, head and neck squamous cell carcinoma; KEGG, Kyoto Encyclopedia of Genes and Genomes; ssGSEA, single-sample gene set enrichment analysis; TCGA, The Cancer Genome Atlas; TMB, tumor mutational burden.
Figure 7
Figure 7
Immune landscape analysis and correlation of GIS with immune features in HNSCC. (A) Bar graph illustrating the correlation of GIS with immune cell infiltration abundance based on the CIBERSORTx algorithm. (B) Heatmap representation of the association between GIS and immune functions, as well as immune cell infiltration abundance, determined by the ssGSEA algorithm. (C) Violin plot depicting the differences in TME scores between high and low GIS groups. (D) Bar graph showing the disparities in various indicators from the TIDE algorithm between high and low GIS groups. ns, not significant (P>0.05); *, P<0.05; **, P<0.01; ***, P<0.001. CAF, cancer-associated fibroblast; GIS, genomic instability scoring; HNSCC, head and neck squamous cell carcinoma; IFNG, interferon gamma; MDSC, myeloid-derived suppressor cell; MSI Expr Sig, microsatellite instability expression signature; ssGSEA, single-sample gene set enrichment analysis; TAM, tumor-associated macrophage; TIDE, tumor immune dysfunction and exclusion; TME, tumor microenvironment.
Figure 8
Figure 8
Single-cell RNA sequencing analysis of immune cells in HNSCC and normal tissues. (A) UMAP visualization of sample origin. (B) UMAP visualization of cell types in the samples. (C) Dot plot showing the expression of various immune markers across different immune cell types. (D) Dot plot highlighting immune markers in tumor and normal-derived immune cell populations. (E) Dot plot displaying AUC score differences in 10 immune cell types between different samples. (F) Differences in receptor-ligand communication among 11 immune cell types across different samples. AUC, area under the curve; HNSCC, head and neck squamous cell carcinoma; NK, natural killer; pDC, plasmacytoid dendritic cell; UMAP, Uniform Manifold Approximation and Projection.
Figure 9
Figure 9
Constructing the GI-related ceRNA network in HNSCC. (A) Application of the MCC algorithm to identify the top 10 node genes among 36 GIGs. (B) Univariate Cox regression analysis of the 36 GIGs identifying potential prognostic factors in HNSCC. (C) Kaplan-Meier survival curves comparing high vs. low DUSP9 expression groups. (D) Pancancer expression analysis of DUSP9, red indicates tumor tissues and blue indicates normal tissues. (E) Utilization of the starBase platform for the identification and correlation analysis of upstream regulatory miRNAs of DUSP9. (F) Correlation analysis between let-7b-5p and DUSP9 expressions and its differential expression between tumor and normal tissues. (G) Elucidation of the ceRNA network. (H) Analysis of the correlation between RNF216P1 with let-7b-5p and DUSP9, and its differential expression between tumor and normal tissues. (I) Kaplan-Meier survival curves for high vs. low RNF216P1 expression groups. **, P<0.01; ***, P<0.001. CeRNA, competing endogenous RNA; CI, confidence interval; GI, genomic instability; GIGs, genomic instability-related genes; HNSCC, head and neck squamous cell carcinoma; MCC, maximal clique centrality; miRNA, microRNA; TPM, transcripts per kilobase million.
Figure 10
Figure 10
Potential mechanism of the RNF216P1/let-7b-5p/DUSP9 axis in HNSCC. (A,B) Scatter plots showing the correlation between RNF216P1, hsa-let-7b-5p, and DUSP9 expression levels with RNAss (A) and DNAss (B) expression. (C) Heatmap depicting the pairwise correlation coefficients of RNA methylation-related genes in the RNF216P1/let-7b-5p/DUSP9 axis. (D-F) Scatter plots showing the correlation between RNF216P1 (D), let-7b-5p (E), and DUSP9 (F) expression and the efficacy of various drugs. HNSCC, head and neck squamous cell carcinoma.
Figure 11
Figure 11
Expression analysis and molecular interactions within the GI-related ceRNA axis in HNSCC. (A) The mRNA expression of RNF216P1, let-7b-5p, and protein expression of DUSP9 between tumor tissues and adjacent non-tumor tissues from 10 clinical samples. (B,C) Luciferase reporter assays in HNSCC cells transfected with WT or MUT constructs of RNF216P1 (B) and DUSP9 (C) along with let-7b-5p mimic-NC or mimic. (D,E) qPCR analysis post-transfection illustrating the differential expression of RNF216P1, let-7b-5p mRNA, and DUSP9 protein. (F) Cell viability analysis using CCK-8 assay across different groups and time points. (G) Flow cytometry analysis depicting apoptosis rates in different groups. (H) Clonogenic assay results depicting the colony-forming abilities across groups (0.1% crystal violet). (I) Transwell assay outcomes indicating variations in cellular invasiveness among groups (cells were fixed with methanol and stained with 0.1% crystal violet; scale bar, 50 µm). **, P<0.01. CA, clonogenic assay; CCK-8, cell counting kit-8; ceRNA, competing endogenous RNA; FITC, fluorescein isothiocyanate; GI, genomic instability; HNSCC, head and neck squamous cell carcinoma; mRNA, messenger RNA; MUT, mutant; NC, negative control; PA, peritumoral adjacent; PI, propidium iodide; qPCR, quantitative polymerase chain reaction; sh, short hairpin; WT, wild type.
Figure 12
Figure 12
Mechanistic insights into the GI-related ceRNA axis impacting cellular processes in HNSCC. (A,B) Impact of let-7b-5p mimic transfection on DUSP9 protein levels (A) and let-7b-5p mRNA levels (B). (C) Flow cytometry analysis depicting apoptosis rates across different experimental groups. (D) CCK-8 assays illustrating cellular viability across groups at various time points. (E) Clonogenic assays assessing the colony-forming abilities of HNSCC cells in different groups (0.1% crystal violet). (F) Transwell assays evaluating the invasiveness of HNSCC cells in various transfection conditions (0.1% crystal violet; scale bar, 50 µm). **, P<0.01. CCK-8, cell counting kit-8; ceRNA, competing endogenous RNA; FITC, fluorescein isothiocyanate; GI, genomic instability; HNSCC, head and neck squamous cell carcinoma; mRNA, messenger RNA; NC, negative control; PI, propidium iodide.

References

    1. Sung H, Ferlay J, Siegel RL, et al. Global Cancer Statistics 2020: GLOBOCAN Estimates of Incidence and Mortality Worldwide for 36 Cancers in 185 Countries. CA Cancer J Clin 2021;71:209-49. 10.3322/caac.21660 - DOI - PubMed
    1. Bray F, Ferlay J, Soerjomataram I, et al. Global cancer statistics 2018: GLOBOCAN estimates of incidence and mortality worldwide for 36 cancers in 185 countries. CA Cancer J Clin 2018;68:394-424. 10.3322/caac.21492 - DOI - PubMed
    1. Denaro N, Russi EG, Merlano MC. Pros and Cons of the New Edition of TNM Classification of Head and Neck Squamous Cell Carcinoma. Oncology 2018;95:202-10. 10.1159/000490415 - DOI - PubMed
    1. Kase S, Baburin A, Kuddu M, et al. Incidence and Survival for Head and Neck Cancers in Estonia, 1996-2016: A Population-Based Study. Clin Epidemiol 2021;13:149-59. 10.2147/CLEP.S293929 - DOI - PMC - PubMed
    1. Wang R, Sun Y, Li C, et al. Targeting the DNA Damage Response for Cancer Therapy. Int J Mol Sci 2023;24:15907. 10.3390/ijms242115907 - DOI - PMC - PubMed

LinkOut - more resources