. 2025 Jul 28:19:1633355.
doi: 10.3389/fnhum.2025.1633355. eCollection 2025.

Vascular risk factors and neuroimaging heterogeneity across different white matter hyperintensities distribution patterns

Affiliations

Vascular risk factors and neuroimaging heterogeneity across different white matter hyperintensities distribution patterns

Junjun Wang et al. Front Hum Neurosci. .

Abstract

Background: Different white matter hyperintensities (WMHs) distribution patterns exhibit distinct clinical implications, but their underlying mechanisms remain unclear. This study explores vascular risk factors and neuroimaging features to elucidate their heterogeneity.

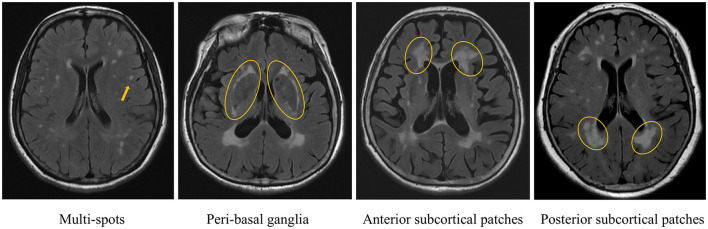
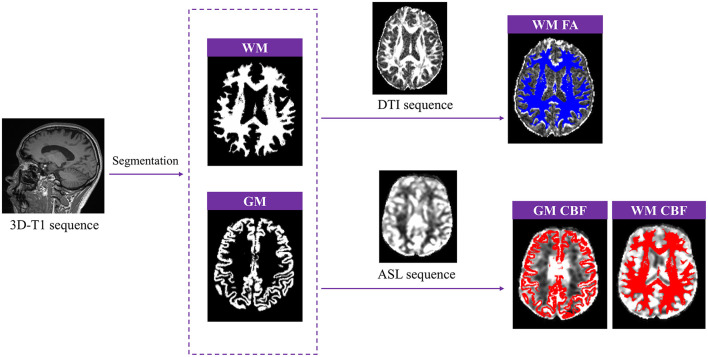
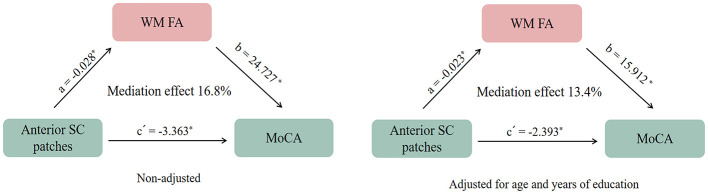
Methods: We retrospectively analyzed WMHs patients who underwent multimodal MRI at Zhejiang Hospital. Neuroimaging features included gray matter volume, white matter microstructure (Fractional anisotropy, FA), and cerebral blood flow (CBF) were assessed. Vascular risk factors and imaging features were compared across four different WMHs distribution patterns [multi-spots, peri-basal ganglia, anterior subcortical (SC) patches, and posterior SC patches]. Mediation analysis was performed to explore the role of imaging features on WMHs related cognitive impairment.

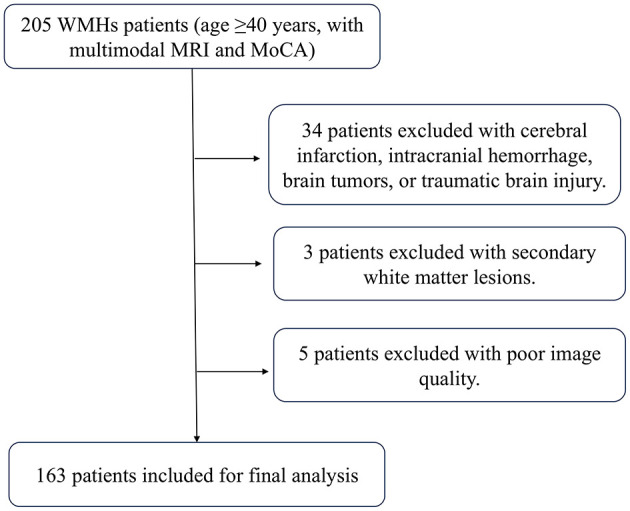
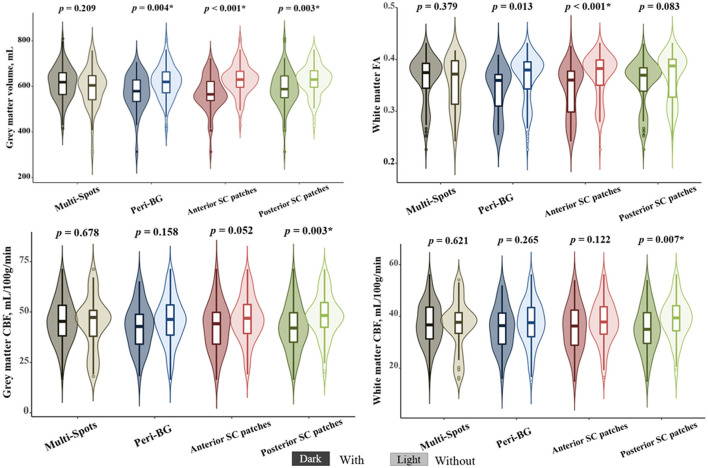
Results: A total of 163 patients were included in the final analysis. Among the four WMHs distribution patterns, hypertension was significantly more prevalent in patients with anterior SC patches [48 [85.7%] vs. 71 [66.4%], p = 0.008]. All WMH distribution patterns except multi-spots exhibited reduced gray matter volume (Bonferroni p < 0.0125). Notably, only patients with anterior SC patches exhibited a reduction in white matter FA (0.342 ± 0.049 vs. 0.370 ± 0.043, p < 0.001). Furthermore, patients with posterior SC patches displayed significantly lower CBF in both gray matter (42.65 ± 11.76 vs. 48.02 ± 10.97, p = 0.003) and white matter (35.25 ± 8.81 vs. 38.86 ± 8.07, p = 0.007). Mediation analysis revealed that white matter microstructural injury mediated the association between anterior SC patches WMHs and cognitive impairment [β = -0.371, Bootstrap 95% CI [-0.939, -0.006]].

Conclusion: This study demonstrates heterogeneity in vascular risk factors, gray matter volume, microstructural injury, and hypoperfusion across different WMHs patterns, underscoring the importance of subtype-specific mechanistic and therapeutic research.

Keywords: cerebral blood flow; cognitive impairment; heterogeneity; vascular risk factors; white matter hyperintensities; white matter microstructural injury.


Conflict of interest statement

The authors declare that the research was conducted in the absence of any commercial or financial relationships that could be construed as a potential conflict of interest.

Figures

Four brain MRI images showing different types of lesions. The first image highlights a multi-spot lesion, the second shows lesions near the peri-basal ganglia, the third displays anterior subcortical patches, and the fourth depicts posterior subcortical patches. Yellow outlines or markings are used to indicate specific areas of interest in each image.
Figure 1
Different white matter hyperintensities (WMHs) distribution patterns.
Flowchart depicting brain imaging sequences and segmentations. A 3D-T1 sequence undergoes segmentation, resulting in white matter (WM) and gray matter (GM) images. The WM image connects to a DTI sequence and results in WM FA and WM CBF images, showing fiber tracts and blood flow with blue and red color coding. The GM image connects to an ASL sequence, producing GM CBF, highlighting blood flow in red.
Figure 2
Post-processing of gray matter (GM) volume, white matter fractional anisotropy (WM FA), GM and WM cerebral blood flow (CBF).
Flowchart detailing patient selection for a study. Starts with 205 WMHs patients, age forty or older, with multimodal MRI and MoCA. Thirty-four excluded for cerebral infarction, intracranial hemorrhage, brain tumors, or traumatic injury. Three excluded for secondary white matter lesions. Five excluded for poor image quality. Final analysis includes 163 patients.
Figure 3
Flow chart of the selection process of the white matter hyperintensities (WMHs) patients.
Four violin plots displaying data on brain metrics such as grey matter volume, white matter fractional anisotropy (FA), grey matter cerebral blood flow (CBF), and white matter CBF. The plots compare different brain regions: multi-spots, peri-BG, anterior SC patches, and posterior SC patches. P-values are noted above each plot; significant values are marked with an asterisk. Various shades of color differentiate each region. A legend indicating “Dark,” “Light,” and “Without” is positioned at the bottom.
Figure 4
The correlations between different white matter hyperintensities (WMHs) patterns and neuroimaging features. *Bonferroni p < 0.0125.
Diagram illustrating two mediation models. Both models show the relationship between “Anterior SC patches,” “WM FA,” and “MoCA.” The first model (non-adjusted) shows a mediation effect of 16.8% with paths a = -0.028* and b = 24.727*. Path c' = -3.363*. The second model (adjusted for age and education) shows a mediation effect of 13.4% with paths a = -0.023* and b = 15.912*. Path c' = -2.393*. Arrows indicate the direction of relationships.
Figure 5
The mediating effect of white matter microstructural fractional anisotropy (WM FA) on the association between (white matter hyperintensities) WMHs patterns and Montreal Cognitive Assessment (MoCA) Scores. *p < 0.05.

Similar articles

References

    1. Bolandzadeh N., Davis J. C., Tam R., Handy T. C., Liu-Ambrose T. (2012). The association between cognitive function and white matter lesion location in older adults: a systematic review. BMC Neurol. 12:126. 10.1186/1471-2377-12-126 - DOI - PMC - PubMed
    1. Cao Z., Lin H., Gao F., Shen X., Zhang H., Zhang J., et al. (2023). Microstructural alterations in projection and association fibers in neonatal hypoxia-ischemia. J. Magn. Reson. Imaging. 57, 1131–1142. 10.1002/jmri.28366 - DOI - PMC - PubMed
    1. Chang E., Argyelan M., Aggarwal M., Chandon T., Karlsgodt K., Mori S., et al. (2017). The role of myelination in measures of white matter integrity: combination of diffusion tensor imaging and two-photon microscopy of CLARITY intact brains. Neuroimage 147, 253–261. 10.1016/j.neuroimage.2016.11.068 - DOI - PMC - PubMed
    1. Charidimou A., Boulouis G., Haley K., Auriel E., van Etten E. S., Fotiadis P., et al. (2016). White matter hyperintensity patterns in cerebral amyloid angiopathy and hypertensive arteriopathy. Neurology 86, 505–511. 10.1212/WNL.0000000000002362 - DOI - PMC - PubMed
    1. Combes A., O'Grady K., Rogers B., Schilling K., Lawless R., Visagie M., et al. (2022). Functional connectivity in the dorsal network of the cervical spinal cord is correlated with diffusion tensor imaging indices in relapsing-remitting multiple sclerosis. Neuroimage Clin. 35:103127. 10.1016/j.nicl.2022.103127 - DOI - PMC - PubMed

LinkOut - more resources