. 2025 Jul 28:16:1647329.
doi: 10.3389/fphar.2025.1647329. eCollection 2025.

The SAP130/Mincle axis was involved in sevoflurane-induced neuronal death and microglial activation in juvenile mice

Affiliations

The SAP130/Mincle axis was involved in sevoflurane-induced neuronal death and microglial activation in juvenile mice

Zi-Heng Zhou et al. Front Pharmacol. .

Abstract

Introduction: Sevoflurane is widely used in pediatric anesthesia and has raised concerns for years regarding its neurotoxic effects on the developing brain. Studies have shown that sevoflurane can lead to neuronal cell death and neuroinflammation, which further contribute to sevoflurane-induced neurotoxicity manifested as delirium or cognitive deficits. However, the molecular mechanism remains poorly understood. A factor of interest is Sin3A-associated protein 130 (SAP130), which can be released by dead or damaged cells and trigger sterile inflammation, exacerbating tissue damage by activating the macrophage-inducible C-type lectin (Mincle) receptor. However, whether the SAP130/Mincle axis is involved in sevoflurane-induced neurotoxicity remains unknown.

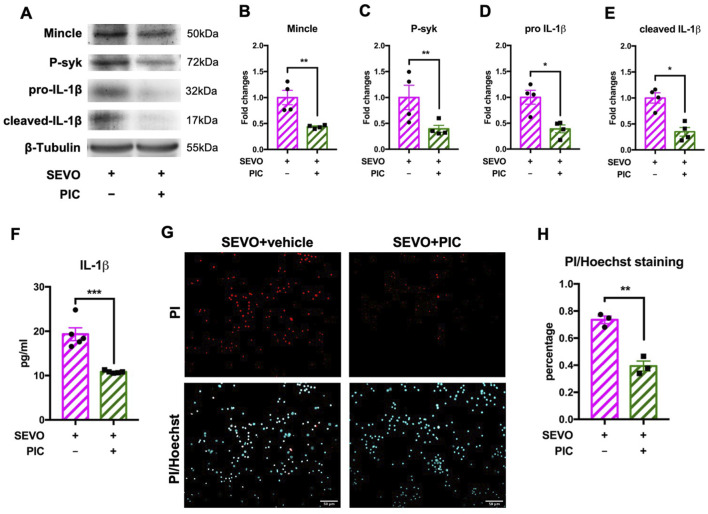
Methods: Using a young murine sevoflurane exposure model and a primary neuron-microglia co-culture system, we examined changes in neuronal cell death, microglial activation, cytokine production, and the expression levels of SAP130- and Mincle-signaling-associated proteins after sevoflurane exposure. We then applied SAP130-neutralizing antibody and the Syk inhibitor piceatannol to assess the impact of inhibiting the Mincle pathway on microglial activation and sevoflurane-induced neurotoxicity.

Results: The results demonstrated that sevoflurane exposure increased the number of dead neurons with SAP130 upregulation and induced microglial activation with cytokine production in the hippocampus. These changes occurred only in the neuron-microglia co-culture system but not in neuron or microglia monoculture. Neutralizing SAP130 or pharmacologically inhibiting syk diminished microglial activation and neuronal cell death by suppressing the SAP130/Mincle signaling pathway.

Discussion: These findings suggest that the SAP130/Mincle axis plays a crucial role in neuronal death and microglial activation in sevoflurane-induced neurotoxicity. Targeting this axis emerges as a potential therapeutic strategy to mitigate the neurotoxic effects of sevoflurane.

Keywords: Mincle; SAP130; microglia; neuroinflammation; neuron; sevoflurane.


Conflict of interest statement

The authors declare that the research was conducted in the absence of any commercial or financial relationships that could be construed as a potential conflict of interest. The reviewer JL declared a shared affiliation with the authors to the handling editor at the time of review.

Figures

FIGURE 1
FIGURE 1
(A) Representative images showing TUNEL and NeuN staining and co-localization. (B) Histogram showing the cell number of TUNEL-positive cells in the hippocampus; n = 4 per group. (C) Representative images showing SAP130 and MAP2 staining and co-localization; n = 6 per group. (D) Histogram showing the quantification of SAP130 relative intensity. (E) Representative images showing Iba-1 staining. (F) Histogram showing the quantification of Iba-1 relative intensity. (G) Histogram showing the number of Iba-1-positive cells. (H) Histogram showing changes in cell size of Iba-1-positive cells; n = 3 per group. Student’s t-test; data are presented as the mean ± SEM; *P < 0.05 and **P < 0.01.
FIGURE 2
FIGURE 2
(A) Representative images of PI/Hoechst staining in primary neurons. (B) Histogram showing changes in the percentage of dead neurons after sevoflurane exposure; n = 3 per group. Two-way ANOVA followed by multiple comparisons test. (C) Histogram of CCK-8 assay showing cell viability of neurons after sevoflurane exposure; n = 3 per group. (D) Histogram of the CCK-8 assay showing cell viability of microglia after sevoflurane exposure; n = 5 per group; Student’s t tests. (E) Histogram showing the quantification of SAP130 in the cultured medium after sevoflurane exposure; two-way ANOVA followed by Sidak’s multiple comparisons test. (F) Histogram showing changes in cytokine mRNA levels in primary microglia; two-way ANOVA followed by Sidak’s multiple comparisons test. (G) Histogram showing changes in cytokine mRNA levels in primary microglia co-cultured with neurons. (H) Histogram showing changes in IL-1β protein levels in cultured medium; n = 6 per group. (I) Histogram showing changes in IL-6 protein levels in cultured medium; n = 3 per group. (J) Histogram showing changes in TNF-α protein levels in the cultured medium; n = 4 per group. Two-way ANOVA followed by Sidak’s multiple comparisons test. Data are presented as the mean ± SEM; *p < 0.05 and **p < 0.01.
FIGURE 3
FIGURE 3
(A) Representative images of Mincle and Iba-1 co-staining in the hippocampus. (B) Histogram showing the quantification of Mincle relative intensity in the hippocampus; n = 5 per group. Student’s t-test. (C) Representative WB images of primary microglia treated using recombinant SAP130 or LPS. (D) Histogram showing Mincle expression in primary microglia; n = 3 per group. One-way ANOVA followed by Tukey’s multiple comparisons test. (E) Representative WB images of primary microglia after sevoflurane exposure or being co-cultured with primary neurons. (F) Histogram showing Mincle expression in primary microglia. (G) Histogram showing phosphorylated syk expression in primary microglia. (H) Histogram showing pro-IL-1β expression in primary microglia. (I) Histogram showing cleaved IL-1β expression in primary microglia. n = 3 per group; two-way ANOVA followed by Sidak’s multiple comparisons test. Data are presented as the mean ± SEM; *P < 0.05 and **P < 0.01.
FIGURE 4
FIGURE 4
(A) Representative WB images of primary microglia treated with recombinant SAP130 and sevoflurane. (B) Histogram showing Mincle expression in primary microglia. (C) Histogram showing phosphorylated syk expression in primary microglia. (D) Histogram showing pro-IL-1β expression in primary microglia. (E) Histogram showing cleaved IL-1β expression in primary microglia; n = 4 per group. (F) Histogram showing the quantification of IL-1β in the cultured medium; n = 4 per group. (G) Representative images of PI/Hoechst staining in primary neurons. (H) Histogram showing changes in the percentage of dead neurons after recombinant SAP130 and sevoflurane treatment; n = 5 per group. Student’s t-test; data are presented as the mean ± SEM. *P < 0.05, **P < 0.01, and ***P < 0.001.
FIGURE 5
FIGURE 5
(A) Representative WB images of primary microglia treated with piceatannol and sevoflurane. (B) Histogram showing Mincle expression in primary microglia. (C) Histogram showing phosphorylated syk expression in primary microglia. (D) Histogram showing pro-IL-1β expression in primary microglia. (E) Histogram showing cleaved IL-1β expression in primary microglia; n = 4 per group. (F) Histogram showing the quantification of IL-1β in cultured medium; n = 5 per group. (G) Representative images of PI/Hoechst staining in primary neurons. (H) Histogram showing changes in the percentage of dead neurons after piceatannol treatment and sevoflurane exposure; n = 5 per group. Student’s t-test; data are presented as the mean ± SEM. *P < 0.05, **P < 0.01, and ***P < 0.001.
FIGURE 6
FIGURE 6
(A) Representative WB images of the hippocampus treated with piceatannol and sevoflurane. (B) Histogram showing Mincle expression in the hippocampus. (C) Histogram showing phosphorylated syk expression in the hippocampus. (D) Histogram showing pro-IL-1β expression in the hippocampus. (E) Histogram showing cleaved IL-1β expression in the hippocampus; n = 4 per group. (F) Representative images of Mincle and Iba-1 staining in the hippocampus. (G) Histogram showing the quantification of relative Mincle intensity in the hippocampus; n = 5 per group. (H) Representative images of TUNEL and NeuN staining in the hippocampus. (I) Histogram showing the cell number of TUNEL-positive cells after piceatannol treatment and sevoflurane exposure; n = 4 per group. Student’s t-test; data are presented as the mean ± SEM. *P < 0.05, **P < 0.01, and ***P < 0.001.

Similar articles

References

    1. Ahlemeyer B., Baumgart-Vogt E. (2005). Optimized protocols for the simultaneous preparation of primary neuronal cultures of the neocortex, hippocampus and cerebellum from individual newborn (P0.5) C57Bl/6J mice. J. Neurosci. Methods 149, 110–120. 10.1016/j.jneumeth.2005.05.022 - DOI - PubMed
    1. Alam A., Hana Z., Jin Z., Suen K. C., Ma D. (2018). Surgery, neuroinflammation and cognitive impairment. EBioMedicine 37, 547–556. 10.1016/j.ebiom.2018.10.021 - DOI - PMC - PubMed
    1. Areias J., Sola C., Chastagnier Y., Pico J., Bouquier N., Dadure C., et al. (2023). Whole-brain characterization of apoptosis after sevoflurane anesthesia reveals neuronal cell death patterns in the mouse neonatal neocortex. Sci. Rep. 13, 14763. 10.1038/s41598-023-41750-w - DOI - PMC - PubMed
    1. Dai J., Li X., Wang C., Gu S., Dai L., Zhang J., et al. (2021). Repeated neonatal sevoflurane induced neurocognitive impairment through NF-κB-mediated pyroptosis. J. Neuroinflammation 18, 180. 10.1186/s12974-021-02233-9 - DOI - PMC - PubMed
    1. Dai Y., Yan M., Wan J., Xiao T. (2022). Maf1 mitigates sevoflurane-induced microglial inflammatory damage and attenuates microglia-mediated neurotoxicity in HT-22 cells by activating the AMPK/Nrf2 signaling. Neurotoxicology 90, 237–245. 10.1016/j.neuro.2022.04.003 - DOI - PubMed

LinkOut - more resources