. 2025 Jul 28:15:1563095.
doi: 10.3389/fonc.2025.1563095. eCollection 2025.

Insights into the role of MSLN-positive circulating tumor cell as an auxiliary diagnostic biomarker in epithelial ovarian cancer

Affiliations

Insights into the role of MSLN-positive circulating tumor cell as an auxiliary diagnostic biomarker in epithelial ovarian cancer

Hang Xu et al. Front Oncol. .

Abstract

Background: Epithelial ovarian cancer (EOC) currently lacks highly specific biomarkers for clinical screening. This study aimed to identify and validate novel auxiliary diagnostic markers for EOC.

Methods: Through integrated analysis of transcriptome sequencing data and single-cell RNA sequencing from public databases, we identified mesothelin (MSLN) as an EOC-specific target. MSLN expression was subsequently validated in EOC cell lines and clinical specimens by flow cytometry, immunofluorescence, and immunohistochemistry. The capture efficacy of Pep@MNPs (Magnetic nanoparticles functionalised with EpCAM peptides) on EOC cells was verified by scanning electron microscopy, Prussian blue staining and cell spiked-blood capture experiments. In a prospective cohort of 35 patients with undiagnosed ovarian masses, we employed immunofluorescence staining to detect MSLN-positive circulating tumor cells (MSLN(+)CTCs) and assessed their diagnostic performance using receiver operating characteristic (ROC) analysis.

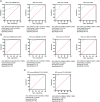
Results: MSLN was highly expressed in EOC cell line and tissues but lowly expressed in normal ovarian surface epithelial tissues. EOC cells can be captured by Pep@MNPs with high sensitivity and specificity. ROC curves analysis showed that MSLN(+)CTCs differentiated between benign and malignant lesions of the ovary with a sensitivity of 66.67% and a specificity of 95% (p = 0.0014), which was more specific than cancer antigen 125 (CA125) (sensitivity: 71.43%; specificity: 94.47%; p < 0.0001) and human epididymis protein 4 (HE4) (sensitivity: 84.62%; specificity: 89.47%; p = 0.0002). When MSLN(+)CTCs were combined with CA125, the sensitivity was 92.86% and the specificity was 94.74%, p < 0.0001, which greatly improved the diagnostic sensitivity while preserving high specificity.

Conclusions: MSLN(+)CTCs represent a highly specific auxiliary biomarker for differentiating benign and malignant ovarian lesions. The combination of MSLN(+)CTCs with CA125 provides an optimal balance between sensitivity and specificity, offering promising clinical utility for EOC diagnosis.

Keywords: EpCAM (CD326); MSLN; circulating tumor cells; diagnosis; epithelial ovarian cancer.


Conflict of interest statement

Authors QL and MW were employed by the company Nanopep Biotech Corporation. The remaining authors declare that the research was conducted in the absence of any commercial or financial relationships that could be construed as a potential conflict of interest.​

Figures

Figure 1
Figure 1
Selection and validation of MSLN as a biomarker specific for epithelial ovarian cancer (EOC). (A) Flowchart illustrating the systematic approach to identify EOC-specific genes by transcriptome sequencing analysis and single-cell analysis. (B) Expression profiles of MSLN in multiple cancer types (red bars, TCGA data) and their corresponding normal tissues (black bars, GTEx data). X-axis shows tissue abbreviations from TCGA, where “OV” stands for ovarian cancer. Other abbreviations represent different cancer types. Y-axis shows MSLN expression in TPM. (C) Box plot comparing MSLN expression levels between EOC tissues (left box, TCGA dataset, n=425) and normal ovarian tissues (right box, GTEx dataset, n=88), y-axis represents log2 transformed MSLN expression values. (D) UMAP visualization of single-cell data showing different cell types in ovarian tissues (left plot), where cell types are represented by different colors according to the legend, and MSLN expression distribution (right plot), where expression levels are represented by color intensities (red=high, blue=low) according to the expression scale. (E) Box line plot showing MSLN expression in different grades of ovarian cancer in the GEO database, where grade 1 is blue, grade 2 is yellow and grade 3 is gray. (F) Box line plot of MSLN expression for different grades of EOC in the TCGA database, where grade 2 is blue and grade 3 is yellow. (G) box line plot of MSLN expression at different clinical stages in the GEO database, comparing early (I+II, blue) with late (III+IV, yellow). (H) Box line plot of MSLN expression at different clinical stages in the TCGA database comparing early (I+II, blue) with late (III+IV, yellow). *p < 0.05, ns, not significant, p > 0.05.
Figure 2
Figure 2
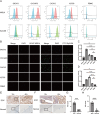
Validation of MSLN and EpCAM expression levels in OC cells and tissues. (A) The expression levels of MSLN and EpCAM on the surface of SKOV3, OVCAR3, CAOV3, A2780 and PBMC cells were verified by flow cytometry (n=3), where the red peak is the expression level of MSLN, the green peak is the expression level of EpCAM, and the blue peak is the unstained negative control. X-axis represents the fluorescence intensity and y-axis represents the ratio of the number of cells compared to the maximum count value. The percentage of negative cells is shown in the upper left corner of the graph, and the percentage of positive cells is shown in the upper right corner of the graph. (B) Immunofluorescence images show the expression levels of MSLN and EpCAM on the surface of SKOV3, OVCAR3, CAOV3, A2780, and PBMC cells (scale bar, 50μm). (C) Quantitative statistical plots of relative fluorescence intensity of MSLN expression levels on the surface of SKOV3, OVCAR3, CAOV3, A2780 and PBMC cells (n=3), x-axis is cell name and y-axis is relative fluorescence intensity. (D) Quantitative statistical plots of the relative fluorescence intensity of EpCAM expression levels on the cell surface of SKOV3, OVCAR3, CAOV3, A2780 and PBMC cells (n=3), x-axis is cell name and y-axis is relative fluorescence intensity. (E) Immunohistochemistry was performed to verify the expression levels of MSLN in epithelial ovarian cancer and normal ovarian surface epithelial tissue (indicated by the arrows, 10×, scale bar, 100μm; 40×, scale bar, 20μm). (F) Immunohistochemical verification of EpCAM expression levels in epithelial ovarian cancer and normal ovarian surface epithelial tissue (indicated by the arrows, 10×, scale bar, 100μm; 40×, scale bar, 20μm). (G) Quantitative statistical plots of MSLN expression levels in tissues (EOC, n=10; Normal, n=5). X-axis is the group and y-axis is the immunohistochemical score. (H) Quantitative statistical plots of EpCAM expression levels in tissues (EOC, n=10; Normal, n=5). X-axis is the group and y-axis is the immunohistochemical score. **p < 0.01, ***p < 0.001, ****p < 0.0001, ns, p > 0.05.
Figure 3
Figure 3
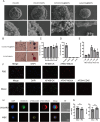
Validation of Pep@MNPs for OC cells capture efficiency and exploration of optimal dilution ratio of MSLN antibody. (A) Scanning electron microscopy images verifying the binding of Pep@MNPs to OC cells (n=3, scale bars, 5 μm and 1 μm). (B) Prussian blue-stained images verified the binding of Pep@MNPs to ovarian cancer cells (n=3, 40×, scale bar, 20 μm and enlarge, scale bar, 10 μm). (C) Capture efficiency of Pep@MNPs when OVCAR3 cells were spiked into blood in a number gradient of 100, 500, 1000, 2000, and 7000 (n=3). The x-axis is the number of spiked cells and the y-axis is the capture efficiency. (D) Capture efficiency of Pep@MNPs for ovarian cancer cells (OVCAR3, SKOV3, A2780) as well as leukocytes (Jurkat) spiked into blood (n=3). The x-axis is the cell name and the y-axis is the capture efficiency. (E) Mean fluorescence intensity of ovarian cancer cells when stained with different dilutions (1:100, 200, 300, 400, 500) of MSLN antibody (n=3). The x-axis is the antibody dilution ratio and the y-axis is the mean fluorescence intensity. (F) Immunofluorescence images of OVCAR3 staining in PBS environment and blood environment, respectively (n=3, scale bar, 50μm). (G) Statistical plots of the mean fluorescence intensity of OVCAR3 in the blood and PBS environments for CK and MSLN (Cells in 9 fields of view). The x-axis represents different staining environments and the y-axis represents the mean fluorescence intensity of gene on the cell surface in the field of view. The black dot represents the mean fluorescence intensity of the cells in one field of view. (H) Immunofluorescence images of individual OVCAR3 and WBC undergoing mixed staining in the blood environment. BF stands for Bright Field (n=3, scale bar, 10 μm). “ns”, p>0.05.
Figure 4
Figure 4
Immunofluorescence images of MSLN(+)CTC (MSLN-positive CTC), CTC, and WBC captured in clinical samples. Characterization: MSLN-positive CTC (CKmix+/DAPI+/CD45-/MSLN+), CTC (CKmix+/DAPI+/CD45-), WBC (CKmix-/DAPI+/CD45+). BF stands for Bright Field.
Figure 5
Figure 5
MSLN(+)CTC, CTC, CA125 and HE4 were used for differentiating benign and malignant ovarian lesions. (A) ROC curves for MSLN(+)CTC, CTC, CA125 and HE4 were used for differentiating benign and malignant ovarian lesions. The x-axis is the false positive rate, the y-axis is the true positive rate, the red line is the null curve, and the blue line is the ROC curve. (B) Dual indicators combined ROC curves used for differentiating benign and malignant ovarian lesions. The x-axis is the false positive rate, the y-axis is the true positive rate, the red line is the null curve, and the blue line is the ROC curve. (C) Triple indicators combined ROC curves used for differentiating benign and malignant ovarian lesions. The x-axis is the false positive rate, the y-axis is the true positive rate, the red line is the null curve, and the blue line is the ROC curve.

Similar articles

References

    1. Webb PM, Jordan SJ. Global epidemiology of epithelial ovarian cancer. Nat Rev Clin Oncol. (2024) 21:389–400. doi: 10.1038/s41571-024-00881-3, PMID: - DOI - PubMed
    1. Sung H, Ferlay J, Siegel RL, Laversanne M, Soerjomataram I, Jemal A, et al. Global cancer statistics 2020: GLOBOCAN estimates of incidence and mortality worldwide for 36 cancers in 185 countries. CA Cancer J Clin. (2021) 71:209–49. doi: 10.3322/caac.21660, PMID: - DOI - PubMed
    1. Torre LA, Trabert B, DeSantis CE, Miller KD, Samimi G, Runowicz CD, et al. Ovarian cancer statistics, 2018. CA Cancer J Clin. (2018) 68:284–96. doi: 10.3322/caac.21456, PMID: - DOI - PMC - PubMed
    1. Chang L, Ni J, Zhu Y, Pang B, Graham P, Zhang H, et al. Liquid biopsy in ovarian cancer: recent advances in circulating extracellular vesicle detection for early diagnosis and monitoring progression. Theranostics. (2019) 9:4130–40. doi: 10.7150/thno.34692, PMID: - DOI - PMC - PubMed
    1. Hacker NF, Rao A. Surgery for advanced epithelial ovarian cancer. Best Pract Res Clin Obstetrics Gynaecology. (2017) 41:71–87. doi: 10.1016/j.bpobgyn.2016.10.007, PMID: - DOI - PubMed

LinkOut - more resources