. 2025 Jul 28:19:1595880.
doi: 10.3389/fnins.2025.1595880. eCollection 2025.

mTORC1-selective inhibitors rescue cellular phenotypes in TSC iPSC-derived neurons

Affiliations

mTORC1-selective inhibitors rescue cellular phenotypes in TSC iPSC-derived neurons

Elizabeth D Buttermore et al. Front Neurosci. .

Abstract

The mechanistic target of rapamycin (mTOR) pathway plays an important role in regulating multiple cellular processes, including cell growth, autophagy, proliferation, protein synthesis, and lipid synthesis, among others. Given the central role of this pathway in multiple cellular processes, it is not surprising that mTOR pathway dysregulation is a key mechanism underlying several neurological disorders, including Tuberous Sclerosis Complex (TSC). TSC patients typically present with pathogenic variants in the TSC1 or TSC2 genes, which encode proteins forming a complex that plays an important role in modulating mTOR activity. We previously reported cellular and functional deficits in induced pluripotent stem cell (iPSC)-derived neurons from TSC patients. These deficits were reversed by inhibiting mTOR activity using rapamycin treatment, revealing the role of mTOR signaling in the regulation of cell morphology and hyperexcitability phenotypes in TSC patient-derived neurons. However, chronic rapamycin treatment inhibits both mTORC1 and mTORC2 activity and its clinical use is associated with significant side effects. With the development of novel mTORC1-selective compounds, we aimed to assess whether selective inhibition of mTORC1 likewise reversed the cellular and functional deficits found in TSC patient-derived neurons. Our results indicate that the novel, selective mTORC1 inhibitors nearly fully reversed the cellular and functional deficits of TSC2 -/ - iPSC-derived neurons in a fashion and magnitude similar to rapamycin, as they all reversed and near-normalized their neuronal hyperexcitability and abnormal morphology as compared to the DMSO-treated cells. These data suggest that mTORC1-specific compounds could provide clinical therapeutic benefit similar to rapamycin without the same side effects.

Keywords: TSC2; hyperexcitability; iPSC-derived neurons; mTOR; mTORC1; mTORC2; soma size.


Conflict of interest statement

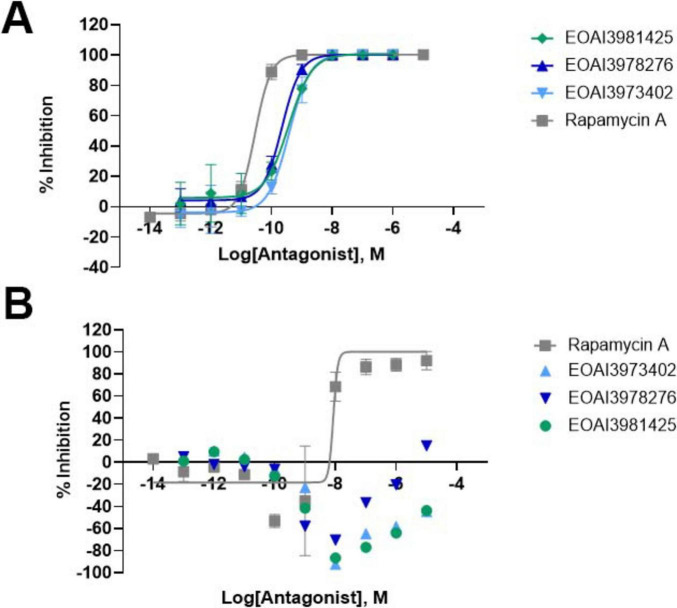
ST was employed by Aeovian Pharmaceuticals, Inc. The remaining authors declare that the research was conducted in the absence of any commercial or financial relationships that could be construed as a potential conflict of interest. The authors declare that this study received funding from Aeovian Pharmaceuticals, Inc. The funder had the following involvement in the study: funding from Aeovian supported the development of the novel compounds and the AlphaLISA data presented in Figure 1. Beyond this, Aeovian was involved in the selection of compounds to test on the iPSC-derived neuron assays, the selection of doses tested, and the writing and editing of the manuscript.

Figures

Two graphs labeled A and B display the percentage of inhibition against the log concentration of antagonists, including Rapamycin A and EOAI compounds. Graph A shows all lines rising sharply around -10 on the x-axis. Graph B has varying line patterns with Rapamycin A showing a distinct increase. Error bars indicate variability in data points.
FIGURE 1
AlphaLISA mammalian target of rapamycin complex 1 (mTORC1) and mammalian target of rapamycin complex 2 (mTORC2) assays reveal mTORC1-selectivity of novel compounds. (A) AlphaLISA data showing percent inhibition of P70 S6K phosphorylation as a readout of mTORC1 activity using PC3 cell lysates collected following compound treatment in dose-response. (B) AlphaLISA data showing percent inhibition of AKT1/2/3 (pS473) phosphorylation as a readout of mTORC2 activity using PC3 cell lysates collected following compound treatment in dose-response.
Diagram A depicts the experimental timeline and setup for treating neurons derived from TSC2-/- hiPSCs with different compound concentrations. B shows images of neuronal cultures treated with DMSO and varying concentrations of rapamycin, stained with Hoechst, MAP2, and TUJ1, with a merged view. Increased concentration of rapamycin correlates with variations in neuronal morphology and organization. Scale bars are included.
FIGURE 2
Dose response treatment design and representative images with rapamycin dose-response treatment. (A) Schematic for the experiment. TSC2–/– human induced pluripotent stem cells (iPSCs) were differentiated to neurons by overexpressing NGN2. These neurons were replated along with commercially available astrocytes onto multi-electrode array (MEA) plates to monitor neuronal activity as well as onto 96 well plates for immunocytochemistry (ICC). Treatment with various concentrations of the mTORC1-selective inhibitors or with rapamycin was started around day 10 and continued until day 21. Recordings were performed every 2–3 days starting from day 2 of plating until day 42. Cells were fixed for staining on 1 day after the treatment period ended, on day 22. (B) Representative images of TSC2–/– iPSC-derived neurons fixed on day 22 following 2 weeks of Rapamycin treatment at the doses listed (DMSO control, 0.1 nM Rapamycin, 1 nM Rapamycin, 300 nM Rapamycin) with immunohistochemistry against MAP2, TUJ1, and nuclear stain HOECHST. Scale bar = 100 μm. Schematic in A was generated using BioRender.
Graphs A and C show changes in weighted mean firing rate (WMFR) and synchrony index over time for compounds like Rapamycin and others indicated by numbers (e.g., 402, 425, 276). Different colors and symbols represent varying concentrations, with the x-axis showing days post plating. Graphs B and D display normalized WMFR and synchrony index at specific days, related to compound doses in nanomolars. Error bars indicate variability in data points.
FIGURE 3
Dose response of novel mammalian target of rapamycin complex 1 (mTORC1)-selective inhibitors on neuronal activity. (A) Weighted mean firing rate (WMFR) over time for select doses of mTORC1-selective inhibitors or of rapamycin with the treatment window highlighted in blue. (B) Dose response curve to determine the WMFR IC50 of neurons on day 23 upon treatment with the mTORC1-selective inhibitors 276, 402, 425 or with rapamycin for 2 weeks until day 21. (C) Synchrony index over time for select doses of mTORC1-selective inhibitors or of rapamycin with the treatment window highlighted in blue. (D) Synchrony IC50 curves on day 26 of the experiment where neurons were treated with mTORC1-selective inhibitors or with rapamycin. Representative data from one of two batches shown here. Data shown as mean ± s.e.m. of 8 technical replicates for each dose at each time point except on day 4 where outliers were excluded due to errors during recording the plate in the first few days post-plating, and 2–8 technical replicates were plotted instead. For (B,D), data was normalized to DMSO-treated controls. Representative curves from one of two batches has been shown; data represented as mean ± s.e.m. of 4–8 technical replicates.
Panel A shows fluorescent microscopy images of cells stained with Hoechst and MAP2 under different treatments: DMSO, Rapamycin, and compounds 402, 425, 276. Images display blue nuclei and green neuronal structures. Panels B, C, and D present graphs showing the effects of different compound doses on mean cell counts, mean soma area measured by MAP2, and mean total outgrowth, respectively. Each graph includes data from replicates of compounds 402, 425, 276, and Rapamycin, demonstrating dose-dependent responses.
FIGURE 4
Effect of novel mammalian target of rapamycin complex 1 (mTORC1)-selective inhibitors on cell morphology. (A) Representative MAP2 immunofluorescence staining of neurons treated with 300 nM of either rapamycin or of each of the mTORC1-selective inhibitors-compounds 402, 425, 276. Panel on the right is a magnified version of the region highlighted in white on the left. Scale bar = 100 μm for images on the left and 50 μm for the images on the right. (B) Average number of cells per well normalized to DMSO-treated controls measured by quantifying nuclear Hoechst staining. (C) Dose response of the compounds on cell size measured by quantifying MAP2+ soma area. (D) Dose response of compounds on neurite outgrowth as assessed by MAP2 staining normalized to DMSO-treated controls. For (B–D), data from each of the two batches of neurons has been shown separately. Data represented as mean ± s.e.m. of 9–18 technical replicates per batch; this data was collected from two technical replicate wells per batch with 9 fields of view imaged per well and outlier wells with debris were excluded from the analysis.

Similar articles

References

    1. Afshar Saber W., Sahin M. (2020). Recent advances in human stem cell-based modeling of Tuberous Sclerosis Complex. Mol Autism 11:16. 10.1186/s13229-020-0320-2 - DOI - PMC - PubMed
    1. Balgi A. D., Fonseca B. D., Donohue E., Tsang T. C., Lajoie P., Proud C. G., et al. (2009). Screen for chemical modulators of autophagy reveals novel therapeutic inhibitors of mTORC1 signaling. PLoS One 4:e7124. 10.1371/journal.pone.0007124 - DOI - PMC - PubMed
    1. Bateup H. S., Johnson C. A., Denefrio C. L., Saulnier J. L., Kornacker K., Sabatini B. L. (2013). Excitatory/inhibitory synaptic imbalance leads to hippocampal hyperexcitability in mouse models of tuberous sclerosis. Neuron 78 510–522. 10.1016/j.neuron.2013.03.017 - DOI - PMC - PubMed
    1. Bielefeld-Sevigny M. (2009). AlphaLISA immunoassay platform- the “no-wash” high-throughput alternative to ELISA. Assay Drug Dev. Technol. 7 90–92. 10.1089/adt.2009.9996 - DOI - PubMed
    1. Bissler J. J., Kingswood J. C., Radzikowska E., Zonnenberg B. A., Belousova E., Frost M. D., et al. (2017). Everolimus long-term use in patients with tuberous sclerosis complex: Four-year update of the EXIST-2 study. PLoS One 12:e0180939. 10.1371/journal.pone.0180939 - DOI - PMC - PubMed

LinkOut - more resources