. 2025 Aug 12;135(21):e189566.
doi: 10.1172/JCI189566. eCollection 2025 Nov 3.

Divergent TIR signaling domains in TLR7 and TLR9 control opposing effects on systemic autoimmunity

Affiliations

Divergent TIR signaling domains in TLR7 and TLR9 control opposing effects on systemic autoimmunity

Claire Leibler et al. J Clin Invest. .

Abstract

Toll like receptor (TLR) 7 and 9, endosomal sensors for RNA and DNA, are key mediators of autoreactivity. Although generally considered homologous, they paradoxically have opposing effects on lupus: TLR7 exacerbates the disease while TLR9 protects from it How they mediate opposing effects in autoimmunity remains undetermined. We hypothesized that differences in signaling qualities of the Toll-Interleukin 1 Receptor (TIR) domains of TLR7 and TLR9 could be responsible for their opposing effects. To test this, we introduced the TIR domain of TLR9 into the endogenous Tlr7 locus and the TLR7 TIR domain into the endogenous Tlr9 locus of mice, creating chimeric molecules termed TLR779 and TLR997. Lupus-prone MRL/lpr mice carrying Tlr779 had greatly ameliorated disease, while MRL/lpr mice carrying Tlr997 had markedly exacerbated disease compared with respective TlrWT mice. These experiments establish that TLR7 and TLR9 TIR domains have divergent properties and control disease quality, thus explaining the longstanding "TLR paradox".

Keywords: Autoimmunity; Immunology; Innate immunity; Lupus.


Conflict of interest statement

Conflict of interest: The authors have declared that no conflicts of interest exist.

Figures

Figure 1
Figure 1. Creation of a chimeric RNA-sensing TLR7 with TLR9 signaling capacities.
(A) Amino-acid sequences of the transmembrane-TIR junctions. (B) surface and intracellular staining of TLR7 in CD23hi CD21lo FO, CD23lo CD21hi MZ, CD11c+CD11b+ ABCs B cells of 5-week-old Tlr7+/Y or Tlr779/Y (all Tlr9–/–) male MRL/lpr mice. Data were analyzed by Wilcoxon matched-pairs signed rank test. (C) TLR7 endosomal localization was evaluated by confocal microscopy in sorted splenic MZ B cells and in ABCs of 6–7week old female Tlr7+/+ and Tlr779/779 MRL/lpr mice. Left and right panels show representative 1,000x magnification images and 3D reconstructed images of TLR7+ endosomes. Colored spheres indicate EEA1, LAMP-1, and TLR7 spot counting. The percentage of TLR7+ EEA1+ or LAMP-1+ endosomes in Tlr7+/+or Tlr779/779 MZ B cells or ABCs (EEA1 staining, MZ B cells, Tlr7+/+ n = 10 cells, Tlr779/779 n = 13 cells; LAMP-1 staining, MZ B cells Tlr7+/+n = 20 cells, Tlr779/779 n = 11 cells; ABC Tlr7+/+ n = 15 cells, Tlr779/779 n = 14 cells; from 2 mice).The mean volume of the reconstructed TLR7 spots (MZ B cells, Tlr7+/+ n = 30 cells, Tlr779/779 n = 24 cells; ABC B cells, Tlr7+/+ n = 15 cells, Tlr779/779 n = 14 cells, from 2 mice) Data were analyzed by 1-way ANOVA with Sidak’s multiple comparisons test. (D) Splenocytes from 5–6-week-old Tlr7+/Y Tlr9–/– or Tlr779/Y Tlr9–/– male MRL/lpr mice were stimulated with different doses of TLR7 agonist (CL097; μg/ml) for 120 min. Quantification of the NF-κB nuclear localization score in FO CD21int or MZ CD21hi B cells (upper and lower panels). Data points indicate the mean score quantified for n = 6 mice per genotype and bars indicate the SEM of 2 experiments pooled. Data were analyzed by multiple paired t test. For statistics, *P < 0.05, **P < 0.01, ***P < 0.001, ****P < 0.0001.
Figure 2
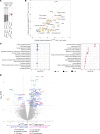
Figure 2. Differences in B cell–signaling qualities driven by TLR777 or TLR779.
Transcriptome analysis of bead-purified B cells from 5–7week-old Tlr7+/Y Tlr9–/– or Tlr779/Y Tlr9–/– male MRL/lpr mice that were stimulated with TLR7 agonist (CL097; 5 μg/ml) for 4 hours. (A) Number of differentially expressed genes (DEGs) identified using the limma R package (log2 FC > 0.5 and FDR-corrected P < 0.05), between stimulated versus unstimulated samples (first 2 columns) or between the 2 genotypes, with or without stimulation (last 2 columns). (B) Upstream regulators that are predicted to be significantly activated upon CL097 stimulation by the IPA software in Tlr7+/Y (Y-axis) or Tlr779/Y (X-axis) B cells. XY plot shows the predicted z-score. (C) Bubble plot shows the top 15 reactome pathways enriched in Tlr779/Y (stim) (pink bubbles) and Tlr7+/Y (stim) (dark blue bubbles) regulated genes (from the Tlr779/Y (stim) vs Tlr7+/Y (stim) comparison). X-axis shows the –log10 FDR for the enriched terms displayed on Y-axis. Bubble size shows the genes in the pathway that are also differentially expressed in Tlr779/Y versus Tlr7+/Y. Enrichment was calculated using Fisher’s exact test (with all expressed genes as background) followed by Storey’s Q value FDR correction. (D) Volcano plot representing the DEGs between Tlr7+/Y and Tlr779/Y stimulated B cells. X-axis shows the log2 fold change value and Y-axis shows –log10 (FDR). The dotted lines separate the significant (FDR < 0.05) and nonsignificant (FDR > 0.05) genes and indicate the log2FC –0.5 and 0.5 cut-offs. The significant DEGs (log2 FC > 0.5, and FDR-corrected P value of < 0.05) were annotated based on the reported functions of their corresponding proteins in B cell activation (green dots), cell death (yellow dots), TLR-mediated inflammation (red dots), negative regulation of TLR-mediated inflammation and cell activation (blue dots), or if the genes were IFN-induced genes (pink dots).
Figure 3
Figure 3. TLR779 protects from lupus disease.
16–18-week-old Tlr7+/+, Tlr779/779 or Tlr7–/– (all Tlr9–/–) MRL/lpr mice were assessed for disease endpoints. Disease endpoints were also assessed in age-matched WT Tlr7+/+ and Tlr9+/+ MRL/lpr mice as a reference but were not included in the statistical analysis (BE). (A) Schematic of the different mouse genotypes that are compared. The groups were labeled Tlr7+/+, Tlr779/779 or Tlr7–/– if both males and females were included. (B and C) Spleen and lymph node weights were measured in mice of the indicated sex and genotypes. (D) Kidney pathology was assessed in mice of the indicated sex and genotypes. For B–D, reference group female n = 12, male n = 11; experimental group female Tlr7+/+n = 19, Tlr779/779 n = 21, Tlr7–/– n = 25; male Tlr7+/Yn = 20, Tlr779/Y n = 24, Tlr7–/Y n = 14. (E) Quantification of anti-RNA (reference group n = 9; experimental group Tlr7+/+n = 6, Tlr779/779 n = 13, all females) and anti-Smith autoantibodies (reference group n = 18; experimental group Tlr7+/+n = 16, Tlr779/779 n = 19, males and females). (FH) Splenic B and T cell subsets were assessed by flow-cytometry in MRL/lpr mice of the indicated genotypes. (F) Percent of CD19+ cells among live splenocytes, and CD11b+ CD11c+ ABCs among live B cells (CD19+: Tlr7+/+n = 14, Tlr779/779 n = 25, Tlr7–/– n = 24; ABC: Tlr7+/+n = 12, Tlr779/779 n = 17, Tlr7–/– n = 24). (G) Percent of TCRCD44hiCD138+ plasmablasts among live splenocytes in mice of the indicated genotypes (Tlr7+/+n = 9, Tlr779/779 n = 25, Tlr7–/– n = 24). (H) Percent of naive (CD62Lhi CD44lo), activated (CD62Lhi CD44hi), and memory (CD62Llo CD44hi) T cells among live TCR+ CD4+ splenocytes (Tlr7+/+n = 14, Tlr779/779 n = 25, Tlr7–/– n = 24). For all panels, data points indicate individual mice and bars indicate the mean ± SEM For statistics, *P < 0.05, **P < 0.01, ***P < 0.001, ****P < 0.0001, using a 1-way ANOVA with Tukey’s multiple comparisons test for all panels except E; Mann-Whitney test for panel E.
Figure 4
Figure 4. Creation of a chimeric DNA-sensing TLR9 that signals through TLR7-TIR signaling domain.
(A) Amino-acid sequences of the transmembrane-TIR junctions of TLR999, TLR777, and the TLR997 mutant. The TLR molecules are described based on the source of their 3 functional domains: endosomal domain–transmembrane domain–signaling TIR domain. (B) intracellular staining of TLR9 in FO, MZ, CD11c+CD11b+ ABCs, CD11b+, and CD11c+ B cells of 5–7-week-old Tlr9+/+, Tlr9+/–, or Tlr997 (all Tlr7–/Y) male MRL/lpr mice. Data points indicate individual mice (n = 6 per genotype and bars indicate the mean ± SEM of 2 pooled experiments, except for Tlr9+/+, n = 2 mice). (C) TLR9 endosomal localization in flow-sorted splenic CD21hi MZ (left column) and CD11c+CD11b+ ABC (right column) B cells of 6–7 week old Tlr9+/– or Tlr997 (all Tlr7–/–) female MRL/lpr mice was evaluated by confocal microscopy. Images were acquired at 1,000x magnification. Representative images of TLR9+ endosomes were made with 3D reconstruction (left panels). Colored spheres indicate LAMP1 and TLR9 spot counting generated from confocal images (right panels). The percentage of TLR9+ LAMP-1+ endosomes and the mean volume of the reconstructed TLR9 spots were measured using the Imaris software in Tlr9+/– or Tlr997 MZ and ABC B cells. (MZ B cells, Tlr9+/– n = 12 cells, Tlr997 n = 10 cells; ABC B cells, Tlr9+/– n = 20 cells, Tlr997 n = 11 cells, from 2 mice per genotype). (D) Splenocytes from 5–7-week-old Tlr9+/– Tlr7–/Y or Tlr997 Tlr7–/Y male MRL/lpr mice were stimulated with different doses of TLR9 agonist (CpG, μg/ml) for 120 min. Quantification of the NF-κB nuclear localization score in FO CD21int or MZ CD21hi B cells (upper and lower panels). Data points indicate the mean score quantified for n = 6 mice per genotype and bars indicate the SEM of 2 experiments pooled. *P < 0.05, **P < 0.01, ***P < 0.001, ****P < 0.0001. Data between the 2 genotypes were analyzed by multiple paired t test.
Figure 5
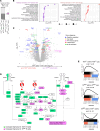
Figure 5. Differences in B cell signaling qualities driven by TLR999 or TLR997.
Transcriptome analysis of bead-purified B cells from 5-week-old Tlr9+/– Tlr7–/– or Tlr997 Tlr7–/– female MRL/lpr mice that were stimulated with TLR9 agonist (CpG, 10 μg/ml) for 4 hours. (A) Number of differentially expressed genes (DEGs) identified using the limma R package (log2 FC > 0.5, and FDR-corrected P value of < 0.05). (B) Bubble plots show the top 15 reactome pathways enriched in Tlr997 (purple bubbles) and Tlr9+/– (salmon bubbles) regulated genes from the Tlr997 (stim) vs Tlr9+/– (stim) comparison. Bubble size reflects the number of genes in the pathway that are also differentially expressed in Tlr997 vs Tlr9+/–. Enrichment was calculated using Fisher’s exact test (with all expressed genes as background) followed by Storey’s Q value FDR correction. (C) Volcano plot representing the DEGs between Tlr997 and Tlr9+/– CpG-stimulated B cells. The significant DEGs (log2 FC > 0.5) were annotated based on the reported functions of their corresponding proteins in B cell activation (green dots), cell death (yellow dots), TLR-mediated inflammation (red dots), negative regulation of TLR-mediated inflammation and/or B cell activation (blue dots), or if the genes were IFN-induced genes (pink dots). (D) Diagram depicting how proteins encoded by the curated DEGs in C could promote or regulate NF-κB, IRF, MAPK, IFN type 1 or 2 signaling pathways. In the cartoons of the chimeric TLR, TLR9-driven domains are in red and TLR7-derived domain in blue. (E) A TLR9-induced gene set signature for B cells of Tlr9+/+ BALB/c mice was generated. It comprises 1,724 upregulated genes (log2FC > 1 and FDR P value < 0.05) after a 4-hour in vitro CpG stimulation compared with unstimulated cells. Enrichment of this TLR9-induced gene set was assessed before and after TLR9 stimulation in Tlr9+/– B cells (left panel) and in Tlr997 (middle panel) B cells and between Tlr9+/– and Tlr997 stimulated B cells (right panel). The P value was calculated using the rankSumTestWithCorrelation function from the R limma package.
Figure 6
Figure 6. TLR997 and TLR999 differentially impact B cell differentiation and proliferation.
B cells from 5–7-week-old Tlr9+/– or Tlr997 (all Tlr7–/–) MRL/lpr mice were labeled with violet proliferation dye (VPD) and cultured for 1, 2, or 3 days with CpG (1 μg/ml). (A) Representative flow cytometry plots gated on live B cells. (B) Quantification of BLIMP1hiCD138+ plasmablasts (PB) among live B cells. One-way ANOVA with Sidak’s multiple comparisons test was used to compare both genotypes. (C) BLIMP1 MFI in live B cells. Symbols indicate individual mice and error bars represent SEM. An unpaired t test was used to compare both genotypes at day 1. (D) Percentage of live-dead dye positive (LD+) and LD+VPDlo cells (which correspond to post-proliferative dead cells). For panels EH, due to batch effects that led to differences in the overall B cell proliferation profiles, results from experiments 1 and 2 (shown in EH) and experiments 3 and 4 (shown in Supplemental Figure 3) were analyzed separately. (E) Percentage of live B cells that divided. (F) The FlowJo Proliferation Platform analysis was used to determine the division index. (G) Cell divisions were gated based on each proliferation peak of live B cells. Division 0 corresponds to undivided cells. Y-axis shows the percentage of total live B cells within each division number at day 3 (61). (H) The percentage of PB for each division number was plotted. For panels EH, symbols indicate mean and error bars are the SEM from n = 4 mice per genotype derived from 2 experiments. For E and F, 1-way ANOVA with Sidak’s multiple comparisons test was used. *P < 0.05, **P < 0.01, ***P < 0.001, ****P < 0.0001.
Figure 7
Figure 7. TLR997 exacerbates lupus disease.
18–21-week-old Tlr9+/+, Tlr9+/– or Tlr997/997 (referred to as Tlr997) (all Tlr7–/–) MRL/lpr mice were assessed for disease endpoints. Disease endpoints were also assessed in 18–20-week-old WT Tlr7+/+ and Tlr9+/+ MRL/lpr mice as a reference but were not included in the statistical analysis (B and C). (A) Schematic of the different mouse genotypes that are compared. (B) Spleen weights were measured in mice of the indicated gender and genotypes. (C) Kidney pathology was assessed in mice of the indicated gender and genotypes. (For B and C, female Tlr9+/+n = 17, Tlr9+/– n = 28, Tlr997 n = 22, Tlr9+/+ Tlr7+/+ n = 8; male Tlr9+/+n = 16, Tlr9+/– n = 24, Tlr997 n = 11, Tlr9+/+ Tlr7+/Y n = 2 or 3) (D) Splenic B cell subsets were assessed by flow cytometry in mice of the indicated genotypes. Percent of CD19+ cells among live splenocytes, and percent of CD23lo CD21hi MZ, CD11b+ CD11c+ ABCs and CD11b+ cells among live B cells (Tlr9+/+ n = 26, Tlr9+/– n = 36, Tlr997 n = 25). For all panels, data points indicate individual mice and bars indicate the mean ± SEM. For statistics, *P < 0.05, **P < 0.01, ****P < 0.001, ****P < 0.0001, 1-way ANOVA with Tukey’s multiple comparisons test.

Comment in

  • S-TIR-ring up TLR7 and TLR9: signaling domain substitutions clarify the TLR paradox

References

    1. Marshak-Rothstein A. Toll-like receptors in systemic autoimmune disease. Nat Rev Immunol. 2006;6(11):823–835. doi: 10.1038/nri1957. - DOI - PMC - PubMed
    1. Flesher DL, et al. Recent advances in the genetics of systemic lupus erythematosus. Expert Rev Clin Immunol. 2010;6(3):461–479. doi: 10.1586/eci.10.8. - DOI - PMC - PubMed
    1. Fairhurst AM, et al. Yaa autoimmune phenotypes are conferred by overexpression of TLR7. Eur J Immunol. 2008;38(7):1971–1978. doi: 10.1002/eji.200838138. - DOI - PMC - PubMed
    1. Brown GJ, et al. TLR7 gain-of-function genetic variation causes human lupus. Nature. 2022;605(7909):349–356. doi: 10.1038/s41586-022-04642-z. - DOI - PMC - PubMed
    1. Nickerson KM, et al. TLR9 regulates TLR7- and MyD88-dependent autoantibody production and disease in a murine model of lupus. J Immunol. 2010;184(4):1840–1848. doi: 10.4049/jimmunol.0902592. - DOI - PMC - PubMed

MeSH terms