. 2025 Aug 4;198(4):kiaf186.
doi: 10.1093/plphys/kiaf186.

Spatial proteomics reveals signal sequence characteristics correlated with localization in cyanobacteria

Affiliations

Spatial proteomics reveals signal sequence characteristics correlated with localization in cyanobacteria

Kelsey Dahlgren et al. Plant Physiol. .

Abstract

Cyanobacteria have an inner and outer cell membrane enclosing the periplasm and cell wall and an additional set of internal membranes (called the thylakoid membranes) enclosing the thylakoid lumen. The periplasm and thylakoid lumen have unique proteomes, but the mechanisms regulating protein sorting to these locations have remained elusive. Here, proximity-based proteomics using the engineered peroxidase APEX2 was performed in the cyanobacteria Synechococcus sp. PCC 7002 to profile the proteomes of the cytoplasm, thylakoid lumen, and the periplasm and outer membrane (P-OM). Our analyses revealed specific roles for the thylakoid lumen in photosynthesis and energy generation, as well as roles for the periplasm in metabolite transport and binding, cell motility, and cell wall maintenance. Forty proteins localized to both the thylakoid lumen and the P-OM; however, their biological functions remain unclear. We also analyzed the correlation between signal sequence characteristics and differential protein localization to either the thylakoid lumen or the P-OM. In PCC 7002, as well as Synechocystis sp. PCC 6803 and Nostoc sp. PCC 7120, thylakoid lumen proteins translocated across membranes via the Secretory (Sec) system possessed more hydrophobic and alpha-helical signal sequence H-regions than P-OM proteins. The signal sequences of homologous proteins in Gloeobacter violaceus PCC 7421, a cyanobacterial species with a combined thylakoid lumen and periplasmic space, did not exhibit such differences. Therefore, the pattern of increased H-region hydrophobicity and alpha helix content is specific to cyanobacteria with a separate thylakoid lumen space and likely contributes to proper protein sorting between the thylakoid lumen and periplasm.


Conflict of interest statement

Conflict of interest statement. None declared.

Figures
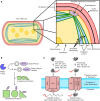
Figure 1.
Figure 1.
PCC 7002 cellular structure, protein translocation across membranes, and APEX2 labeling. A) A diagram of PCC 7002 cellular structure with an inset showing greater detail of the membrane structure. The hexagons in the cytoplasm are carboxysomes. The periplasmic space contains the cell wall and is bordered by the inner and outer cell membranes. The TMs enclose the thylakoid lumen. There may be transient membrane connections between the inner and TMs, which are shown in the inset. B) In the presence of BP and H2O2, APEX2 catalyzes a reaction creating a BP radical. The BP radical covalently labels endogenous proteins. C) The Sec pathway translocates unfolded proteins and the Tat pathway translocates folded proteins. The N-terminal signal peptide (shown as a thicker red line) is cleaved from the processed protein with a Type I, II, or III signal peptidase (SPI, SPII, and SPIII, respectively). The numbers in parenthesis represent the number of proteins in PCC 7002 predicted to utilize the translocation pathway (below membrane) or the signal peptide cleavage type in combination with the translocation pathway (above membrane) by SignalP 6.0.
Figure 2.
Figure 2.
Localization and labeling activity of APEX2 fusion proteins in strains used for proteomics. A) Diagram of the localization of APEX2 fusion proteins used to identify the proteome of the cytoplasm, thylakoid lumen, and periplasm. CpcB, PsbQ, and A1097 fusion proteins are membrane associated in the cytoplasm, thylakoid lumen, and periplasm, respectively. In contrast, GFP, A2695, and A1761 are soluble proteins in the cytoplasm, thylakoid lumen, and periplasm, respectively. B) Localization of GFP fusion proteins analogous to the APEX2 fusion proteins used to label proteomes for MS. GFP fluorescence is in the left column, chlorophyll fluorescence is in the middle column, and a merged image with both GFP and chlorophyll fluorescences is shown in the right column. The strain label is to the left of the images. All images have normalized lookup tables for the chlorophyll channel. Wild type (WT) PCC 7002, CpcB-GFP-V5, PsbQ-GFP-V5, A2695-GFP-V5, and A1097-GFP-V5 have a normalized lookup table for GFP. GFP-V5, GFP-APEX2-V5, and A1761-GFP-V5 lookup tables were set with a higher maximum to better visualize protein localization. Scale bars are 2 µm. Biotinylation patterns of APEX2 localized in different membrane-bound compartments are shown on an C) antibiotin blot or D) silver stain. The ladder with molecular weights in kDa is the far left lane. The next 7 lanes show biotinylation patterns present in cell lysate after APEX2-dependent biotinylation. The 7 lanes on the right are biotinylation patterns of purified biotinylated proteins from the cell lysate eluted from streptavidin beads. The cellular localization of the protein constructs is labeled on the bottom of the gel.
Figure 3.
Figure 3.
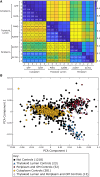
Proteins within the same membrane-bound compartment cluster together. A) A heatmap displays Pearson correlation coefficients calculated between samples submitted to MS using normalized MS values. The key for the heatmap is on the right of the table. The bottom left half of the heatmap shows the correlation coefficients. The replicate number, protein fused to APEX2 for targeting, and the localization of the APEX2 fusion proteins are listed on the bottom and left of the heatmap. B) A principal component analysis (PCA) plot displays clustering between control proteins with known cellular localizations. Log-transformed normalized MS values for all 1,687 proteins identified by MS were used to make the PCA plot. Different groups of control proteins are shown in different colors and shapes, with the key below the PCA plot.
Figure 4.
Figure 4.
Thylakoid lumen proteome analysis. A) Distribution of average enrichment value (log2 [lumen/cytoplasm]) for all proteins (n = 1,687) and control proteins with known localizations in the thylakoid lumen (n = 36) and cytoplasm (n = 381). Size of the violins is normalized by the number of samples in each category. B) Distribution of average enrichment values (log2 [lumen/cytoplasm]) for proteins (n = 1,687) localized to the thylakoid lumen (n = 105) and cytoplasm (n = 1400), as well as proteins that were unable to be confidently localized in this analysis (Unknown) (n = 182). Size of the violins is normalized by the number of samples in each category. C) An infographic of the protein localizations determined in the analysis of the thylakoid lumen proteome. D) The functional categories of proteins localized to the thylakoid lumen proteome in this analysis.
Figure 5.
Figure 5.
P-OM analysis. A) A violin plot showing distribution of average enrichment value (log2 [periplasm/cytoplasm]) for all proteins (n = 1,687) and control proteins with known localizations in the P-OM (n = 65) and cytoplasm (n = 381). Size of the violins is normalized by the number of samples in each category. B) A violin plot showing distribution of average enrichment values (log2 [periplasm/cytoplasm]) for proteins (n = 1,687) localized to the P-OM (n = 163), cytoplasm (n = 1180), as well as proteins that were unable to be localized in this analysis (Unknown) (n = 344). Size of the violins is normalized by the number of samples in each category. C) An infographic of the protein localizations determined in the analysis of the P-OM proteome. D) The functional categories of proteins localized to the P-OM proteome in this analysis.
Figure 6.
Figure 6.
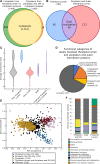
Dually localized proteins were identified using proteomics of specific cellular regions. A) A Venn diagram of the proteins with a final localization in the cytoplasm after analysis of the thylakoid lumen and the P-OM proteomes. B) A Venn diagram of protein dually localized to both the thylakoid lumen and the P-OM proteomes. C) A violin plot of the distribution of the average enrichment (log2 [thylakoid lumen/periplasm]) for the proteins (n = 228) in only the thylakoid lumen (n = 65), only the P-OM (n = 123), and both the thylakoid lumen and P-OM (n = 40) proteomes. The distribution of average enrichment scores for proteins that acted as controls for both the thylakoid lumen and P-OM analyses (n = 13) are on the far right. Size of the violins is normalized by the number of samples in each category. D) A pie chart of the functional categories of proteins dually localized to the thylakoid lumen and the P-OM. E) A PCA plot showing clusters of proteins that were identified as localized to the cytoplasm, thylakoid lumen, P-OM, and both the thylakoid lumen and P-OM and proteins that were unable to be confidently localized in this study. The key is below the plot. F) A bar chart showing the relative abundance of the functional categories of proteins identified in the thylakoid lumen (n = 105), P-OM (n = 163), and dually localized proteins (n = 40).
Figure 7.
Figure 7.
Sec-translocated signal sequence characteristics correlated with localization in cyanobacteria. A) Summary of signal sequence structures predicted by SignalP 6.0. B) Summary of the cyanobacteria cell architecture, TM characteristics, and signal sequences used in the analysis. TL only were thylakoid lumen proteins that were not localized to the P-OM in PCC 7002. P-OM only were proteins localized to the P-OM, but not the thylakoid lumen in PCC 7002. Dual localization proteins were localized to the thylakoid lumen and P-OM in PCC 7002. For the other species of cyanobacteria, the signal sequences used for analysis are signal sequences from best reciprocal BLAST homologs of proteins identified in the thylakoid lumen proteome and/or the P-OM proteome of PCC 7002 in this study. C and D) Tukey boxplots of H-region characteristics of signal sequences in different cellular localizations in different species. The center line represents the median, the box limits represent the upper (25th percentile) and lower (75th percentile) quartiles, outliers are >1.5 × the difference between the upper and lower quartiles, also known as the interquartile range, away from their nearest quartile, and the whiskers represent either (i) the minimum or maximum observed value when there are no outliers or (ii) the outlier limit (distance of 1.5 × the interquartile range away from the nearest quartile). Localization is listed on the x axis, and different species are in different colors (key in 7B) with the order in each localization cluster (All, dual localization, P-OM only, and thylakoid lumen only) from left to right as follows: PCC 7002, PCC 6803, PCC 7120, and PCC 7421. The sample size represented by each box and whisker plot is listed in B). Significant differences (P < 0.05) between specific localizations within a species are marked by *. C) Displays characteristics for SP signal sequences or signal sequences predicted to be translocated across the membrane using Sec machinery and cleaved by SPI. D) Displays characteristics for LIPO signal sequences or signal sequences predicted to be translocated across the membrane using Sec machinery and cleaved by SPII.

References

    1. Agarwal R, Matros A, Melzer M, Mock H-P, Sainis JK. Heterogeneity in thylakoid membrane proteome of Synechocystis 6803. J Proteom. 2010:73(5):976–991. 10.1016/j.jprot.2009.12.011 - DOI - PubMed
    1. Aldridge C, Spence E, Kirkilionis MA, Frigerio L, Robinson C. Tat-dependent targeting of Rieske iron-sulphur proteins to both the plasma and thylakoid membranes in the cyanobacterium Synechocystis PCC6803. Mol Microbiol. 2008:70(1):140–150. 10.1111/j.1365-2958.2008.06401.x - DOI - PubMed
    1. Almagro Armenteros JJ, Tsirigos KD, Sønderby CK, Petersen TN, Winther O, Brunak S, von Heijne G, Nielsen H. Signalp 5.0 improves signal peptide predictions using deep neural networks. Nat Biotechnol. 2019:37(4):420–423. 10.1038/s41587-019-0036-z - DOI - PubMed
    1. Baers LL, Breckels LM, Mills LA, Gatto L, Deery MJ, Stevens TJ, Howe CJ, Lilley KS, Lea-Smith DJ. Proteome mapping of a cyanobacterium reveals distinct compartment organization and cell-dispersed metabolism. Plant Physiol. 2019:181(4):1721–1738. 10.1104/pp.19.00897 - DOI - PMC - PubMed
    1. Boehm M, Nield J, Zhang P, Aro E-M, Komenda J, Nixon PJ. Structural and mutational analysis of band 7 proteins in the cyanobacterium Synechocystis sp. strain PCC 6803. J Bacteriol. 2009:191(20):6425–6435. 10.1128/JB.00644-09 - DOI - PMC - PubMed

LinkOut - more resources