. 2025 Aug 2;41(8):btaf440.
doi: 10.1093/bioinformatics/btaf440.

StrainR2 accurately deconvolutes strain-level abundances in synthetic microbial communities

Affiliations

StrainR2 accurately deconvolutes strain-level abundances in synthetic microbial communities

Kerim Heber et al. Bioinformatics. .

Abstract

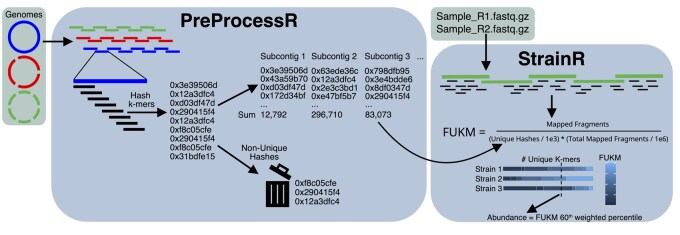
Motivation: Synthetic microbial communities offer an opportunity to conduct reductionist research in tractable model systems. However, deriving abundances of highly related strains within these communities is currently unreliable. 16S rRNA gene sequencing does not resolve abundance at the strain level and other methods such as quantitative polymerase chain reaction (qPCR) scale poorly and are resource prohibitive for complex communities. We present StrainR2, which utilizes shotgun metagenomic sequencing to provide high accuracy strain-level abundances for all members of a synthetic community, provided their genomes.

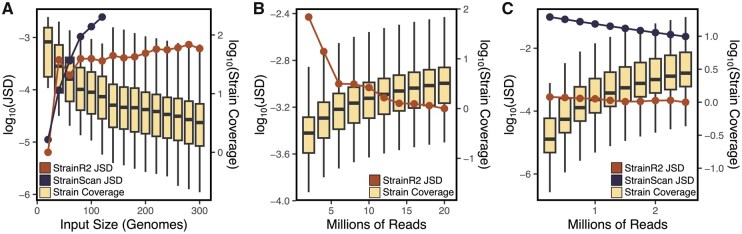
Results: Both in silico, and using sequencing data derived from gnotobiotic mice colonized with a synthetic fecal microbiota, StrainR2 resolves strain abundances with greater accuracy and efficiency than other tools utilizing shotgun metagenomic sequencing reads. We demonstrate that StrainR2's accuracy is comparable to that of qPCR on a subset of strains resolved using absolute quantification.

Availability and implementation: Software is available at GitHub and implemented in C, R, and Bash. Software is supported on Linux and MacOS, with packages available on Bioconda or as a Docker container. The source code at the time of publication is also available on figshare at the doi: 10.6084/m9.figshare.29420780.


Figures

Figure 1.
Figure 1.
Schematic of the StrainR2 workflow. In the PreProcessR module, genomes are split into subcontigs no larger than the smallest N50 in the set of genomes ensuring consistent assembly qualities. The number of unique k-mers (which are computed as hashes for efficiency) is used in the StrainR module to normalize FPKM in a metric normalized for genome uniqueness (FUKM). A user-configurable weighted percentile of all subcontig FUKMs belonging to a genome is used as a point estimate of abundance.
Figure 2.
Figure 2.
StrainR2 normalization corrects quantitative errors resulting from variable strain-relatedness. Dendrograms of strain similarities are shown for (A) sFMT1+Cs members and (B) 22 E. lenta strains. Reads were generated in silico such that all community members have a uniform abundance. StrainR2 resolves abundances much closer to the uniform abundance than by measuring FPKM. FPKM values for E. lenta strains were less accurate than with the sFMT1+Cs community due to an increased bias toward unique community members. StrainR2-calculated wpFUKM had a coefficient of variation of 1.69% for the sFMT1+Cs strains and 3.93% for the E. lenta strains despite the high strain similarity, whereas when using FPKM, the coefficient of variation was 17.44% and 86.82% for the communities, respectively. Dendrograms are based on Jaccard Similarity of k-mer profiles between strains.
Figure 3.
Figure 3.
StrainR2 provides accurate strain abundances across varied community compositions. (A) Jensen–Shannon divergence between true community composition and estimated abundance are minimized by StrainR2 compared to other methods. Reads were generated in silico across multiple community compositions and distributions (Fig. 2, available as supplementary data at Bioinformatics online). (B) Scatterplots for the correlation between estimated abundances and true community compositions are shown for all mock community distributions in sFMT1+Cs and E. lenta strains. Inset values represent the Pearson correlation for each tool based on log10 transformed data with values of -Inf substituted for the minimum finite value minus 1. The uniform and missing distributions are omitted as most or all strains have the same true abundance and render the scatterplots non-informative. (C) A frequency plot of the fold-change from the true abundance shows that StrainR2 rarely predicts an abundance far from the true abundance. Data shown is the sum of all six mock community distributions both for sFMT1+Cs and E. lenta strains.
Figure 4.
Figure 4.
StrainR2 scales and maintains accuracy on larger inputs and smaller read depths. Accuracy, as measured through Jensen–Shannon Divergence from the true abundance, is maintained through: (A) various community sizes at 20 million reads, (B) various read depths for a 300-membered community, and (C) various read depths for the sFMT1+Cs community. StrainScan was unable to operate on the 300-membered community due to excessive memory needs and as such is not plotted in B. Coverage is also shown to demonstrate the effect of varying community size or read depth. When generating reads, the coverages for strains were drawn from a log-normal distribution.
Figure 5.
Figure 5.
StrainR2 uses fewer system resources while scaling linearly. Run times for database generation for (A) 200 random genomes and (B) E. lenta strains show StrainR2 following a linear growth. StrainR2’s final run times were 3 min and 50 s, and 32 s, respectively, at maximum community complexity for random genomes and E. lenta, respectively. Memory usage for (C) the 200 genome input and (D) the E. lenta community again shows StrainR2 using the least resources, with final memory usages of 16.8 and 1.4 GB, respectively.
Figure 6.
Figure 6.
StrainR2 accurately recovers abundances measured by qPCR. Abundance predictions for qPCR as compared to (A) StrainR2, (B) StrainScan, (C) FPKM, and (D) Ninjamap. All abundances are the fold-change from the geometric mean of strain abundances within a sample and are shown on a logarithmic scale (i.e. centered log ratio). (E) Pearson correlations for each strain’s abundances versus qPCR via differing tools. Pearson correlations for all samples/strains in panels A, B, C, and D are R2 = 0.9432, R2 = 0.9501, R2 = 0.3559, and R2 = 0.3139, respectively. Each point represents the quantification of a single strain in a single animal with linear regressions drawn on a per-strain basis.

Update of

References

    1. Aggarwala V, Mogno I, Li Z et al. Precise quantification of bacterial strains after fecal microbiota transplantation delineates long-term engraftment and explains outcomes. Nat Microbiol 2021;6:1309–18. - PMC - PubMed
    1. Aguilar-Salinas B, Olmedo-Álvarez G. A three-species synthetic community model whose rapid response to antagonism allows the study of higher-order dynamics and emergent properties in minutes. Front Microbiol 2023;14:1057883. - PMC - PubMed
    1. Anderson BD, Bisanz JE. Challenges and opportunities of strain diversity in gut microbiome research. Front Microbiol 2023;14:1117122. - PMC - PubMed
    1. Atarashi K, Tanoue T, Oshima K et al. Treg induction by a rationally selected mixture of Clostridia strains from the human microbiota. Nature 2013;500:232–6. - PubMed
    1. Atarashi K, Tanoue T, Shima T et al. Induction of colonic regulatory T cells by indigenous Clostridium species. Science 2011;331:337–41. - PMC - PubMed

Substances