. 2025 Aug 7:S0092-8674(25)00811-6.
doi: 10.1016/j.cell.2025.07.021. Online ahead of print.

Principles of cotranslational mitochondrial protein import

Affiliations

Principles of cotranslational mitochondrial protein import

Zikun Zhu et al. Cell. .

Abstract

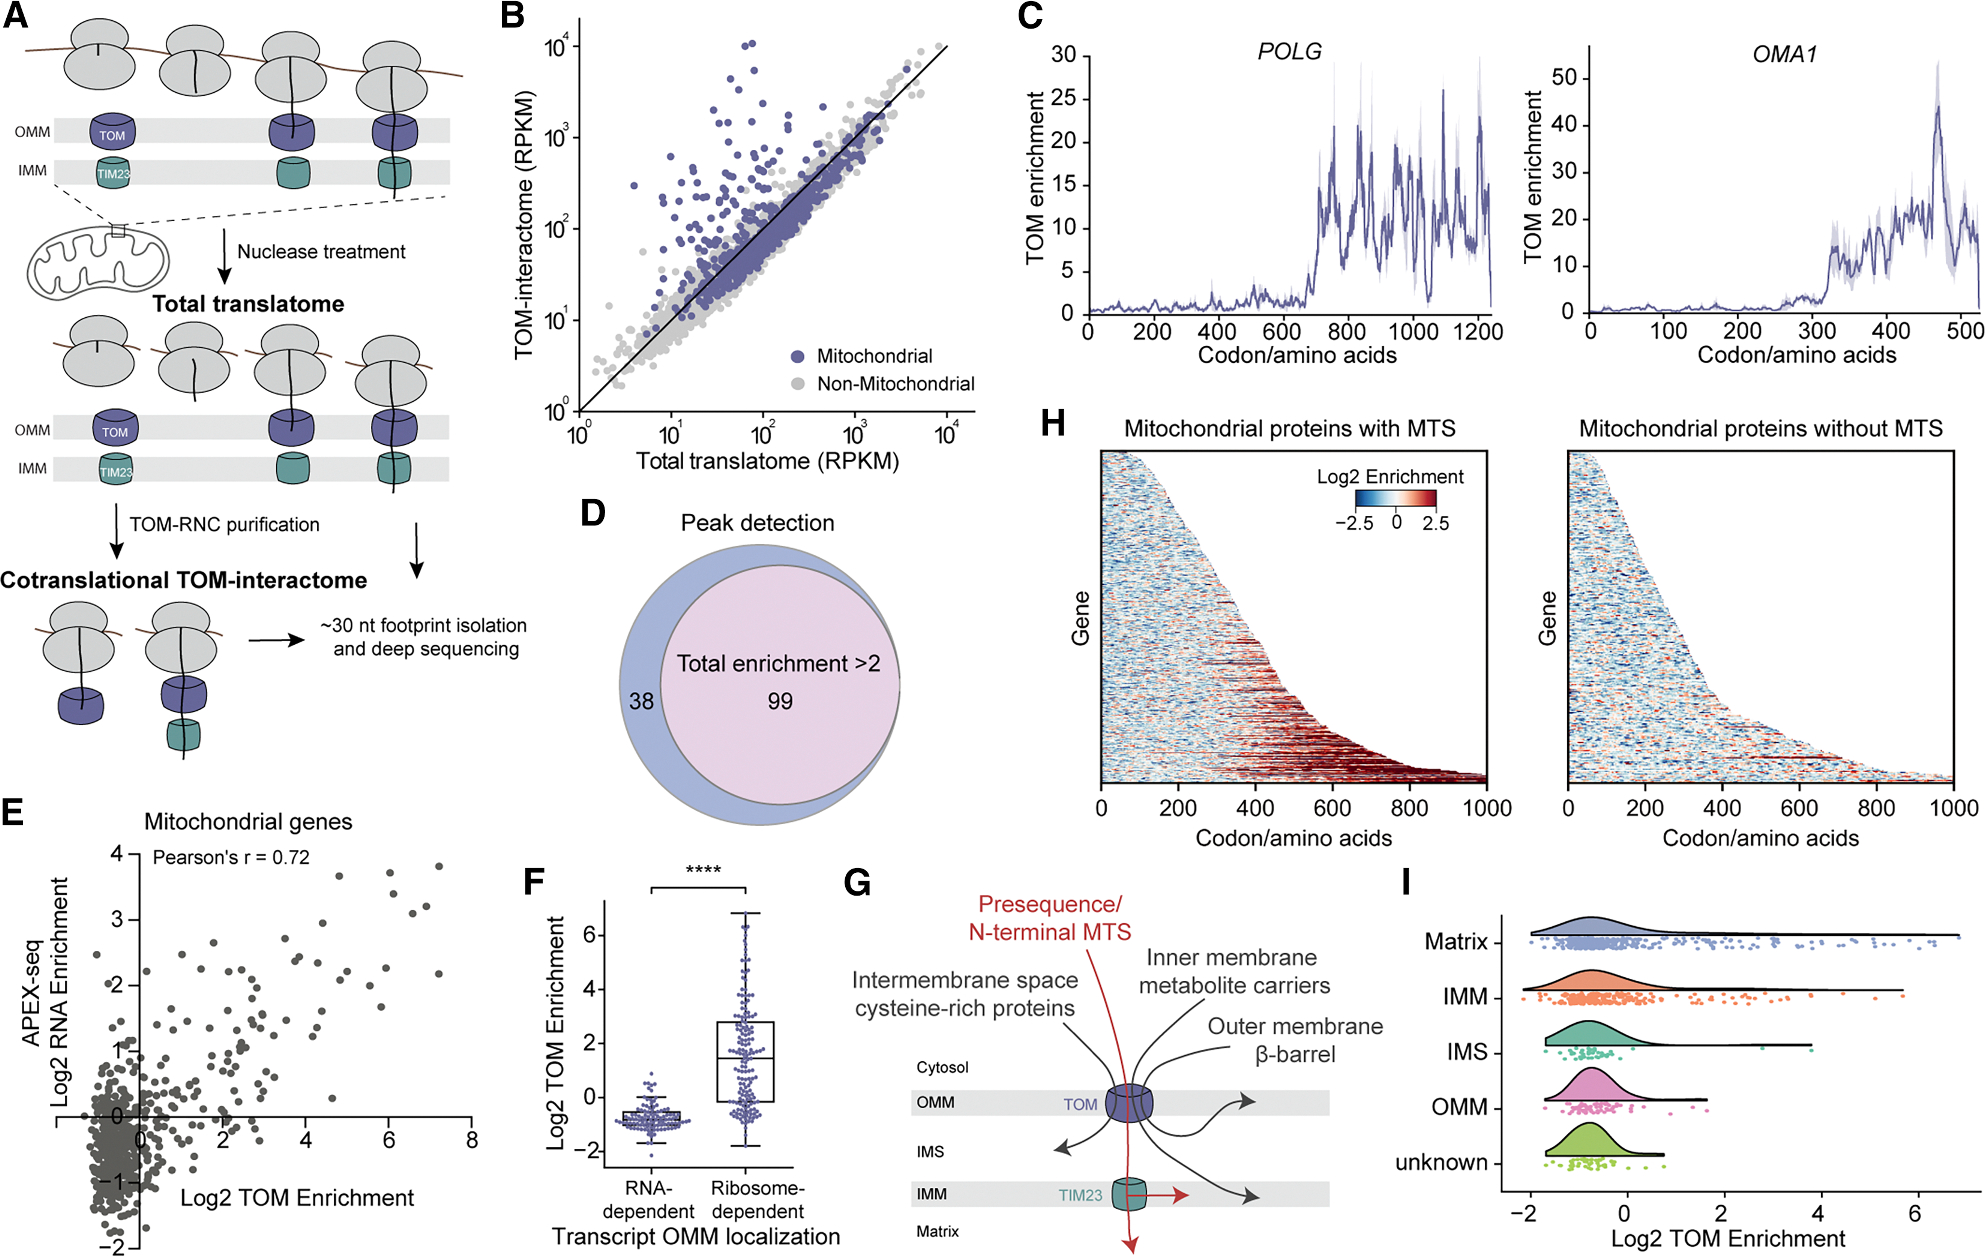
Nearly all mitochondrial proteins are translated on cytosolic ribosomes. How these proteins are subsequently delivered to mitochondria remains poorly understood. Using selective ribosome profiling, we show that nearly 20% of mitochondrial proteins can be imported cotranslationally in human cells. Cotranslational import requires an N-terminal presequence on the nascent protein and contributes to localized translation at the mitochondrial surface. This pathway does not favor membrane proteins but instead prioritizes large, multi-domain, topologically complex proteins, whose import efficiency is enhanced when targeted cotranslationally. In contrast to the early onset of cotranslational protein targeting to the endoplasmic reticulum (ER), the presequence on mitochondrial proteins is inhibited from initiating targeting early during translation until a large globular domain emerges from the ribosome. Our findings reveal a multi-layered protein sorting strategy that controls the timing and specificity of mitochondrial protein targeting.

Keywords: NAC; TOM complex; cotranslational protein import; localized translation; mitochondria; mitochondrial targeting sequence; nascent polypeptide-associated complex; protein folding; protein targeting; ribosome profiling.


Conflict of interest statement

Declaration of interests Authors declare no competing interests.

Figures

Figure 1.
Figure 1.. SeRP of the TOM complex reveals cotranslationally imported mitochondrial proteins
(A) Schematic of SeRP of the TOM complex. (B) Comparison of the translatome and TOM-interactome footprint density of confidently detected genes. RPKM, reads per kilobase per million reads. (C) Representative TOM interaction profiles of mitochondrial proteins. Solid lines show the mean, and shades show the range of data from two biological replicates. POLG, DNA polymerase subunit gamma-1; OMA1, metalloendopeptidase OMA1. (D) Venn diagrams showing the overlap of cotranslational TOM-interactome detected by the two methods. (E) Correlation between gene-level TOM enrichment from this study and the RNA enrichment from APEX-seq study for all mitochondrial genes. (F) Comparison of the TOM enrichment between mitochondrial genes whose mRNAs are localized to mitochondria in an RNA- or ribosome-dependent manner. ****, p < 0.0001. (G) Scheme showing the four major pathways for protein import through the TOM complex. (H) Codon-resolution heatmap of log2 TOM enrichment for all detected mitochondrial proteins. Proteins are categorized by the presence of presequence and sorted by length. (I) Raincloud plot of the distribution of TOM enrichment for proteins in different mitochondrial subcompartments. See also Figure S1 and Tables S1, S2, and S4.
Figure 2.
Figure 2.. Role of cotranslational mitochondrial protein targeting
(A) TOM enrichment of IMM proteins with and without TMDs. ns, not significant (p > 0.05). (B) Codon-resolution heatmap of log2 TOM enrichment for four families of metabolite carrier proteins (mitochondrial pyruvate carrier [MPC], sideroflexin, SLC25A, and mitochondrial ABCB transporters). (C) Two-dimensional histogram of mitochondrial proteins binned by log2 TOM enrichment and protein length. (D) Receiver operator characteristic (ROC) curves from a supervised random-forest classifier that predicts whether a mitochondrial protein utilizes a co- or post-translational targeting pathway. The presence of an N-terminal MTS and protein length were used as the parameters to train the model. The solid line shows the mean performance, and the shaded area shows the range of data from 10-fold cross-validation. (E) Absolute contact order analysis of all mitochondrial proteins. ****, p < 0.0001. (F) The fraction of cotranslational TOM substrates among mitochondrial proteins, grouped by the number of domains identified in each protein. (G) Left, TOM interaction profile of NDUFS2 (NADH dehydrogenase [ubiquinone] iron-sulfur protein 2), a mitochondrial matrix protein. The solid line shows the mean values, and the shaded area shows the range of data from two biological replicates. Right, in vitro mitochondrial import of NDUFS2 and OMP25 (synaptojanin-2-binding protein). 35S-methionine-labeled precursor proteins were translated in rabbit reticulocyte lysate, and purified human mitochondria were added either immediately after translation initiation (co-) or after 40 min of translation followed by CHX addition to stop protein synthesis (post-). Import is assessed by proteinase K (PK) protection and analyzed by SDS-PAGE and autoradiography. See also Figure S1 and Table S2.
Figure 3.
Figure 3.. Cotranslational protein targeting to mitochondria occurs late and independently of NAC
(A) Metagene total translatome and TOM-interactome profiles of all mitochondrial genes aligned to the start codon. (B) Distribution of the onset of TOM interaction during translation. (C) Scheme depicting the incompatibility of co-co interaction with protein import into mitochondria. (D) Venn diagrams showing the overlap of cotranslational TOM substrates with mitochondrial proteins displaying co-co interactions. (E) TOM interaction and co-co interaction (measured by the disome/monosome ratio) profiles of representative cotranslational TOM substrates. ABCB7, iron-sulfur clusters transporter ABCB7; ELAC2, zinc phosphodiesterase ELAC protein 2. (F) Metagene TOM enrichment and co-co interaction profiles of all cotranslational TOM substrates, aligned to the onset of TOM interaction peaks. (G) Western blot showing the depletion of NACα (upper) and NACβ (lower) in NACα-AID and NACβ-AID cell lines, respectively, upon auxin addition. (H) Correlation of gene-level TOM enrichment for all mitochondrial genes without and with a 4.5-h auxin treatment in NACβ-AID cells. (I) Representative TOM interaction profile of a mitochondrial gene before and after auxin addition (4.5 h) in NACβ-AID cells. METTL17, ribosome assembly protein METTL17. (J) Heatmap of log2 TOM enrichment at each codon for cotranslational TOM substrates after a 4.5-h auxin treatment in NACβ-AID cells. Proteins are aligned to the onset of TOM interaction in WT cells and sorted by the distance from the onset to the stop codon. In A, E, F, and I, solid lines show the mean, and shaded areas show the 95% confidence interval (A and F) or the range of data from two biological replicates (E and I). See also Figure S2.
Figure 4.
Figure 4.. Cotranslational mitochondrial import initiates upon the exposure of a complex globular protein fold
(A) Comparison of the TOM interaction profile of WT COQ3 and COQ3-repeat, which contains a tandem repeat of residues 94–138 (a helix-turn-helix motif, labeled as α) in WT COQ3. The schemes above depict the presequence as open bars and mature protein regions as solid bars. Proteins are aligned to the start codon (left) or by consensus sequence (right). (B) Comparison of the TOM interaction profile of COQ8A and COQ8B. The schemes above depict the unstructured protein regions as open bars and the conserved structured regions as solid bars. Proteins are aligned to the start codon (left) or to the N terminus of their conserved regions (right). (C) Proteins are grouped by shared domains and aligned to the onset of TOM interaction, with the shared domain in each group in orange, additional domains that have initiated translation at the onset of import in yellow, and the remainder of the protein in gray. Residues to the left of the purple shaded area, which indicates the ~35 aa in the ribosome exit tunnel, are exposed at the onset of TOM interaction. (D) TOM enrichment profiles (left) and AlphaFold-predicted structures (right) of representative proteins from each group in C (marked by “*”). The exposed regions at the onset of TOM engagement are in orange and the onset of TOM interaction is marked by a blue arrow in the structural models. The unstructured MTS was not shown for clarity. FPGS, folylpolyglutamate synthase; ETFDH, electron transfer flavoprotein-ubiquinone oxidoreductase; ALDH5A1, succinate-semialdehyde dehydrogenase. (E and F) TOM enrichment profiles of DLAT (E) and domain-reordered DLAT (F). The unstructured protein regions and domains I–IV of DLAT are color-indicated in the schemes and AlphaFold-predicted structural model above. DLAT: dihydrolipoyllysine-residue acetyltransferase component of pyruvate dehydrogenase complex. (G) Cotranslational engagement of MDH2-fusion proteins with the TOM complex analyzed by qPCR. The indicated protein fragments were inserted between the MTS and mature domain of MDH2. AlphaFold-predicted structures of the inserted fragments are shown below. MDH2, malate dehydrogenase. Data are shown as mean ± standard error, with n = 3. ns, p > 0.05; ***, p < 0.001. (H) Comparison of the TOM interaction profiles of WT MDH2 and MDH2 inserted with ALDH5A1 domain I. Proteins are aligned by consensus amino acid sequence. In A, B, D–F, and H, solid lines show the mean values, and shaded areas show the range of data from two biological replicates. (I) Model of cotranslational protein import into mitochondria. Gray shades depict inhibitory interactions that shield the N-terminal MTS at early stages of translation. These interactions are removed at a later stage, either via protein release from the ribosome (upper pathway) or upon the emergence of a large protein domain (lower pathway), to initiate mitochondrial protein import. See also Figures S3 and S4 and Table S3.

References

    1. Pfanner N, Warscheid B, and Wiedemann N (2019). Mitochondrial proteins: from biogenesis to functional networks. Nat. Rev. Mol. Cell Biol. 20, 267–284. 10.1038/s41580-018-0092-0. - DOI - PMC - PubMed
    1. Becker T, Song J, and Pfanner N (2019). Versatility of Preprotein Transfer from the Cytosol to Mitochondria. Trends Cell Biol. 29, 534–548. 10.1016/j.tcb.2019.03.007. - DOI - PubMed
    1. Bykov YS, Rapaport D, Herrmann JM, and Schuldiner M (2020). Cytosolic Events in the Biogenesis of Mitochondrial Proteins. Trends Biochem. Sci. 45, 650–667. 10.1016/j.tibs.2020.04.001. - DOI - PubMed
    1. Busch JD, Fielden LF, Pfanner N, and Wiedemann N (2023). Mitochondrial protein transport: Versatility of translocases and mechanisms. Mol. Cell 83, 890–910. 10.1016/j.molcel.2023.02.020. - DOI - PubMed
    1. Wiedemann N, and Pfanner N (2017). Mitochondrial Machineries for Protein Import and Assembly. Annu. Rev. Biochem. 86, 685–714. 10.1146/annurev-biochem-060815-014352. - DOI - PubMed

LinkOut - more resources