. 2025 Aug 11;53(15):gkaf762.
doi: 10.1093/nar/gkaf762.

The Influence of CG sites on dynamic DNA sequence mutagenesis in the genomic evolution of mammalian lifespan

Affiliations

The Influence of CG sites on dynamic DNA sequence mutagenesis in the genomic evolution of mammalian lifespan

Steven S Smith. Nucleic Acids Res. .

Abstract

Previous work showed that natural selection has acted to minimize the genomic frequencies of representative dynamic DNA sequences capable of forming G-quadruplex, Triplex, hairpin, and i-motif structures in long-lived mammals, thus diminishing the mutagenic potential of their genomes. This report extends findings with single sequences to broadly distributed G3-4N1-7G3-4N1-7G3-4N1-7G3-4 dynamic sequence motifs and identifies a second, previously unknown, pool of dynamic DNA sequences that escape negative selective pressure as a function of lifespan. This pool is distinguished from those studied previously by the presence of one or more CG sites, suggesting that they are subject to structural suppression DNA methylation in mammals. Consistent with the known effects of DNA damage on methylation patterns, the frequencies of dynamic sequences that lack CG sites were found to track species-specific mutation rate and species-specific methylation rates in 126 genomes representing 26 mammalian orders. The results suggest that DNA methylation itself and perhaps methylated DNA binding proteins also function in the suppression of the mutagenic potential of dynamic sequences containing CG sites, and that this latent pool of mutagenic potential is released during the mutation induced decay of DNA methylation patterns linked to the inborn level of dynamic sequences lacking CG sites.


Conflict of interest statement

The author has no conflicts to interest to disclose.

Figures

Graphical Abstract
Graphical Abstract
Figure 1.
Figure 1.
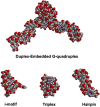
Duplex-embedded G-quadruplex: The model clearly reveals the nature of a G-quadruplex replication impediment. Here the G-quadruplex forms a core, and the second (unpaired) strand wraps around it to form a knot-like structure that can impede replication in either direction, image from PDB ID 8DUT [50]. Similar knot-like structures are expected for the i-motif: image from of PDB ID 1A83 [51], Triplex: image from the PDB ID 149D [52] and Hairpin: Image from PDB ID 1NGU [53].
Figure 2.
Figure 2.
Correlation between the average frequency of a set of six dynamic sequences and lifespan. (A) Average frequency of the six sequences listed in Table 1 for the 126 representative mammalian genomes. Non-linear curve fitting to the data (Solid line) yielded a fit to the data of the form Y = a/X+ b (Y= 5.39 × 10−5  /X+ 4.297 × 10−6). The P value for a was significant at 2.13 × 10−14 as was the P value for b at 3.959 × 10−11. The R2 value for the fit was 0.717. (B) Log-Log Plot of the data in A. Linear curve fitting to the Log-Log plot (Solid line) gave a fit of Y = mX + b (Y= -0.534X -4.509). The P value was significant at 4.35 × 10−16. The R2 value for the fit was 0.414. Borders indicate the 95% mean parameter confidence interval.
Figure 3.
Figure 3.
Species-specific average dynamic sequence frequency scales with published species-specific mutation rates. (A). Data replotted from [86] showing that species-specific mutation rates scale with maximum lifespan. Non-linear curve fitting to the data (solid line) yielded a fit to the data of the form Y = a/X (Y= 2439.47/X). The P value was significant at 1.36 × 10−8. The R2 value for the fit was 0.9065. Lifespan values are those from the Species 360/Human Mortality Database used in [86]. Borders indicate the 95% mean parameter confidence interval. (B). Average dynamic sequence frequency versus maximum lifespan for each species. In this panel, the average dynamic sequence frequencies for the set of sequences described in Table 1 were determined on genomes from the Ensembl FTP site cited in [86]. The frequencies were normalized to value obtained for the reference Species: Mus Musculus. Non-linear curve fitting to the data (solid line) yielded a fit to the data of the form Y = a/X (Y= 8.16 × 10−5  /X). The P values was significant 1.47 × 10−8. The R2 value for the fit was 0.9055. Borders indicate the 95% mean parameter confidence interval. (C). Relative mutation rate versus relative dynamic sequence frequency for each species. In this panel, dynamic sequence frequencies were determined on genomes from the Ensembl FTP site cited in [86]. Linear curve fitting to the data (solid line) yields a linear function Y = mX + b (Y= 23.404X+ 65.548) for the predicted mean values with an R2 value of 0.699 and a P-value of 1.02 × 10−4 for the model parameter. Borders indicate the 95% mean parameter confidence interval. Normalized to reference species: Mus Musculus. (D). Relative mutation rate and dynamic sequence frequency superimposed for each species versus maximum lifespan. In this panel, dynamic sequence frequencies were determined on genomes from the Ensembl FTP site cited in [86] and overlaid on the plot given in A above. Non-linear curve fitting to the data (solid line) yielded a fit to the data of the form Y = a/X (Y= 3.199/X). The P value was significant at 2.56 × 10−16. The R2 value for the fit was 0.904. Borders indicate the 95% mean parameter confidence interval. Normalized to reference species: Mus Musculus.
Figure 4.
Figure 4.
Species-specific DNA methylation rates and species-specific average dynamic DNA sequence frequencies scale with maximum lifespan. (A) Species specific blood DNA methylation rates and maximum lifespan replotted from [87]. Non-linear curve fitting to the published data [87] (solid line) yielded a fit to the data of the form Y = a/X (Y= 4.124/X). The P value was significant at 3.68 × 10−15. The R2 value for the fit was 0.911. Maximum lifespan values are those given in [87]. Borders indicate the 95% mean parameter confidence interval. (B) Species-specific average dynamic sequence frequency and maximum lifespan. Genomes searched were from the same species used for blood specimens in [87]. Frequencies shown are averages of the six sequences described in Table 1. Frequency values were normalized to the value obtained for the reference species Rattus rattus. Nonlinear curve fitting to the published data [87] (solid line) yielded a fit to the data of the form Y = a/X (Y= 3.352/X). The P value was significant at 3.74 × 10−16. The R2 value for the fit was 0.933. Maximum lifespan values are those given in [87]. Borders indicate the 95% mean parameter confidence interval. (C) Superposition of species-specific methylation rates (from A above) and average dynamic sequence frequencies (from B above) against maximum lifespan. Non-linear curve fitting to the superimposed data (solidline) yielded a fit to the data of the form Y = a/X (Y= 3.740/X). The P value was significant at 8.424 × 10−29. The R2 value for the fit was 0.910. Maximum lifespan values are those given in [87]. Borders indicate the 95% mean parameter confidence interval. (D) Log-log plot of the superposition of species-specific methylation rates (from A above) and average dynamic sequence frequencies (from B above) against maximum lifespan. Non-linear curve fitting to the superimposed data (solid line) yielded a fit to the data of the form Y = mX + b (Y=-0.819X + 0.389). The P value was significant at 4.970 × 10−13. The R2 value for the fit was 0.644. Maximum lifespan values are those given in [87]. Borders indicate the 95% mean parameter confidence interval.
Figure 5.
Figure 5.
Correlation between G3-4N1−7G3-4N1−7G3-4N1−7G3-4 Dynamic motif frequency and CG frequency. (A) Data for the 126 representative mammalian genomes studied shows an upward trend in CG frequency with lifespan. Non-linear curve fitting to the data gave a fit in the form Y=-a/X + b (Y=-0.010/X + 0.0114), where Y is CG frequency and X is maximum lifespan (solid line). The P value for a at 1.77 × 10−4 was significant as was the Pvalue for b at 1.32 × 10−70. The R2 value for the hyperbolic fit was 0.946. Borders indicate the 95% mean parameter confidence interval. (B) Data for the 126 representative mammalian genomes studied detected an upward trend in CG frequency with increasing G3-4N1−7G3-4N1−7G3-4N1−7G3-4 motif frequency. Linear curve fitting to the data gave a fit in the form Y = mX + b (Y= 24.4104X + 6.03 × 10−3), where Y is the CG frequency and X is dynamic sequence motif frequency (solid line). The P value was significant at 2.48 × 10−14. The R2 value for the power law fit was 0.373. Borders indicate the 95% mean parameter confidence interval.
Figure 6.
Figure 6.
Comparison of the TGG6 and CCG6 dynamic sequence frequencies. (A) TGG6 data for the 126 representative mammalian genomes studied scales negatively with maximum lifespan. Non-linear curve fitting to the data gave a fit in the form Y = a/X + b (Y=+5.166 × 10−6/X + 3.971 × 10−7), where Y is TGG6 frequency and X is maximum lifespan (solid line). The P value for a was significant at 1.68 × 10−8, and the P value for b was significant at 1.19 × 10−4. The R2 value for the fit was 0.547. Borders indicate the 95% mean parameter confidence interval. (B) CCG6 data for the 126 representative mammalian genomes scales positively with maximum lifespan. Non-linear curve fitting to the data gave a fit in the form Y=-a/X + b (Y=-4.153 × 10−7/X + 4.436 × 10−7), where Y is CCG6 frequency and X is maximum lifespan (solid line). The P value for a was insignificant at 0.256, while the P value for b was significant at 1.12 × 10−18. The R2 value for the fit was 0.576. (C) Log-Log plot of the TGG6 data for the 126 representative mammalian genomes studied scales negatively with maximum lifespan. Linear curve fitting to the data gave a fit in the form Y = −mX + −b (Y = −0.416X −5.699), where Y is TGG6 frequency and X is maximum lifespan (solid line). The P value was significant at 1.67 × 10−10. The R2 value for the power law fit was 0.281. (D) Log-Log plot of the CCG6 data for the 126 representative mammalian genomes scales positively with maximum lifespan. Linear curve fitting to the data gave a power law fit in the form Y = aX + b (Y= 0.165  X - 6.735), where Y is CCG6 frequency and X is maximum lifespan (solid line). The P value was significant at 0.044. The R2 value for the fit was 0.032. Borders indicate the 95% mean parameter confidence interval for the plots in each panel.
Figure 7.
Figure 7.
Fraction of G3-4N1−7G3-4N1−7G3-4N1−7G3-4 dynamic motifs containing or lacking one or more CG sites. (A) Data for the 126 representative mammalian genomes studied shows an upward trend in the fraction of motifs containing at least one CG site with lifespan. Non-linear curve fitting to the data gave a fit in the form Y = −a/X + b (Y = −0.494/X + 0.413), where Y is the fractional motif frequency and X is maximum lifespan (solid line). The P value for a was significant at 2.67 × 10−4, and the P value for b was significant at 6.68 × 10−51. The R2 value for the fit was 0.8992. Borders indicate the 95% mean parameter confidence interval. (B) Data for the 126 representative mammalian genomes studied detected a downward trend in the fraction of motifs lacking a CG site. Non-linear curve fitting to the data gave a fit in the form Y = a/X + b (Y= 0.540/X+ 0.588), where Y is quadruplex motif frequency and X is CG frequency (solid line). The P value for a was significant at 3.73 × 10−6, and the P value for b was significant at 1.15 × 10−74. The R2 value for the fit was 0.9719. Borders indicate the 95% mean parameter confidence interval.
Figure 8.
Figure 8.
Comparison of the G3AG3AG3AG3 and the average G3(A/C)G3(A/C)G3(A/C)G3 dynamic sequence frequencies. (A) G3AG3AG3AG3 data for the 126 representative mammalian genomes studied scales negatively with maximum lifespan. Non-linear curve fitting to the data gave a fit in the form Y = a/X + b (Y=+2.024 × 10−5/X + 2.059 × 10−6), where Y is G3AG3AG3AG3 frequency and X is maximum lifespan (solid line). The P value for a was significant at 1.02 × 10−9, and the P value for b was significant 6.98 × 10−12. The R2 value for the fit was 0.703. (B) G3AG3AG3AG3 Log-Log plot for the 126 representative mammalian genomes scales negatively with maximum lifespan. Linear model fitting to the data gave a fit in the form Y=-mX + b (Y = −0.379X −5.089), where Y is G3AG3AG3AG3 frequency and X is maximum lifespan (solid line). The P value was significant at 6.409 × 10−6. The R2 value for the fit was 0.153. (C) Average G3(A/C)G3(A/C)G3(A/C)G3 data for the 126 representative mammalian genomes studied scales positively with maximum lifespan. Linear model fitting to the data gave a fit in the form Y = −mX + b (Y = −3.963 × 10−8  X - 5.716 × 10−8), where Y is the Average G3(A/C)G3(A/C)G3(A/C)G3 frequency and X is maximum lifespan (solid line). The P value for a was insignificant at 0.481, while the P value for b was significant at 1.48 × 10−10. The R2 value for the fit was 0.496. (D) Log-Log plot of the G3(A/C)G3(A/C)G3(A/C)G3 frequency data for the 126 representative mammalian genomes scales positively with maximum lifespan. Linear model fitting to the data gave a power law fit in the form Y = mX + b (Y= −7.28 × 10−2  X -7.47) where Y is Average G3(A/C)G3(A/C)G3(A/C)G3 frequency and X is maximum lifespan (solid line). The P value was insignificant at 0.286. The R2 value for the fit was 0.009. Borders indicate the 95% mean parameter confidence interval for the plots in each panel.
Figure 9.
Figure 9.
Contribution of mutagenic dynamic sequences to the species-specific mutation rate and the species-specific methylation rate. In addition to spontaneous de-amination and replication errors, dynamic sequences are expected to contribute to both endogenous mutation accumulation and methylation pattern disruption based on both differences in genomic frequencies in the CG positive and CG negative pools. In short-lived mammals, mutagenesis initiated from the large CG negative pools would rapidly disrupt methylation and structure suppression in the CG positive pool releasing that pool for additional mutagenesis. Thus, methylation disruption would continue until both pools are depleted. In long-lived mammals with small CG negative pools, the release of CG positive sequences from methylation suppression would play out more slowly over a longer lifespan. In both long-lived and short-lived mammals, methylation suppression of structure formation will cause promoter and exon sequences to experience lower rates of dynamic structure linked mutagenesis. However, methylation will not inhibit transcription associated mutagenesis by mutagenic dynamic sequences.

References

    1. Spiegel J, Cuesta SM, Adhikari S et al. G-quadruplexes are transcription factor binding hubs in human chromatin. Genome Biol. 2021; 22:117. 10.1186/s13059-021-02324-z. - DOI - PMC - PubMed
    1. Lago S, Nadai M, Cernilogar FM et al. Promoter G-quadruplexes and transcription factors cooperate to shape the cell type-specific transcriptome. Nat Commun. 2021; 12:3885. 10.1038/s41467-021-24198-2. - DOI - PMC - PubMed
    1. Kim N The interplay between G-quadruplex and transcription. CMC. 2019; 26:2898–917. 10.2174/0929867325666171229132619. - DOI - PMC - PubMed
    1. Robinson J, Raguseo F, Nuccio SP et al. DNA G-quadruplex structures: more than simple roadblocks to transcription?. Nucleic Acids Res. 2021; 49:8419–31. 10.1093/nar/gkab609. - DOI - PMC - PubMed
    1. Antariksa NF, Di Antonio M The emerging roles of multimolecular G-quadruplexes in transcriptional regulation and chromatin organization. Acc Chem Res. 2024; 57:3397–406. 10.1021/acs.accounts.4c00574. - DOI - PMC - PubMed

LinkOut - more resources