. 2025 Sep 1;329(3):H680-H695.
doi: 10.1152/ajpheart.00363.2025. Epub 2025 Aug 12.

The sodium/glucose cotransporter 2 inhibitor empagliflozin is a pharmacological chaperone of cardiac Nav1.5 channels

Affiliations

The sodium/glucose cotransporter 2 inhibitor empagliflozin is a pharmacological chaperone of cardiac Nav1.5 channels

Jakob Sauer et al. Am J Physiol Heart Circ Physiol. .

Abstract

Diminished peak sodium current (INa) is a causative factor for slowed ventricular conduction and cardiac arrhythmias in patients with Duchenne muscular dystrophy (DMD), a devastating muscle disease triggered by dystrophin deficiency. Recently, we showed that chronic administration of the sodium/glucose cotransporter 2 (SGLT2) inhibitor empagliflozin (EMPA) restores diminished peak INa in ventricular cardiomyocytes from the dystrophin-deficient mdx mouse model of DMD. Here, we aimed to elucidate the underlying mechanism. Whole cell patch clamp studies revealed that 24-h incubation of dystrophic (mdx) ventricular cardiomyocytes with EMPA significantly increases peak INa in a concentration-dependent manner (EC50 = 94 nM). The enhancing effect on peak INa also occurred in dystrophic cardiac Purkinje fibers, as well as in dystrophic (DMDmdx) rat cardiomyocytes, and was also exerted by other SGLT2 inhibitors. Immunofluorescence studies suggested that chronic EMPA treatment fully restores wild-type Nav1.5 plasma membrane expression in mdx cardiomyocytes. Peak INa enhancement by EMPA depended on functional anterograde trafficking of Nav1.5. The local anesthetic mexiletine, a well-known pharmacological chaperone of Nav1.5, enhanced peak INa in a similar manner to EMPA. Furthermore, mutation of human Nav1.5 at a site important for local anesthetic binding (Y1767A) completely abolished the ability of both EMPA and mexiletine to enhance peak INa. Finally, the importance of Y1767 for drug-induced modulation of peak INa was confirmed by molecular docking simulations. Our findings suggest that EMPA acts as a pharmacological chaperone of Nav1.5 channels. Its chronic administration may reduce arrhythmia vulnerability in patients with DMD and other arrhythmogenic pathologies associated with diminished peak INa.NEW & NOTEWORTHY Dystrophin deficiency in cardiomyocytes leads to diminished peak Na currents. These can be fully rescued by long-term treatment with empagliflozin via pharmacochaperoning of Nav1.5 channels.

Keywords: Duchenne muscular dystrophy; arrhythmias; cardiomyocyte sodium currents; empagliflozin; pharmacochaperone.


Conflict of interest statement

Disclosures

No conflicts of interest, financial or otherwise, are declared by the authors.

Figures
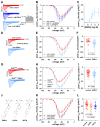
Figure 1
Figure 1. EMPA and other SGLT2 inhibitors enhance peak INa densities in dystrophin-deficient cardiomyocytes.
AC: concentration-response relationship of peak INa enhancement by 24-h EMPA incubation in ventricular cardiomyocytes derived from mdx mice. A: typical original INa traces of an mdx car-diomyocyte after 24-h incubation under control conditions and after 24-h incubation with 0.1 μM or 1 μM EMPA, elicited by the pulse protocol displayed in the inset. B: from a series of such experiments [n = 12 cells (mdx control), 12 cells (mdx 0.1 μM EMPA), and 13 cells (mdx 1 μM EMPA); all cells originating from the same 3 mdx hearts], peak INa density-voltage relationships were derived. Data points are represented as means ± SE. Parameters for INa activa-tion derived from fits of the current-voltage relationships (function described in METHODS) are given in Table 1. C: peak INa densities at −41 mV were plotted against the EMPA concentration. Data were fit with a function given in the METHODS and yielded an EC50 value of 94 nM (Hill Coeff., 1.3). DF, effect of 24-h incubation with 1 μM EMPA on peak INa of cardiac Purkinje fibers derived from mdx-Cx40eGFP/ + mice. D: typical original current traces of an mdx Purkinje fiber after incubation under control conditions or after EMPA treatment. E: respective peak INa density-voltage relationships [n = 23 cells (mdx control) and 27 cells (mdx EMPA); all cells originating from the same 4 mdx hearts]. F: dot plot comparing the maximum peak INa densities of untreated control and EMPA-treated mdx Purkinje fibers at −41 mV. A significant difference existed between control and EMPA-treated cells. GI: effect of 24-h incubation with 1 μM EMPA on peak INa of ventricular cardiomyocytes derived from DMDmdx rats. G: typical original current traces of a DMDmdx rat cardiomyocyte after incubation under control conditions or after EMPA treatment. H: respective peak INa density-voltage relationships [n = 35 cells (DMDmdx control) and 37 cells (DMDmdx EMPA); all cells originating from the same 4 DMDmdx hearts]. I: dot plot comparing the maximum peak INa densities of untreated control and EMPA-treated DMDmdx cardiomyocytes at −46 mV. A significant difference existed between control and EMPA-treated cells. JL: effect of 24-h incubation with other SGLT2 inhibitors on peak INa of ventricular cardiomyocytes derived from mdx mice. J: chemical structure comparison of EMPA (PubChem CID 11949646), dapagliflozin (DAPA, PubChem CID 9887712), and sotagliflozin (SOTA, PubChem CID 24831714). K: peak INa density-voltage relationships from untreated control mdx cardiomyocytes (n = 28 cells), mdx myocytes treated with 1 μM DAPA (n = 30 cells), and mdx myocytes treated with 1 μM SOTA (n = 29 cells, all cells originating from the same 4 mdx hearts). L: dot plot comparing the maximum peak INa densities of untreated control, DAPA-treated, and SOTA-treated mdx cardiomyocytes at −41 mV. A significant difference existed between control and DAPA-treated cells, as well as between control and SOTA-treated cells. DMD, Duchenne muscular dystrophy; EMPA, empagliflozin; INa, peak sodium current; SGLT2, sodium/glucose cotransporter 2.
Figure 2
Figure 2. Chronic effects of EMPA on peak INa in nondystrophic cells.
AC: effect of 24-h incubation with 1 μM EMPA on peak INa of ventricular cardiomyocytes isolated from wild-type (wt) mice. A: typical original current traces of a wt ventricular cardiomyocyte after incubation under control conditions or after exposure to 1 μM EMPA for 24 h (for pulse protocol see Fig. 1A). B: respective peak INa density-voltage relationships [n = 24 cells (wt control) and 33 cells (wt EMPA); all cells originating from the same 4 wt hearts]. C: dot plot comparing the maximum peak INa densities of untreated control and EMPA-treated wt ventricular cardiomyocytes at −41 mV. No difference existed between control and EMPA-treated cells. DF: effect of 24-h incubation with 10 μM EMPA (estimated free EMPA concentration: 1 μM) on peak INa of tsA201 cells expressing wt Nav1.5. D: typical original current traces of a Nav1.5-expressing tsA201 cell after incubation under control conditions or after EMPA treatment (for pulse protocol see inset). E: respective peak INa density-voltage relationships [n = 19 cells (control) and 20 cells (EMPA); all cells originating from the same 4 transfections]. F: dot plot comparing the maximum peak INa densities of untreated control and EMPA-treated Nav1.5-expressing tsA201 cells at −46 mV. A significant difference existed between control and EMPA-treated cells. EMPA, empagliflozin; INa, peak sodium current.
Figure 3
Figure 3. Chronic exposure to EMPA fully rescues Nav1.5 plasma membrane expression in cardiomyocytes from dystrophin-deficient mdx mice.
A: representative confocal immunofluorescence images of isolated wild-type (wt) and mdx ventricular cardiomyocytes stained using a Nav1.5-specific rabbit primary antibody (ASC-005; Alomone Labs; dilution 1:100) and a donkey anti-rabbit secondary antibody conjugated to Alexa Fluor Plus 555 (Cat. No. A32794; Thermo Fisher Scientific; dilution 1:500). Staining of the cells was performed after a 24-h incubation under control conditions (wt control, mdx control), or after a 24-h incubation with 1 μM EMPA (mdx EMPA). B: exemplary region of interest for quantification of fluorescence, always drawn in the transmitted light image to guarantee an unbiased selection of the areas. The mean fluorescence intensity (in arbitrary units, AU) within the region of interest (one for each cardiomyocyte) was used as a marker for Nav1.5 expression. C: mean fluorescence intensities for control cardiomyocytes from 3 wt hearts, and for control or EMPA-treated cardiomyocytes from 3 mdx hearts [n = 80 cells (wt control), n = 82 cells (mdx control), and 104 cells (mdx EMPA)]. A significant difference existed between wt control and mdx control cells, as well as between mdx control and mdx EMPA cells. Each dot represents a single cell. In addition, means ± SE are shown. EMPA, empagliflozin.
Figure 4
Figure 4. EMPA enhances peak INa densities in dystrophin-deficient mdx ventricular cardiomyocytes via facilitation of Nav1.5 trafficking to the plasma membrane.
AF: effects of protein synthesis inhibition and inhibition of anterograde trafficking on peak INa enhancement by 1 μM EMPA in mdx cardiomyocytes. A: peak INa density-voltage relationships from untreated control mdx cardiomyocytes (n = 28 cells), and mdx myocytes incubated for 4 h with 1 μM EMPA (n = 29 cells, all cells originating from the same 4 mdx hearts). Parameters for INa activation are given in Table 1. B: dot plot comparing the maximum peak INa densities of untreated control and 4-h EMPA-treated mdx cardiomyocytes at −41 mV. A significant difference existed between control and EMPA-treated cells. C: peak INa density-voltage relationships from mdx cardiomyocytes treated with 50 μg/mL of the protein synthesis inhibitor cycloheximide (CHX) for 4 h (n = 25 cells), and mdx myocytes incubated for 4 h with 50 μg/mL CHX and 1 μM EMPA (n = 29 cells, all cells originating from the same 4 mdx hearts). D: respective dot plot (at −41 mV) showing a significant difference between only CHX- and CHX-plus EMPA-treated cells. E: peak INa density-voltage relationships from mdx cardiomyocytes treated with 5 μg/mL of the anterograde trafficking inhibitor brefeldin A (BFA) for 24 h (n = 22 cells), and mdx myocytes incubated for 24 h with 5 μg/mL BFA and 1 μM EMPA (n = 22 cells, all cells originating from the same 3 mdx hearts). F: respective dot plot (at −41 mV), showing that the presence of BFA abolished peak INa enhancement by EMPA in mdx cardiomyocytes. G and H: effect of 24-h incubation with mexiletine (MEXI) on peak INa of ventricular cardiomyocytes derived from mdx mice. G: peak INa density-voltage relationships from untreated control mdx cardiomyocytes (n = 34 cells), mdx myocytes treated with 10 μM MEXI (n = 33 cells), and mdx myocytes treated with 10 μM MEXI and 1 μM EMPA (n = 33 cells, all cells originating from the same 5 mdx hearts). H: respective dot plot (at −41 mV), showing that MEXI treatment significantly enhanced the peak INa density in mdx myocytes. The additional presence of EMPA had no effect. CHX, cycloheximide; EMPA, empagliflozin; INa, peak sodium current.
Figure 5
Figure 5. Disruption of EMPA and mexiletine (MEXI) binding to Nav1.5 by mutagenesis abolishes the drugs’ enhancing effect on peak INa.
AF: effect of 24-h incubation with 10 μM EMPA (estimated free EMPA concentration: 1 μM) on peak INa of tsA201 cells expressing mutant Nav1.5 channels. A: typical original current traces of a Nav1.5-F1760A-expressing tsA201 cell after incubation under control conditions or after EMPA treatment. B: from a series of such experiments [n = 19 cells (control) and 19 cells (EMPA); all cells originating from the same 6 transfections], peak INa density-voltage relationships were derived. Parameters for INa activation are given in Table 1. The inset shows respective peak INa density-voltage relationships derived from tsA201 cells expressing wt Nav1.5 (also see Fig. 1E). C: respective dot plot at −46 mV. D: typical original current traces of a Nav1.5-Y1767A-expressing tsA201 cell after incubation under control conditions or after EMPA treatment. E: respective peak INa density-voltage relationships [n = 17 cells (control) and 17 cells (EMPA); all cells originating from the same 4 transfections]. F: dot plot at −46 mV. GJ: effect of 24-h incubation with MEXI on peak INa of tsA201 cells expressing mutant Nav1.5 channels. G: peak INa density-voltage relationships of Nav1.5-F1760A-expressing tsA201 cells after incubation under control conditions (n = 17 cells) or after 24-h incubation with 100 μM MEXI (n = 17 cells, all cells originating from the same 4 transfections). H: respective dot plot at −46 mV. I: peak INa density-voltage relationships of Nav1.5-Y1767A-expressing tsA201 cells after incubation under control conditions (n = 17 cells) or after 24-h incubation with 100 μM MEXI (n = 17 cells, all cells originating from the same 4 transfections). J: respective dot plot at −46 mV. EMPA, empagliflozin; INa, peak sodium current.
Figure 6
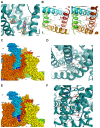
Figure 6. Molecular modeling analysis.
A: location of binding residues in different Nav1.5 cryo-EM structures and the Alphafold3 model. The side-chains of F1760 and Y1767 are shown as sticks, with oxygen atoms colored in red. B: differences in the activation gate diameter [residue positions taken from Jiang et al. (36)] between opposing C-alpha atoms are shown as gray dotted lines, values in Å. Residue numbering corresponds to human Nav1.5 numbers. C: spheres representation of the consensus binding mode of MEXI at the fenestration of DI-DIV shown in side view. D: close-up view of residues within 5 Å of the drugs, shown as sticks. Hydrogen bonds are shown as yellow dotted lines. E: spheres representation of the consensus binding mode of EMPA at the fenestration is shown in side-view. F: close-up view of residues within 5 Å of the drugs, shown as sticks. Hydrogen bonds are shown as yellow dotted lines. EMPA, empagliflozin.

References

    1. Rivaud MR, Delmar M, Remme CA. Heritable arrhythmia syndromes associated with abnormal cardiac sodium channel function: ionic and non-ionic mechanisms. Cardiovasc Res. 2020;116:1557–1570. doi: 10.1093/cvr/cvaa082. - DOI - PMC - PubMed
    1. Jimenez-Vazquez EN, Arad M, Macías Á, Vera-Pedrosa ML, Cruz FM, Gutierrez LK, Cuttitta AJ, Monteiro da Rocha TJ, Herron TJ, Ponce-Balbuena D, Guerrero-Serna G, et al. SNTA1 gene rescues ion channel function and is antiarrhythmic in cardiomyocytes derived from induced pluripotent stem cells from muscular dystrophy patients. eLife. 2022;11:e76576. doi: 10.7554/eLife.76576. - DOI - PMC - PubMed
    1. Perloff JK. Cardiac rhythm and conduction in Duchenne’s muscular dystrophy: a prospective study of 20 patients. J Am Coll Cardiol. 1984;3:1263–1268. - PubMed
    1. Gavillet B, Rougier JS, Domenighetti AA, Behar R, Boixel C, Ruchat P, Lehr HA, Pedrazzini T, Abriel H. Cardiac sodium channel Nav1.5 is regulated by a multiprotein complex composed of syntrophins and dystrophin. Circ Res. 2006;99:407–414. - PubMed
    1. Koenig X, Dysek S, Kimbacher S, Mike AK, Cervenka R, Lukacs P, Nagl K, Dang XB, Todt H, Bittner RE, Hilber K. Voltage-gated ion channel dysfunction precedes cardiomyopathy development in the dystrophic heart. PLoS One. 2011;6:e20300. doi: 10.1371/journal.pone.0020300. - DOI - PMC - PubMed

MeSH terms

LinkOut - more resources