A holistic genome dataset of bacteria and archaea of mangrove sediments
- PMID: 40796374
- PMCID: PMC12343073
- DOI: 10.1093/gigascience/giaf081
A holistic genome dataset of bacteria and archaea of mangrove sediments
Abstract
Background: Mangroves are one of the most productive marine ecosystems with high ecosystem service value. The sediment microbial communities contribute to pivotal ecological functions in mangrove ecosystems. However, the study of mangrove sediment microbiomes is limited.
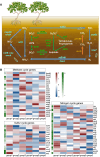
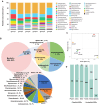
Findings: Here, we applied metagenome sequencing analysis of microbial communities in mangrove sediments across Southeast China from 2014 to 2020. This genome dataset includes 966 metagenome-assembled genomes with ≥50% completeness and ≤10% contamination generated from 6 groups of samples. Phylogenomic analysis and taxonomy classification show that mangrove sediments are inhabited by microbial communities with high species diversity. Thermoplasmatota, Thermoproteota, and Asgardarchaeota in archaea, as well as Proteobacteria, Desulfobacterota, Chloroflexota, Acidobacteriota, and Gemmatimonadota in bacteria, dominate the mangrove sediments across Southeast China. Functional analyses suggest that the microbial communities may contribute to carbon, nitrogen, and sulfur cycling in mangrove sediments.
Conclusions: These combined microbial genomes provide an important complement of global mangrove genome datasets and may serve as a foundational resource for enhancing our understanding of the composition and functions of mangrove sediment microbiomes.
Keywords: mangrove wetland; metagenome sequencing; metagenome-assembled genomes; microbial composition; sediment microbiome.
© The Author(s) 2025. Published by Oxford University Press on behalf of GigaScience.
Conflict of interest statement
The authors declare that they have no competing interests.
Figures


References
-
- Donato DC, Kauffman JB, Murdiyarso D, et al. Mangroves among the most carbon-rich forests in the tropics. Nat Geosci. 2011;4:293–97. 10.1038/NGEO1123. - DOI
-
- Koch EW, Barbier EB, Silliman BR, et al. Non-linearity in ecosystem services: temporal and spatial variability in coastal protection. Front Ecol Environ. 2009;7:29–37. 10.1890/080126. - DOI
MeSH terms
Grants and funding
- 2023B0303000017/Guangdong Major Project of Basic and Applied Basic Research
- 92251306/National Natural Science Foundation of China
- 92051102/National Natural Science Foundation of China
- 92251307/National Natural Science Foundation of China
- 92351303/National Natural Science Foundation of China
- 32370055/National Natural Science Foundation of China
- 32200099/National Natural Science Foundation of China
- 32070108/National Natural Science Foundation of China
- 32225003/National Natural Science Foundation of China
- 31970105/National Natural Science Foundation of China
- 42303064/National Natural Science Foundation of China
- 42430707/National Natural Science Foundation of China
- JCYJ20200109105010363/Shenzhen Science and Technology Program
- KCXFZ20201221173404012/Shenzhen Science and Technology Program
- JCYJ20230808105711023/Shenzhen Science and Technology Program
- 20220809161641002/Shenzhen Science and Technology Program
- SML2023SP218/SML2023SP237/Southern Marine Science and Engineering Guangdong Laboratory
- 2022B002/Shenzhen University
LinkOut - more resources
Full Text Sources

