. 2025 Aug 12;16(1):7487.
doi: 10.1038/s41467-025-62758-y.

REST/NRSF Preserves muscle stem cell identity by repressing alternate cell fate

Affiliations

REST/NRSF Preserves muscle stem cell identity by repressing alternate cell fate

Korin Sahinyan et al. Nat Commun. .

Abstract

Cell fate and identity require timely activation of lineage-specific and concomitant repression of alternate-lineage genes. How this process is epigenetically encoded remains largely unknown. In skeletal muscle stem cells, the myogenic regulatory factors are well-established drivers of muscle gene activation but less is known about how non-muscle gene repression is achieved. Here, we show that the master epigenetic regulator, Repressor Element 1-Silencing Transcription factor (REST), also known as Neuron-Restrictive Silencer Factor (NRSF), is a key regulator of this process. We show that many non-lineage genes retain permissive chromatin state but are actively repressed by REST. Loss of functional REST in muscle stem cells and progenitors disrupts muscle specific epigenetic and transcriptional signatures, impairs differentiation, and triggers apoptosis in progenitor cells, leading to depletion of the stem cell pool. Consequently, REST-deficient skeletal muscle exhibits impaired regeneration and reduced myofiber growth postnatally. Collectively, our data suggests that REST plays a key role in safeguarding muscle stem cell identity by repressing multiple non-muscle lineage and developmentally regulated genes in adult mice.


Conflict of interest statement

Competing interests: The authors declare no competing interests.

Figures

Fig. 1
Fig. 1. Many non-muscle lineage genes retain activating chromatin marks in freshly sorted MuSCs.
a Table showing the number of genes not expressed in muscle and the proportion marked by H3K4me3 or H3K27me3 based on proximity to peaks. Non-expressed genes were identified from RNA-Seq (RPM < 1) of MuSCs, myoblasts, and myofibers (n = 3 mice), using all 47,069 ENSEMBL-annotated genes (including protein-coding, lncRNAs, sncRNAs, and pseudogenes). H3K4me3 annotations were from Cut&Tag on freshly sorted MuSCs (n = 2 mice), and H3K27me3 annotations from Cut&Run (n = 3 mice). b Heatmap of gene expression from RNA-Seq of MuSCs (n = 3 mice), clustered into expressed (RPM > 5), ambiguous (RPM 1–5), and not expressed (RPM < 1) groups. c Heatmap of H3K4me3 Cut&Tag signal in freshly sorted MuSCs (n = 2 mice), showing normalized reads +/− 1 kb around the TSS for genes in panel b in order. df IGV tracks of MuSC RNA-Seq, H3K4me3 and H3K27ac Cut&Tag, and H3K27me3 Cut&Run for representative genes. n = 3 mice RNA-Seq, n = 2 mice Cut&Tag, n = 2 mice Cut&Run. d Myogenic Regulatory Factor 5 (Myf5). e GATA Binding Protein 2 (Gata2). f Paired Box 6 (Pax6). g Bar graph showing complete RE-1 motif density (motifs/kb) under the DNA sequences of the H3K4me3 peaks near non-muscle genes, compared to an equal number of random genomic sequences. n = 2 mice Cut&Tag for H3K4me3. Two-tailed t-test. Data represented as SEM. h Bar graph showing the percentage of non-muscle genes with complete, left-half, or right-half RE-1 motifs within +/− 1 kb of the TSS and enriched for H3K4me3 (MuSC Cut&Tag, n = 2 mice) and/or H3K27me3 (MuSC Cut&Run, n = 3 mice). Partial motifs shown only if not overlapping with a complete site. Source data are provided as a Source Data file. i Pie chart showing peak annotation for REST Cut&Run in cultured myoblasts (n = 3 mice). j RE-1 motif logo from Homer motif analysis of REST Cut&Run peaks in myoblasts. Source data are provided as a Source Data file. k Bar graph showing overlap between REST Cut&Run peaks in myoblasts and histone marks (H3K4me3 and/or H3K27me3) from MuSCs. Source data for all analyses are provided as a Source Data file.
Fig. 2
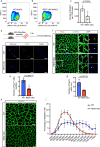
Fig. 2. Genetic deletion of REST leads to depletion of MuSC pool and subsequent myofiber atrophy.
a, b Gating strategy for Fluorescence Activated Cell Sorting (FACS) of WT and REST-cKO MuSCs, respectively, using positive selection for ITGA7+/Lin- (CD11b, Sca1, CD45 and CD31). c Counts of MuSCs isolated from REST-cKO and WT mice, normalized to the counting beads. n = 3 biological replicates. Two-tailed t-test, bars represent mean ± SD. d Representative image of WT and REST-cKO myofibers at 0 hr stained for Pax7. A schematic diagram showing EDL myofiber isolation and staining from REST-cKO and WT mice was generated with BioRender. Blackburn, D. (2025) https://BioRender.com/0691hgy. Scale Bar = 25 µm. e Quantification of the number of Pax7+ MuSCs per myofiber. n = 6 biological replicates. Two-tailed t-test, bars represent mean ± SD. f Representative immunofluorescence staining of WT and REST-cKO TA muscle cross-sections for Pax7 and Laminin. Scale Bar = 25 µm. g Quantification of the number of Pax7+ cells / unit area (mm2). n = 3 WT mice, n = 4 REST-cKO mice. Two-tailed t-test, bars represent mean ± SD. h Representative image of WT and REST-cKO TA cross-sections stained for Laminin. Scale Bar = 25 µm. iCross-sectional areas binned by 100. Data shown as the percentage of myofibers in each area bin. Bars represent mean ± SD. n = 3 WT mice, n = 4 REST-cKO mice.
Fig. 3
Fig. 3. Alterations in the myofiber are not the major cause of muscle atrophy upon REST deletion.
a Schematic Diagram of isolation of single myofibers and generation of either RNA or ATAC-Seq libraries (smfRNA-Seq & smfATAC-Seq), generated with Biorender. Blackburn, D. (2025) https://BioRender.com/zxlvitn. b Principal Component Analysis (PCA) of read counts of the REST-cKO and WT myofiber RNA-Seq along the two principal components. n = 3 WT mice, n = 3 REST-cKO mice myofiber RNA-Seq. c Gene Set Enrichment Analysis (GSEA) of WT and REST-cKO myofiber RNA-seq. The top 15 significant Reactome Pathways are shown (p-adj < 0.1). Two-tailed t-test, adjusted for multiple comparisons. Source data for the GSEA analysis are provided as a Source Data file. df IGV tracks of WT and REST-cKO myofiber RNA-Seq for the expression of muscle creatine kinase (Ckm), Synaptosomal-Associated Protein 25 (Snap25) and Chromogranin A (Chga) genes, respectively. gi IGV tracks of WT and REST-cKO myofiber ATAC-Seq on Ckm, Snap25 and Chga genes, respectively, displaying chromatin accessibility on the TSS region of each gene. n = 2 WT mice, n = 2 REST-cKO mice myofiber ATAC-Seq.
Fig. 4
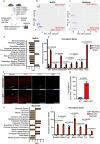
Fig. 4. Genetic deletion of REST transcriptionally alters MuSCs and myoblasts and leads to the expression of multiple non-muscle lineage gene programs.
a Diagram representing the isolation of MuSCs and culture of primary myoblasts followed by SMART-Seq and sequencing-ready library preparation, generated with Biorender. Blackburn, D. (2025) https://BioRender.com/lz3gnv0. b PCA read counts of WT and REST-cKO MuSC RNA-Seq along the two principal components. n = 3 WT mice, n = 3 REST-cKO mice. c PCA read counts of WT and REST-cKO primary myoblast RNA-Seq along the two principal components. n = 3 WT mice, n = 3 REST-cKO mice. d GSE analysis of WT and REST-cKO MuSC RNA-Seq. The top 14 significant Reactome Pathways are shown (p-adj < 0.1). Two-tailed t test, adjusted for multiple comparisons. Source data for the GSEA analysis are provided as a Source Data file. e Absolute expression of select representative neurogenic genes in WT and REST-cKO MuSCs. n = 3 WT, n = 3 REST-cKO MuSC RNA-Seq, Two-tailedt test, bars represent mean ± SD. f Representative immunofluorescence image of WT and REST-cKO myofibers at 0 hr, stained for DCX and Pax7. Scale Bar = 25 µm. g Quantification of DCX+/Pax7+ cells per myofiber. Presented as a percentage of DCX+Pax7+ / Pax7+ cells. n = 3 WT mice, n = 3 REST-cKO mice. Two-tailedt test, bars represent mean ± SD. h GSE analysis of WT and REST-cKO myoblast RNA-Seq. The top 15 significant Reactome Pathways are shown (p-adj < 0.1). Two-tailedt test, adjusted for multiple comparisons. Source data for the GSEA analysis are provided as a Source Data file. i Absolute expression of select representative neurogenic genes in WT and REST-cKO primary myoblasts. n = 3 WT, n = 3 REST-cKO myoblast RNA-Seq. Two-tailed t-test, bars represent mean ± SD.
Fig. 5
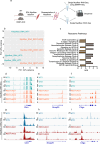
Fig. 5. Genetic deletion of REST leads to loss of myogenic identity through alterations in the chromatin state of MuSCs.
a Bar graph showing the percentage of differentially expressed genes that are expressed in the brain (RPM > 5) but not expressed in myoblasts or MuSCs (RPM < 1) based on the intersection of publicly available data set and our WT RNA-Seq of MuSCs and myoblasts. Source data for the calculations are provided as a Source Data file. b, c Venn diagram showing the number of differentially expressed genes (abs log₂FC > 1, adj p < 0.05) between WT and REST-cKO Myoblasts (b) or MuSCs (c) that are also uniquely expressed in other tissues (RPM > 5 in other tissues, RPM < 1 in MuSCs/myoblasts) using the intersection of publicly available data set and our WT RNA-Seq of MuSCs and myoblasts. d Bar graph showing absolute expression (RPM) of select neuroendocrine genes from the RNA-Seq of myoblasts. n = 3 WT mice and n = 3 REST-cKO mice. Two-tailed t-test, bars represent mean ± SD. e Bar graph showing absolute expression of examples of genes expressed in other non-muscle cell types from the RNA-Seq of myoblasts. n = 3 WT and n = 3 REST-cKO myoblasts. Two-tailed t-test, bars represent mean ± SD. f Diagram showing the isolation of MuSCs and OMNI-ATAC-Seq library preparation, generated with Biorender. Blackburn, D. (2025) https://BioRender.com/apukmd1 (g) PCA read counts of ATAC-Seq of WT and REST-cKO MuSCs along the two principal components. n = 4 WT mice, n = 4 REST-cKO mice. h Pile up analysis of differentially accessible peaks between WT and REST-cKO MuSCs. Less accessible peaks: log2FC ≤ − 1. More accessible peaks: log2FC ≥ 1. ik IGV tracks of WT and REST-cKO MuSC ATAC-Seq and the corresponding WT and REST-cKO MuSC Cut&Tag of H3K27ac on Bdnf, Stmn3 and Chga genes, respectively, displaying chromatin accessibility and the presence of the histone mark on the TSS of each gene. n = 4 WT, n = 4 REST-cKO MuSC ATAC-Seq. n = 2 WT, n = 2 REST-cKO Cut&Tag of H3K27ac on freshly sorted MuSC.
Fig. 6
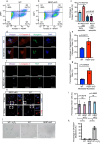
Fig. 6. Deregulation of MuSC gene expression patterns upon REST deletion leads to apoptosis of myogenic progenitor cells in adult mice.
a, b Representative scatter plot images of Annevin V Assay performed by flow cytometry. Cultured WT and REST-cKO primary myoblasts are double-stained with Annexin V and DAPI and subsequently analyzed for the presence of apoptosis. c Quantification of percentage of cell death (Annexin V+ cells). Both early apoptotic (Annexin V+ DAPI) and late apoptotic (Annexin V+ DAPI+) cells are quantified. n = 3 WT and n = 3 REST-cKO myoblasts (biological replicates). Two-tailed t test, bars represent mean ± SD. d Representative image of WT and REST-cKO myofibers at 72 h, stained for Cleaved-Caspase 3 (C-Caspase 3) and Myogenin. Scale Bar = 25 µm. e Quantification of C-Caspase 3 + myofiber-associated myoblasts per myofiber. n = 3 WT and n = 3 REST-cKO myofibers (biological replicates). Two-tailed t test, bars represent mean ± SD. f Representative image of WT and REST-cKO primary myoblasts stained for Cleaved-Caspase 3 and Pax7. Scale Bar = 25 µm. g Bar graph displaying the percentage of C-Caspase 3 + apoptotic cells. n = 3 WT and n = 3 REST-cKO myoblasts (biological replicates). Two-tailed t test, bars represent mean ± SD. h Representative image of WT and REST-cKO cultured primary myoblasts treated with EDU for 12 and 24 h. Scale Bar = 25 µm. i Quantification of percentage of EDU+ cells at 12 and 24 h. n = 4 WT and n = 4 REST-cKO myoblasts (biological replicates). Two-tailed t test, bars represent mean ± SD. j Representative image of SA-β galactosidase assay performed on WT and REST-cKO cultured primary myoblasts. As a positive control, WT primary myoblasts were treated with 20 μM H2O2 for 15 min and left in fresh culture media for 48 h before fixation. Scale Bar = 50 µm. k Quantification of the percentage of SA-β-Gal+ cells. n = 3 WT and n = 3 REST-cKO myoblasts (biological replicates). Two-tailed t test, bars represent mean ± SD.

References

    1. Lepper, C., Partridge, T. A. & Fan, C. M. An absolute requirement for Pax7-positive satellite cells in acute injury-induced skeletal muscle regeneration. Development138, 3639–3646 (2011). - PMC - PubMed
    1. Wang, Y. X. & Rudnicki, M. A. Satellite cells, the engines of muscle repair. Nat. Rev. Mol. Cell Biol.13, 127–133 (2011). - PubMed
    1. Schultz, E., Gibson, M. C. & Champion, T. Satellite cells are mitotically quiescent in mature mouse muscle: an EM and radioautographic study. J. Exp. Zool.206, 451–456 (1978). - PubMed
    1. Collins, C. A. et al. Stem cell function, self-renewal, and behavioral heterogeneity of cells from the adult muscle satellite cell niche. Cell122, 289–301 (2005). - PubMed
    1. Maltin, C. A., Harris, J. B. & Cullen, M. J. Regeneration of mammalian skeletal muscle following the injection of the snake-venom toxin, taipoxin. Cell Tissue Res.232, 565–577 (1983). - PubMed

LinkOut - more resources