. 2025 Aug 13;16(1):7494.
doi: 10.1038/s41467-025-62730-w.

Modeling the genomic architecture of adiposity and anthropometrics across the lifespan

Collaborators, Affiliations

Modeling the genomic architecture of adiposity and anthropometrics across the lifespan

Christopher H Arehart et al. Nat Commun. .

Abstract

Obesity-related conditions are among the leading causes of preventable death and are increasing in prevalence worldwide. Body size and composition are complex traits that are challenging to characterize due to environmental and genetic influences, longitudinal variation, heterogeneity between sexes, and differing health risks based on adipose distribution. Here, we construct a 4-factor genomic structural equation model using 18 measures, unveiling shared and distinct genetic architectures underlying birth size, abdominal size, adipose distribution, and adiposity. Multivariate genome-wide associations reveal the adiposity factor is enriched specifically in neural tissues and pathways, while adipose distribution is enriched more broadly across physiological systems. In addition, polygenic scores for the adiposity factor predict many adverse health outcomes, while those for body size and composition predict a more limited subset. Finally, we characterize the factors' genetic correlations with obesity-related traits and examine the druggable genome by constructing a bipartite drug-gene network to identify potential therapeutic targets.


Conflict of interest statement

Competing interests: The authors declare no competing interests.

Figures

Fig. 1
Fig. 1. Genomic structural equation model of adiposity and anthropometrics across the lifespan.
The standardized measurement model derived using genomic structural equation modeling (SEM) comprised of 4 latent genetic factors and 18 indicator variables. The 4 genetic factors are shaded yellow, the traits with combined males and females are shaded gray, and the traits stratified by males and females are shaded in color-matched pairs. The one-directional arrows signify standardized factor loadings and describe the strength and direction of the relationships between genetic indicators and their underlying latent constructs. Standardized covariance relationships (i.e., correlations) between the factors are represented by two-directional arrows, and the two-directional arrows pointing from a variable to itself denote the standardized residuals (the unique genetic variance not reflected through other paths in the model). Uncertainties in standardized parameter estimates are indicated by standard errors provided in parentheses.
Fig. 2
Fig. 2. Characterizing F1 – the genetics of birth size.
The 3 indicator variables relating to birth size and their standardized loadings on F1, the 1st latent genetic factor, are shown in (a). This genetic factor did not have any genetic enrichment across physiological systems, cell types, or tissue types (FDR < 0.05) in the DEPICT enrichment analysis (b). The polygenic score (PGS) weights for F1 were applied in an external sample (CCPM Biobank, N = 25,240) and implemented in a phenome wide association study (pheWAS); The significant logistic regression pheWAS associations between F1 PGS and phenotypes are shown in (c), with phenotype labels for the points to the right of the vertical dashed red line denoting the FDR < 0.10 Bonferroni-corrected significance threshold, and triangle direction (up/down) indicating F1 PGS direction of effect (+/−). Source data are provided as a Source Data file.
Fig. 3
Fig. 3. Characterizing F2 – the genetics of abdominal size.
The 3 indicator variables relating to abdominal size and their standardized loadings on F2, the 2nd latent genetic factor, are shown in (a). This genetic factor showed gene expression enrichment across a variety of physiological systems, cell types, and tissue types (orange coloring, FDR < 0.05) in the DEPICT enrichment analysis (b). The polygenic score (PGS) weights for F2 were applied in an external sample (CCPM Biobank, N = 25,240) and implemented in a phenome wide association study (pheWAS); The significant logistic regression pheWAS associations between F2 PGS and phenotypes are shown in (c), with phenotype labels for the points to the right of the vertical dashed red line denoting the FDR < 0.10 Bonferroni-corrected significance threshold, and triangle direction (up/down) indicating F2 PGS direction of effect (+/−). Source data are provided as a Source Data file.
Fig. 4
Fig. 4. Characterizing F3 – the genetics of body size and adipose distribution.
The 7 indicator variables relating to body size and adipose distribution and their standardized loadings on F3, the 3rd latent genetic factor, are shown in (a). This genetic factor showed gene expression enrichment across a variety of physiological systems, cell types, and tissue types (FDR < 0.05) in the DEPICT enrichment analysis (b). The polygenic score (PGS) weights for F3 were applied in an external sample (CCPM Biobank, N = 25,240) and implemented in a phenome wide association study (pheWAS); The significant logistic regression pheWAS associations between F3 PGS and phenotypes are shown in (c), with phenotype labels for the points to the right of the vertical dashed red line denoting the FDR < 0.10 Bonferroni-corrected significance threshold, and triangle direction (up/down) indicating F3 PGS direction of effect (+/−). Source data are provided as a Source Data file.
Fig. 5
Fig. 5. Characterizing F4 – the genetics of adiposity.
The 7 indicator variables relating to adiposity and their standardized loadings on F4, the 4th latent genetic factor, are shown in (a). This genetic factor showed gene expression enrichment only in nervous physiological systems and cell types (FDR < 0.05) in the DEPICT enrichment analysis (b). The polygenic score (PGS) weights for F4 were applied in an external sample (CCPM Biobank, N = 25,240) and implemented in a phenome wide association study (pheWAS); The significant logistic regression pheWAS associations between F4 PGS and phenotypes are shown in (c), with phenotype labels for the points to the right of the vertical dashed red line denoting the FDR < 0.10 Bonferroni-corrected significance threshold, and triangle direction (up/down) indicating F4 PGS direction of effect (+/−). Source data are provided as a Source Data file.
Fig. 6
Fig. 6. Network of genetic correlations with the 4 factors.
A network with edges depicting the strength of genetic correlations between the 4 Genomic SEM factors and an array of genetically related traits. Small pairwise correlations ≤ 0.15 were pruned from the network highlighting this subset of 33 genetically correlated traits from a broader set of 75 considered traits (see Supplementary Table 3). The 4 factors had weak between-factor genetic correlations (besides F1 and F3) and their unique genetic signals are characterized by each factor’s grouping with a distinct, but not entirely exclusive, set of phenotypes. Trait names and abbreviations in alphabetical order: Alcohol Consumption Frequency (ACF); Attention-Deficit Hyperactivity Disorder (ADHD); Age of Smoking Initiation (AgeSI); Anorexia Nervosa (AN); Anxiety Disorders (ANX); Adult-Onset Asthma (AsAO); Atrial Fibrillation (AtrFib); Coronary Artery Disease (CAD); Cigarettes Per Day (CPD); Cannabis Use Disorder (CUD); Personality - Extraversion (Extrv); F1 - Birth Size (F1); F2 - Abdominal Size (F2); F3 - Body Size, Adipose Distribution (F3); F4 - Adiposity (F4); Fasting Glucose (FastGluc); Cardiorespiratory Fitness - Heart Rate (FitHR); Cardiorespiratory Fitness - VO2 Max (FitVO2); Frailty Index (Frail); High-Density Lipoprotein Cholesterol (HDL); Metabolic Syndrome (MetSyn); Neuroticism (Neur); Neuroticism - Depressed Affect (NeurD); Neuroticism - Worry (NeurW); Obsessive Compulsive Disorder (OCD); Pain - General (PainG); Pain - Musculoskeletal (PainM); Problematic Alcohol Use (PAU); Physical Activity (PhysA); General Risk-Tolerance (Risk); Systolic Blood Pressure (SBP); Smoking Cessation (SC); Smoking Initiation (SI); Sleep Efficiency (SleepE); Type 2 Diabetes (T2D); Triglycerides (Triglyc); Serum Urate - Gout (Urate). Source data are provided as a Source Data file.
Fig. 7
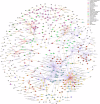
Fig. 7. Drug-gene network for F4 with indications.
The bipartite approved drug-gene network for significant genes in the GWAS DEPICT gene prioritization analysis or the TWAS FOCUS fine mapping analysis for F4 (the latent genetic factor relating to adiposity). For visualization of this network we removed drugs that did not have ‘launched’ clinical phase in the Drug Repurposing Hub (DRH) or ‘approved’ status in the Drug-Gene Interaction Database (DGIdb), for a total of 733 drug-gene pairs (451 identified in the DRH [purple edges], 192 identified in the DGIdb [orange edges], and 90 identified by both [red edges]) between 529 drugs and 151 genes significant for F4. The gene vertices are colored grey, and the drug vertices are colored by their most frequent indication category in the MEDI-C database. Drugs vertices with weight-related adverse drug events (wADEs) listed in the OnSIDES database have a black border. Source data are provided as a Source Data file.

References

    1. Bryan, S. et al. NHSR. National Health and Nutrition Examination Survey 2017–March 2020 Pre-Pandemic Data Files. https://stacks.cdc.gov/view/cdc/106273 (2021).
    1. Loos, R. J. F. & Yeo, G. S. H. The genetics of obesity: from discovery to biology. Nat. Rev. Genet.23, 120–133 (2022). - PMC - PubMed
    1. CDC. Obesity is a common, serious, and costly disease. Cent. Dis. Control Prev.https://www.cdc.gov/obesity/data/adult.html (2022).
    1. Khera, A. V. et al. Polygenic prediction of weight and obesity trajectories from birth to adulthood. Cell177, 587–596.e9 (2019). - PMC - PubMed
    1. Couto Alves, A. et al. GWAS on longitudinal growth traits reveals different genetic factors influencing infant, child, and adult BMI. Sci. Adv.5, eaaw3095 (2019). - PMC - PubMed

LinkOut - more resources