. 2025 Aug 12;8(1):1203.
doi: 10.1038/s42003-025-08544-4.

LRRK2-mutant microglia and neuromelanin synergize to drive dopaminergic neurodegeneration in an iPSC-based Parkinson's disease model

Affiliations

LRRK2-mutant microglia and neuromelanin synergize to drive dopaminergic neurodegeneration in an iPSC-based Parkinson's disease model

Lucas Blasco-Agell et al. Commun Biol. .

Abstract

Parkinson's disease (PD) is a progressive, incurable neurodegenerative disorder characterized by the loss of neuromelanin (NM)-containing dopamine neurons (DAn) in the substantia nigra of the midbrain. Non-neuronal cells are increasingly recognized as contributors to PD. We generated human microglia-like cells (hMG) from induced pluripotent stem cells (iPSC) derived from patients with LRRK2 PD-causing mutations, gene-corrected isogenic controls, and healthy donors. While neither genotype induced neurodegeneration in healthy DAn, LRRK2 hMG become hyperreactive to LPS stimulation, exhibiting increased cytokine expression, reactive oxygen species, and phagocytosis. When exposed to NM-containing particles, but not α-synuclein fibrils, LRRK2 hMG trigger DAn degeneration, in a process that is prevented by pre-treatment with the immunomodulatory drug ivermectin. Finally, post-mortem analysis of midbrain tissue of LRRK2-PD patients show increased microglia activation around NM-containing neurons, confirming our in vitro findings. Overall, our work highlights NM-activated microglia's role in PD progression, and provides a model for testing therapeutic targets.


Conflict of interest statement

Competing interests: The authors declare no competing interests.

Figures
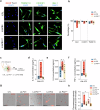
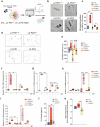
Fig. 1
Fig. 1. Characterization of hMG cells.
a Representative ICC images of iPSC-derived hMG after 7 days in culture from CTL (SP09), L2-PD (L2-PD1: SP12) and L2-PDcorr (L2-PD1corr: SP12wt/wt) iPSC lines staining positive for IBA-1, CX3CR1 or TMEM-119 (green) and negative for astrocytic (GFAP) or neuronal (TUJ1) markers. Nuclei are counterstained with DAPI (blue). Scale bar = 30 μm. b Percentage of hMG cells from CTL (SP09), L2-PD (L2-PD1: SP12; L2-PD2: SP13) and L2-PDcorr (L2-PD2corr: SP13wt/wt) lines expressing IBA-1, CX3CR1 or TMEM-119 in respect to DAPI. Individual data plotted, along with mean ± SEM. N = 3 of independent experiments, each experiment containing two technical duplicates. c Schematic representation of LPS stimulation (100 ng/ml). Cytokine profile for IL-1β (d), IL-6 (e) and TNF-α (f) of hMG from CTL (SP09), L2-PD (L2-PD1: SP12; L2-PD2: SP13) and L2-PDcorr (L2-PD2corr: SP13wt/wt) iPSC lines after 24 hours of LPS stimulation. Individual data plotted, along with mean ± SEM. One-way ANOVA with Uncorrected Fisher LSD test. N = 3 of independent experiments, each experiment containing two technical duplicates. g Representative Bright Field and Red fluorescent images of CTL (SP09), L2-PD1 (SP12), L2-PD1corr (SP12wt/wt), L2-PD2 (SP13), and L2-PD2corr (SP13wt/wt) hMG phagocyting pHrodo labelled SYNs after 150 minutes of exposure to SYNs (Scale bar = 25 μm). h pHRodo fluorescence intensity within hMG after 300 minutes comparing CTL (SP09), L2-PD1 (SP12), L2-PD1corr (SP12wt/wt), L2-PD2 (SP13), and L2-PD2corr (SP13wt/wt) hMG. Individual data plotted, along with mean ± SEM. Kruskal-Wallis non-parametric test with Uncorrected Dunn’s test. N = 3 of independent experiments, for some experiments two technical duplicates were measured. *p < 0.05, **p < 0.01. p-values over 0.1 (non-significant) are not shown.
Fig. 2
Fig. 2. L2-PD hMG increase neuromelanin particle phagocytosis and induce the expression of pro-inflammatory cytokines and ROS.
a Schematic representation of NM stimulation (5 ug/ml) and following analyses. b Representative Bright Field images of L2-PD1 (SP12), L2-PD1corr (SP12wt/wt), L2-PD2 (SP13), and L2-PD2corr (SP13wt/wt) hMG phagocyting NM particles for 16 hours (yellow arrow-heads for phagocyted particles; Scale bar = 25 μm). c NM particles uptaken by hMG over 16 hours comparing CTL (SP09), L2-PD1 (SP12), L2-PD1corr (SP12wt/wt), L2-PD2 (SP13), and L2-PD2corr (SP13wt/wt) hMG. Individual data plotted, along with mean ± SEM. One-way ANOVA with Uncorrected Fisher LSD test. N = 3 of independent experiments, for some experiments two technical duplicates were measured. d Spontaneous migration paths of L2-PD1 (SP12), L2-PD1corr (SP12wt/wt), L2-PD2 (SP13), and L2-PD2corr (SP13wt/wt) hMG. hMG were tracked for 16 h. The location of each cell was determined every 2 minutes and connected to depict its migration route. e Quantification of Euclidean distances (µm) comparing CTL (SP09), L2-PD1 (SP12), L2-PD1corr (SP12wt/wt), L2-PD2 (SP13), and L2-PD2corr (SP13wt/wt) hMG. Individual data plotted, along with mean ± SEM. Kruskal-Wallis non-parametric test with Uncorrected Dunn’s test. N = 3 of independent experiments, each dot represents a cell. Relative mRNA expression of pro-inflammatory cytokines TNF-α (f), IL-1β (g), C3 (h), and IL-6 (i) in L2-PD1 (SP12), L2-PD1corr (SP12wt/wt), L2-PD2 (SP13), and L2-PD2corr (SP13wt/wt) hMG at basal conditions or under NM stimulation for 24 hours. Individual data plotted, along with mean ± SEM. One-way ANOVA with Tukey multiple comparison test for (g) and (h); Kruskal-Wallis non-parametric test with Uncorrected Dunn’s test for (f) and (i). N = 3 of independent experiments, each experiment containing two technical duplicates. j. Levels of IL-6 released by hMG from CTL (SP09), L2-PD (L2-PD1: SP12; L2-PD2: SP13), and L2-PDcorr (L2-PD1corr: SP12wt/wt; L2-PD2corr SP13wt/wt) after being exposed to NM for 24 h. Individual data plotted, along with mean ± SEM. Kruskal-Wallis non-parametric test with Uncorrected Dunn’s test. N = 3 of independent experiments, each experiment containing two technical duplicates. k Intracellular ROS by DCFH-DA intensity after NM stimulation in CTL (SP09), L2-PD (L2-PD1: SP12; L2-PD2: SP13), and L2-PDcorr (L2-PD1corr: SP12wt/wt; L2-PD2corr SP13wt/wt) hMG. Results are represented as a fold change between NM stimulation for 24 hours over non-stimulated conditions. Individual data plotted, along with mean ± SEM. One-way ANOVA with Tukey’s multiple comparison test. N = 3 for CTL, N = 5 for L2-PD, and N = 7 for L2-PDcorr of independent experiments. *p < 0.05, **p < 0.01, ***p < 0.001, ****p < 0.0001. p-value is specified for values between 0.05 and 0.1. p-values over 0.1 (non-significant) are not shown.
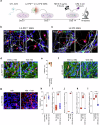
Fig. 3
Fig. 3. L2-PD hMG exposed to NM induce dopaminergic degeneration in an iPSC-derived 2D neuron/hMG co-culture system.
a Schematic representation of the co-culture system and neuromelanin (NM) or Ivermectin (IVM) stimulation. Briefly, CTL (SP11) vmDAn were plated on top of astrocytes feeder layer on Day 0. One week later, L2-PD (L2-PD2: SP13) or L2-PDcorr (L2-PD2corr: SP13wt/wt) hMG were plated on top of vmDAn and exposed to NM at Day 14 for 8 hours, with or without treatment with IVM for 6 hours. Representative ICC images of L2-PDcorr (L2-PD2corr: SP13wt/wt) (b) or L2-PD2 (L2-PD2: SP13) (c) IBA1+ hMG (Red) in culture with TH + CTL vmDAn (SP11, Green) under basal conditions. In white TUJ1 + neurons (scale bar = 25 μm). d Representative images of CTL TH+ vmDAn (SP11) upon culture with L2-PDcorr hMG (L2-PD2corr: SP13wt/wt), without or with NM (scale bar = 30 μm). e Quantification of percentage of TH+ population over the total number of MAP2+ neurons in culture with L2-PDcorr hMG (L2-PD2corr: SP13wt/wt), without or with NM. Individual data plotted, along with mean ± SEM. Mann-Whitney test. N = 3 independent experiments. f Representative images of CTL TH+ vmDAn (SP11) upon culture with L2-PD hMG (L2-PD2: SP13), without or with NM (scale bar = 30 μm). g Representative images of CTL vmDAn (TH + , SP11) cultured with L2-PD hMG (L2-PD2: SP13) upon addition of NM or treatment with IVM and NM (Scale bar=25 μm). h Quantification of percentage of TH+ population over the total number of MAP2+ neurons in culture with L2-PD hMG (L2-PD2: SP13), under basal condition, upon addition of NM or treatment with IVM and NM. Individual data plotted, along with mean ± SEM. One-way ANOVA with Tukey multiple comparison test. N = 3 independent experiments. Relative mRNA expression of pro-inflammatory cytokines IL-6 (i), IL-1β (j), TNFα (k) and C3 (l) in L2-PD (L2-PD1: SP12) hMG at basal level, upon addition of NM, or upon treatment with IVM and NM. Individual data plotted, along with mean ± SEM. N = 3 independent experiments. One-way ANOVA with Tukey multiple comparison test for (k) and (l); Kruskal-Wallis non-parametric test with Uncorrected Dunn’s test for (i) and (j). *p < 0.05, **p < 0.01, ***p < 0.001. ****p < 0.0001. p-value is specified for values between 0.05 and 0.1. p-values over 0.1 (non-significant) are not shown.
Fig. 4
Fig. 4. Microglial activation is increased in L2-PD patient post-mortem brains.
a Representative image of IBA-1+ cells (in blue; unstained NM in brown) from control, iPD and L2-PD human brains showing ramified (white arrowhead) or amoeboid (black arrowhead) morphologies. Grey arrowheads indicate NM-laden neurons. Scale bar = 50 μm; 20 μm. b Total number of IBA-1+ cells/mm2 in post-mortem human brains from control subjects, iPD and L2-PD patients. c Number of IBA-1+ cells/mm2 displaying amoeboid morphologies in control, iPD and L2-PD brains. d Number of IBA-1+ cells/mm2 displaying ramified morphologies in control, iPD and L2-PD brains. e Difference in the number of IBA-1+ cells/mm2 displaying amoeboid morphologies in areas close to rNM vs areas distant from it. f Representative image of a quantification area close to rNM. N = 30 Control subjects, N = 9 iPD patients and N = 6 L2-PD patients. Individual data plotted, along with mean ± SEM. Individual data plotted, along with mean ± SEM. Scale bar = 25 μm. In b and c, One-Way ANOVA with Tukey’s multiple comparison test; In e, Kruskal-Wallis with Dunn’s multiple comparisons test; *p < 0.05, **p < 0.01, ***p < 0.001. p-values over 0.1 (non-significant) are not shown.

References

    1. Dickson, D. W. Neuropathology of Parkinson disease. Parkinsonism Relat. Disord.46, S30–S33 (2018). - PMC - PubMed
    1. Tansey, M. G. et al. Inflammation and immune dysfunction in Parkinson disease. Nat. Rev. Immunol.22, 657–673 (2022). - PMC - PubMed
    1. Pang, S. Y.-Y. et al. The interplay of aging, genetics and environmental factors in the pathogenesis of Parkinson’s disease. Transl. Neurodegener.8, 23 (2019). - PMC - PubMed
    1. Skrahina, V. et al. The Rostock International Parkinson’s Disease (ROPAD) study: protocol and initial findings. Mov. Disord.36, 1005–1010 (2021). - PMC - PubMed
    1. Wallings, R., Manzoni, C. & Bandopadhyay, R. Cellular processes associated with LRRK2 function and dysfunction. FEBS J.282, 2806–2826 (2015). - PMC - PubMed

MeSH terms