. 2025 Aug 12;8(1):1199.
doi: 10.1038/s42003-025-08661-0.

C-type natriuretic peptide attenuates enhanced glycolysis and de novo pyrimidine synthesis in pericytes of patients with pulmonary arterial hypertension

Affiliations

C-type natriuretic peptide attenuates enhanced glycolysis and de novo pyrimidine synthesis in pericytes of patients with pulmonary arterial hypertension

Minhee Noh et al. Commun Biol. .

Abstract

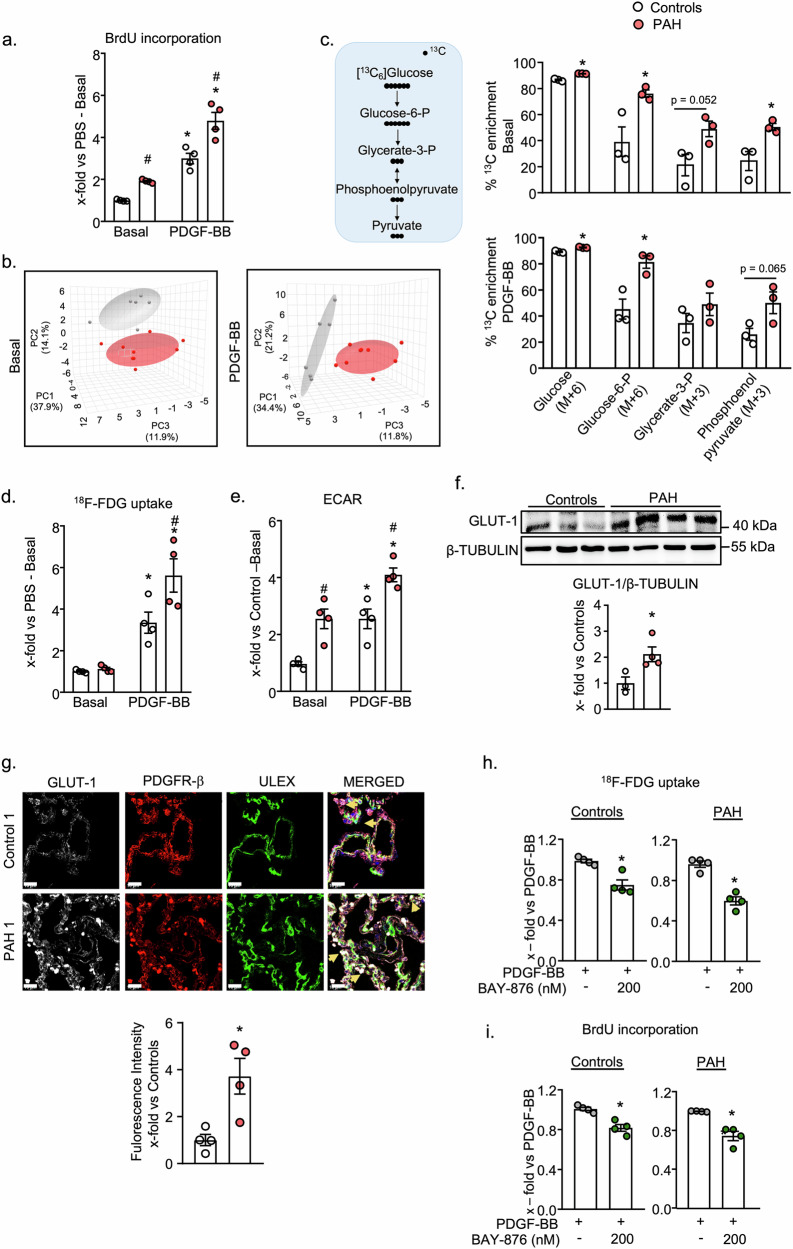
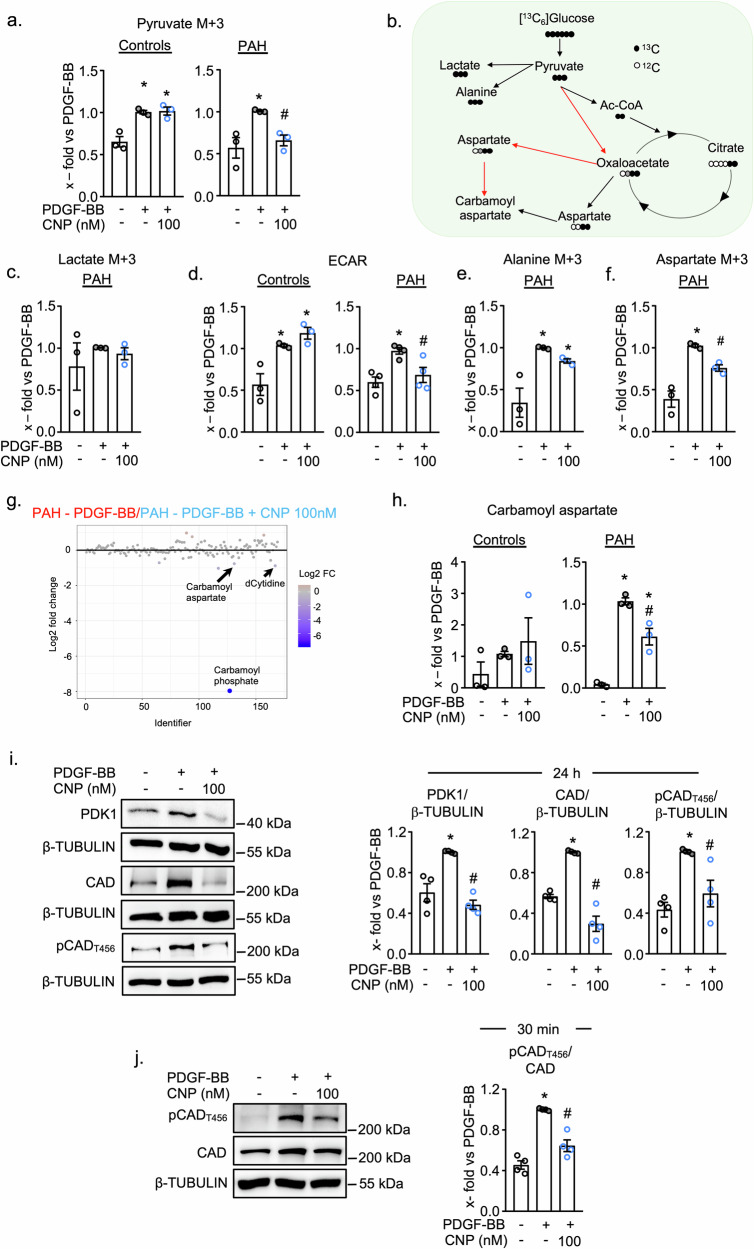
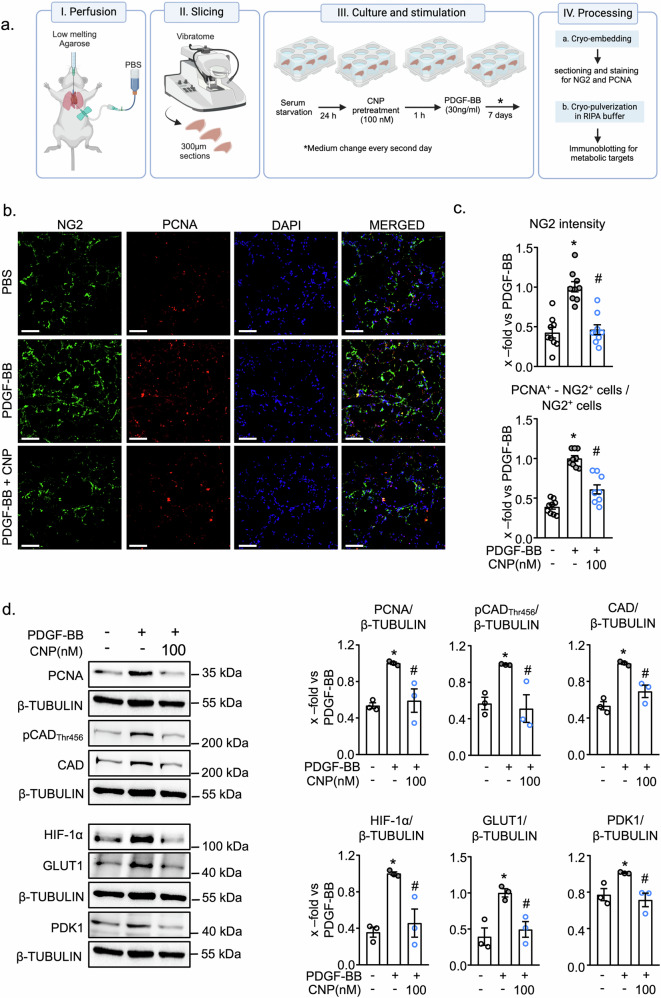
Metabolic reprogramming of vascular cells plays a crucial role in Pulmonary Arterial Hypertension (PAH), marked by a shift from oxidative phosphorylation to glycolysis (Warburg effect), altered purine biosynthesis, impaired glutaminolysis and fatty acid oxidation, driving endothelial and smooth muscle cell hyperproliferation. The metabolic alterations underlying pericyte dysfunction in PAH remain largely unexplored. Here, we investigated the metabolic alterations in PAH lung pericytes and the impact of C-type natriuretic peptide (CNP) and Guanylyl Cyclase-B/cyclic GMP signaling on these changes. Our results demonstrate that PAH pericytes exhibit increased glucose uptake, glycolysis, and de novo pyrimidine synthesis, promoting their hyperproliferation. These changes are driven by the upregulated glucose transporter, GLUT-1 and Pyruvate dehydrogenase kinase 1, along with enhanced CAD (Carbamoyl-phosphate synthetase 2, Aspartate transcarbamoylase, and Dihydroorotase) activity, both in vitro and in situ. CNP counteracts these alterations through activation of cGMP-dependent kinase I, reducing HIF-1α and GLUT-1 expression and thereby glucose uptake. Additionally, CNP activates Phosphodiesterase 2 A and thereby inhibits CAD activation and de novo pyrimidine synthesis. Accordingly, CNP prevented growth factor-induced proliferation and metabolic changes in murine pericytes within precision-cut lung slices. This study highlights dysregulated metabolic pathways in PAH pericytes and the therapeutic potential of CNP.


Conflict of interest statement

Competing interests: The authors declare no competing interests.

Figures

Fig. 1
Fig. 1. Cultured hyperproliferative PAH lung pericytes exhibit distinct metabolic profile, higher glycolytic 13C labeling and GLUT-1 expression in comparison to control pericytes.
a In comparison to control pericytes, PAH pericytes exhibit higher proliferation rates at baseline and in response to PDGF-BB (30 ng/ml, 24 h) (n = 4 biological replicates for control and PAH; 2 -way ANOVA). The new experiments illustrated in this panel reproduce findings from our earlier study (Dabral S et al. Commun Biol. 2024) for comparison and validation. b Score plots based on Principle Component Analysis (PCA) reveal distinct metabolic profiles of control (gray) and PAH (pink) pericytes under (b, left panel) baseline and (b, right panel) PDGF-BB stimulation on targeted metabolomics analysis. c Schematic representation of 13C labeling patterns after the metabolism of 13C6 -glucose through glycolysis (c, left panel) and percentage 13C enrichment in the glycolytic intermediates indicate increased isotope enrichment in PAH pericytes under basal conditions (c, upper right panel) and PDGF-BB stimulation (c, bottom right panel). Data are shown as percent isotope enrichment, normalized to the total signal (M + 0 to M + n). (for b and c, n = 3 controls and n = 3 PAH pericytes. c: unpaired Student’s t test). PAH pericytes had significantly higher glucose uptake (d) under PDGF-BB stimulation (30 ng/ml, 24 h) and increased aerobic glycolysis, Extracellular acidification rate (ECAR) (e) under both baseline and PDGF-BB stimulation (d: 18F-FDG glucose uptake assay, n = 4 controls and PAH; e BrdU incorporation assay, n = 4 controls and PAH; 2 -way ANOVA). f PAH pericytes exhibit higher glucose transporter, GLUT-1 protein expression compared to controls (n = 3 controls and n = 4 PAH patients; unpaired 2-tailed Student’s t test). g Representative immunofluorescence staining of GLUT-1 on control and IPAH patient lung tissues, followed by fluorescence quantification from n = 4 tissues from each group. GLUT-1 (white), PDGFR-β (red: pericyte marker), ULEX (green: endothelial stain), and nuclei were stained by DAPI (blue). Arrows indicate the colocalization of PDGFR-β with GLUT-1. Scale bar = 20 µm. BAY 876 (200 nM, 30 min) attenuated PDGF-BB (30 ng/ml) induced glucose uptake (h), and proliferation (i) of control and PAH pericytes (h: 18F-FDG glucose uptake assay, i: BrdU incorporation assay, n = 4 controls and 4 PAH; unpaired Student’s t test). For a, d, e: *p < 0.05 vs PBS-Control, #p < 0.05 vs PDGF-BB-Control. For c, f and g: *p < 0.05 vs Controls. For h and i *p < 0.05 vs PDGF-BB. Data is presented as Mean ± SEM.
Fig. 2
Fig. 2. PAH pericytes demonstrate increased de novo pyrimidine synthesis and CAD protein phosphorylation.
a Metabolic pathways enriched in PAH pericytes under PDGF-BB stimulation versus controls based on quantitative metabolite set enrichment analysis using MetaboAnalyst 6.0. The corresponding fold enrichments and computed p values are depicted. b Fold change analysis using Metaboanalyst 6.0 shows significantly upregulated metabolites in PAH pericytes in comparison to control cells under baseline (b, upper panel) and PDGF-BB stimulation (c, lower panel). Red circles represent metabolites above the threshold. c Schematic representation of 13C labeling patterns after the metabolism of 13C6 -glucose through de novo pyrimidine synthesis. d Normalized peak areas of 13C-labeled pyrimidine metabolites, as measured by targeted LC-MS, in control and PAH pericytes stimulated with PDGF-BB and labeled with 13C6 glucose depicting upregulated (M + 5) and (M + 2) labeled pyrimidines and unchanged (M + 1) labeled pyrimidines (n = 3 controls and PAH, unpaired 2-tailed Student’s t test). e Schematic illustration highlighting the investigated enzymes. Created with Biorender.com. f CAD phosphorylation at Threonine 456 was significantly increased in cultured PAH pericytes compared to controls with no difference in CAD protein expression. (n = 3 controls and n = 4 PAH patients; unpaired 2-tailed Student’s t test). g Representative immunofluorescence staining of pCADThr456 on control and IPAH patient lung tissues, followed by fluorescence quantification from n = 4 tissues from each group. pCADThr456 (white), PDGFR-β (red: pericyte marker), ULEX (green: endothelial stain), and nuclei were stained by DAPI (blue). Arrows indicate the colocalization of PDGFR-β with pCADThr456. Scale bar = 20 µm. h Transfection of PAH pericytes with siCAD reduced CAD protein expression (n  =  4 biological replicates; 1-way ANOVA), and (i) this inhibited PDGF-BB induced proliferation in PAH pericytes but not in control cells (n  =   4 control and PAH pericytes; 2-way ANOVA). For d: *p < 0.05 vs Controls – PDGF-BB. For f and g: *p < 0.05 vs Controls. For h: *p  <  0.05 vs. untransfected control (–), #p  <  0.05 vs. si-Control. For i *p  <  0.05 vs. PBS (–), #p  <  0.05 vs. si-Control-PDGF-BB, $p 0.05 vs. similar treatment. Data is presented as Mean ± SEM.
Fig. 3
Fig. 3. CNP prevents PDGF-BB induced glucose uptake and glucose transporter, GLUT1 expression in a cGKI - HIF-1α dependent manner.
CNP (100 nM, 30 min pretreatment) prevented PDGF-BB (30 ng/ml, 24 h) induced (a) proliferation, (b) glucose uptake and (c) GLUT-1 mRNA expression in control (left panels) and PAH pericytes (right panels). (a: BrdU incorporation; b: 18F-FDG glucose uptake; c: qRT PCRs. n = 4 from controls and PAH, 1-way ANOVA). d Immunoblotting: CNP (100 nM, 30 min) prevented the PDGF-BB (30 ng/ml, 24 h)—induced GLUT-1 and its regulator, HIF-1α expression in control and PAH pericytes (n = 4 control and PAH, 1-way ANOVA). a The new experiments illustrated in this panel reproduce findings from our earlier study (Dabral S et al. Commun Biol. 2024) for comparison and validation. e Scheme of the postulated and investigated signaling pathway. Created with Biorender.com (https://BioRender.com/3ripqtn). f AKT inhibitor (Akti-1, 5 μM) and mTORC inhibitor (Rapamycin, 100 nM) prevent PDGF-BB induced HIF-1α and GLUT-1 expression in control pericytes (n = 6; 1-way ANOVA). g cGKI inhibitor Rp-8-Br-PET-cGMPS (10 µM), prevented the effect of CNP on PDGF-BB (30 ng/ml, 24 h) - induced HIF-1α and GLUT-1 expression (n = 6; 2-way ANOVA). For a, b, c, d, and f: *p  <  0.05 vs. PBS (–), #p  <  0.05 vs. si-Control-PDGF-BB. For g: *p < 0.05 vs PBS (–), #p < 0.05 vs PDGF-BB, $p < 0.05 vs corresponding vehicle-treated group (–). Data is presented as Mean ± SEM.
Fig. 4
Fig. 4. CNP prevents PDGF-BB induced pyruvate utilization for lactate and aspartate in PAH pericytes by regulation of PDK1 expression and CAD phosphorylation.
a Schematic overview of fate of pyruvate (M + 3). b CNP pretreatment reduces PDGF-BB induced increase in pyruvate (M + 3) in PAH pericytes, with no effect in control pericytes. (n = 3 controls and PAH; 1–way ANOVA). b PDGF-BB has no effect on intracellular lactate (M + 3) in PAH pericytes (n = 3 PAH; 1–way ANOVA). c CNP pretreatment reduces PDGF-BB induced aerobic glycolysis only in PAH pericytes, with no effect in control pericytes. (n = 3 control and 4 PAH; 1 – way ANOVA) (e and f) PDGF-BB stimulated increase in (e) alanine (M + 3) and (f) aspartate (M + 3) and CNP prevented this effect only on aspartate. (n = 3 PAH; 1 – way ANOVA). g Fold change analysis using Metaboanalyst 6.0 shows significantly downregulated metabolites in CNP pretreated PAH pericytes in comparison to PDGF-BB stimulated PAH cells. Blue circles represent metabolites above the threshold. h CNP reduced PDGF-BB induced carbamoyl aspartate metabolite levels in PAH pericytes but not in controls (n = 3 control and PAH; 1 – way ANOVA). i Pretreatment with CNP prevented the PDGF-BB (30 ng/ml, 24 h) induced CAD phosphorylation (Thr456) as well as CAD and PDK1 expression. j CNP prevented PDGF-BB (30 ng/ml, 30 min) induced CAD phosphorylation (for i and j: n = 4 biological replicates; 1-way ANOVA). For b, c, d, e, f, h, I, and j: *p  <  0.05 vs. PBS (–), #p  <  0.05 vs. PDGF-BB. Data is presented as Mean ± SEM.
Fig. 5
Fig. 5. CNP prevents CAD phosphorylation via PDE2 mediated reduced cAMP/EPAC/MEK signaling in PAH pericytes.
a Lung pericytes isolated from PAH patients exhibit higher PDE2A expression (n = 3 control pericytes, n = 4 PAH pericytes; unpaired 2-tailed Student’s t test). b CNP (10 min) significantly reduced cAMP levels which was reversed by PDE2 inhibitor, BAY 60-7550 (100 nM, 20 min pretreatment) (n = 4 PAH, 1-way ANOVA). c BAY-60-7550 (PDE2 inhibitor, 100 nM) attenuated the inhibitory effects of CNP on PDGF-BB-induced proliferation of PAH pericytes as analysed by BrdU incorporation assay (n = 4 biological replicates; 2-way ANOVA). d PDGF-BB (5 min) significantly increased cellular cAMP levels which was attenuated by 10 min CNP 100 nM pretreatment (n = 4 PAH, 1-way ANOVA). e Scheme of the postulated and investigated signaling pathway. Created in BioRender (https://BioRender.com/3ripqtn). f PDGF-BB (30 ng/ml, 30 min) increased CAD and ERK1/2 phosphorylation which was prevented by EPAC inhibitor (ESI-09, 1 μM) and MEK inhibitor (PD-98059, 10 μM) (n  =   4 PAH pericytes; 2-way ANOVA). g PDE2 inhibitor BAY60-550 (100 nM) prevented the effect of CNP on PDGF-BB (30 ng/ml, 30 min)-induced phosphorylation of CAD (Thr456) and ERK1/2 (Thr202/Tyr204) (n  =  4 PAH pericytes; 2-way ANOVA). For a: *p < 0.05 vs Controls. For b: *p  <  0.05 vs. PBS (–), #p  <  0.05 vs. Vehicle CNP 100 nM. For c, d, f: *p  <  0.05 vs. PBS (–), #p  <  0.05 vs. PDGF-BB. For g: *p < 0.05 vs PBS (–), #p < 0.05 vs PDGF-BB, $p < 0.05 vs corresponding vehicle-treated group (–). Data is presented as Mean ± SEM.
Fig. 6
Fig. 6. Exogenous CNP attenuates PDGF-BB induced pericyte proliferation and metabolic gene expression in ex vivo cultured murine precision cut lung slices (PCLS).
a Schematic overview of experimental design. Created with Biorender.com (https://BioRender.com/bjgvpyp). b Representative images of NG2 (green) and PCNA (red) in murine lung sections (Scale bar 100 μm). Images were acquired with Leica SP8 confocal microscope and processed with Image J. c CNP (100 nM) prevented PDGF-BB (30 ng/ml) mediated increase in pericyte proliferation as analyzed by co-staining of Neural/glial antigen 2, NG2 (pericyte marker) with proliferating cell nuclear antigen, PCNA (proliferation marker). (n  =  9 from 3 PCLS from 3 mice. Each value is a mean of 3 images; 1-way ANOVA). d PDGF-BB stimulated CAD phosphorylation and expression of PCNA, CAD, HIF-1α, GLUT-1 and PDK1 in PCLS which was prevented by CNP (100 nM) (n = 3 PCLS from 3 mice; 1-way ANOVA). For c, d: *p < 0.05 vs PBS, #p < 0.05 vs PDGF-BB. Data is presented as Mean ± SEM.

Similar articles

References

    1. Liu, X., Zhang, L. & Zhang, W. Metabolic reprogramming: A novel metabolic model for pulmonary hypertension. Front Cardiovasc Med. 9, 957524 (2022). - PMC - PubMed
    1. Xu, W., Janocha, A. J. & Erzurum, S. C. Metabolism in pulmonary hypertension. Annu Rev. Physiol.83, 551–576 (2021). - PMC - PubMed
    1. Archer, S. L. Pyruvate kinase and warburg metabolism in pulmonary arterial hypertension: Uncoupled glycolysis and the cancer-like phenotype of pulmonary arterial hypertension. Circulation136, 2486–2490 (2017). - PMC - PubMed
    1. Pullamsetti, S. S., Mamazhakypov, A., Weissmann, N., Seeger, W. & Savai, R. Hypoxia-inducible factor signaling in pulmonary hypertension. J. Clin. Invest130, 5638–5651 (2020). - PMC - PubMed
    1. Ma, Q. et al. Purine synthesis suppression reduces the development and progression of pulmonary hypertension in rodent models. Eur. Heart J.44, 1265–1279 (2023). - PMC - PubMed

LinkOut - more resources