. 2025 Sep;26(9):1540-1552.
doi: 10.1038/s41590-025-02234-3. Epub 2025 Aug 12.

TNF and type I interferon crosstalk controls the fate and function of plasmacytoid dendritic cells

Affiliations

TNF and type I interferon crosstalk controls the fate and function of plasmacytoid dendritic cells

Rebeca Arroyo Hornero et al. Nat Immunol. 2025 Sep.

Erratum in

Abstract

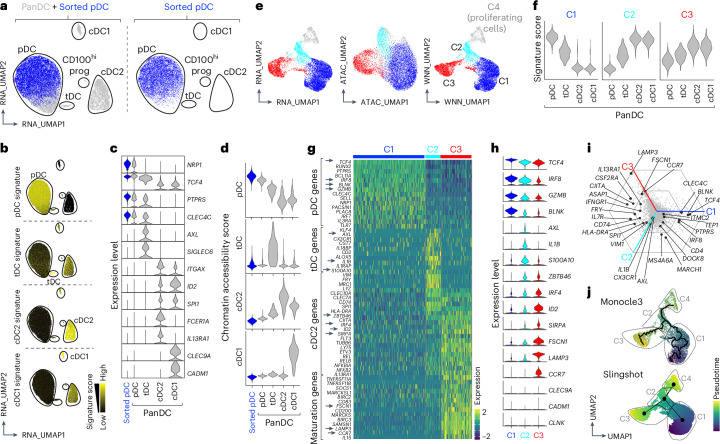
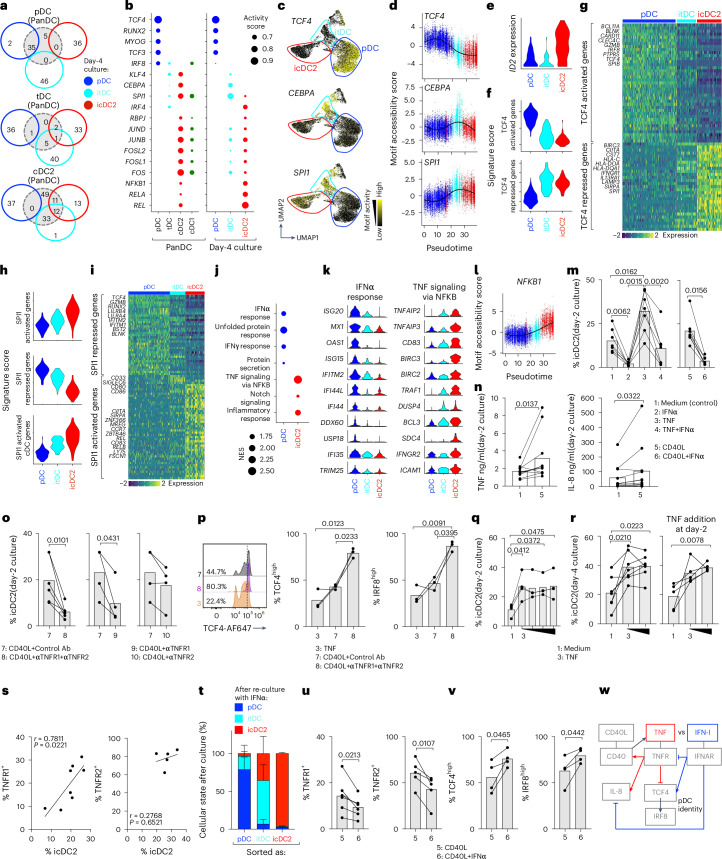
Plasmacytoid dendritic cells (pDCs) are major producers of type I interferon (IFN-I), an important antiviral cytokine, and activity of these cells must be tightly controlled to prevent harmful inflammation and autoimmunity. Evidence exists that one regulatory mechanism is a fate-switching process from an IFN-I-secreting pDC to a professional antigen-presenting conventional dendritic cell (cDC) that lacks IFN-I-secreting capacity. However, this differentiation process is controversial owing to limitations in tracking the fate of individual cells over time. Here we use single-cell omics and functional experiments to show that activated human pDCs can lose their identity as IFN-I-secreting cells and acquire the transcriptional, epigenetic and functional features of cDCs. This pDC fate-switching process is promoted by tumor necrosis factor but blocked by IFN-I. Importantly, it occurs in vivo during human skin inflammatory diseases and injury, and physiologically in elderly people. This work identifies the pDC-to-cDC reprogramming trajectory and unveils a mechanistic framework for harnessing it therapeutically.


Conflict of interest statement

Competing interests: J.I. serves on the scientific advisory board of Immunitas Therapeutics; this affiliation is unrelated to the present work. The other authors declare no competing interests.

Figures

Fig. 1
Fig. 1. Conversion of pDCs into icDC2s on activation.
ad, snMultiome–seq of freshly isolated panDCs and pDCs (Extended Data Figs. 1 and 2a,b). a, Uniform Manifold Approximation and Projection (UMAP) of integrated panDC and pDC (left) or pDC-only (right) snRNA-seq. b, Signature score for DC subsets on integrated panDC and pDC UMAP (Supplementary Table 1). c, Expression of selected genes across DC subsets in panDC (gray) and pDC (blue) snRNA-seq. d, Chromatin accessibility signature score for integrated panDC (gray) and pDC (blue) snATAC–seq. ej, snMultiome–seq of pDCs cultured for 4 d with CD40L (Extended Data Fig. 2c–g). e, UMAP of gene expression (left), chromatin accessibility (middle) and their integrated weighted nearest neighbor (WNN) profiles (right), colored by unsupervised clustering on WNN. f, Signature score for clusters C1–C3 (Supplementary Table 2) projected onto panDC snRNA-seq. gh, Heatmap (g) and violin plots (h) of selected genes from clusters C1–C3. i, Barycentric plot showing relative gene expression. j, WNN UMAP with trajectory and pseudotime calculated by Monocle3 and Slingshot. Prog, progenitors.
Fig. 2
Fig. 2. The icDC2s are a stable endpoint of pDC differentiation.
a, Scaffold map of CyTOF data from pDCs cultured 6 d with CD40L (one of three donors, three experimental). b, Marker enrichment modeling scores for cells falling within pDC, tDC and cDC2 clusters from a. c, CyTOF gating strategy for pDCs, itDCs and icDC2s based on CD33 and CD11c. d, Flow cytometry expression of CD33 and CD11c in pDCs cultured with CD40L for 0, 2, 4, or 6 d. The middle and bottom plots show staining controls (five donors, five experimental). e, SMART–seq2 experimental setup: pDCs from two blood donors cultured 2 d with CD40L and single-cell sorted (scFACS) as pDCs, itDCs or icDC2s (gating in d). Fresh pDCs and tDCs were also scFACS and sequenced. f, SMART–seq2 UMAP colored by unsupervised clustering. g,h, Signature scores of panDC snMultiome–seq populations (g) and day 4 culture clusters C1–C3 (h) projected onto SMART–seq2 clusters. i, Heatmap of top 100 DEGs between SMART–seq2 clusters C1–C3. j, Correlation between sorted cell types and SMART–seq2 clusters C1–C3. k, Flow cytometry protein expression in day 4 cultures with numbers indicating geometric mean fluorescence intensity (gMFI) or percentage of positive cells (1 of 9 (BDCA2), 1 of 4 (BDCA4), 1 of 5 (LILRA4, CD62L), 1 of 7 (CD172a, CLEC10A) and 1 of 14 (HLA-DR) donors; 4–14 experimental; Extended Data Fig. 3d). l, FACS purification strategy (day 4; left); CD33 and CD11c profiles post-sort (day 4) and after re-culture with CD40L (right, day 6) (one of five donors, five experimental). m, As in l, but percentage of pDCs, itDCs and icDC2s after re-culturing with CD40L (n = 5 donors, 5 experimental) or medium (IL-3) alone (n = 4 donors, 4 experimental) (mean + s.d.; Extended Data Fig. 4a–e). n, Pie charts of pDC, itDC and icDC2 frequencies over time (top), with Ki67+ (middle) and CTVlow (bottom) fractions (n = 3 donors, 3 experimental). o, As in n, but representative CTV histogram for a donor. p, Single-cell differentiation assay: sorted CTV-labeled pDCs were plated at 1–5,000 cells per well with CFSE-labeled filler (F) pDCs and cultured for 4 d. The bar graphs show the percentage of pDCs, itDCs and icDC2s among CTV+ cells; the numbers on top indicate recovered cells (n = 4 donors, 4 experimental). Source data
Fig. 3
Fig. 3. Conversion of pDCs into functional cDCs.
a, Cytology (scale, 10 µm) and scanning electron microscopy (scale, 1 µm) of freshly isolated and day 6 culture cells, FACS purified (n = 1 of 2 donors; 2 experimental). b, Circularity index of freshly isolated pDCs (n = 25 cells) and cDC2s (n = 32 cells) and day 6-culture pDCs (n = 43 cells), itDCs (n = 26 cells) and icDC2s (n = 21 cells). Each dot represents a single cell (one of two donors). c, GSEA of GO pathways between SMART–seq2 clusters C1 and C3. d, Expression of selected genes from c. e, IFNα secretion measured after 24-h re-stimulation of pDCs and icDC2s (FACS purified at day 4) with CpG-A, normalized to the cell number per condition (n = 5 donors, 5 experimental). f, Flow cytometry protein expression in day 4 cultures (gMFI; one of six (CD80, CD40) and one of seven (CD86) donors; six to seven experimental; Extended Data Fig. 3d). g, Uptake of apoptotic autologous (n = 5 donors, 5 experimental), apoptotic xenogeneic (n = 5 donors, 5 experimental), S. aureus (n = 6 donors, 6 experimental) and processing of DQ-OVA (n = 5 donors, 5 experimental) by day 4 cultures relative to 4 °C controls (Extended Data Fig. 5c–f). h, As in g, but using freshly isolated DCs (n = 4 donors, 4 experimental; Extended Data Fig. 6d). i, Experimental setup for autologous naive T cell priming (left) and a representative plot (right). j, Percentage of CFSElow CD4+ T cells and CD25+CD4+ T cells from i (n = 5 donors, 5 experimental). k, As in j, but using freshly isolated DC subsets (n = 3 donors, 3 experimental; Extended Data Fig. 6c). l, Flow cytometry protein expression in day 4 cultures (n = 13 donors, 13 experimental; Extended Data Fig. 3d). m, Migration of day 4 cultures in transwell assay with CCL2, CCL19 + CCL21 or medium alone (IL-3). Left, experimental setup. Middle, percentage of total cells that migrated (receiver) or remained (insert). Right, migrating relative to total cells for each subset (n = 6 donors, 6 experimental). Statistical tests show mean ± s.d. throughout.: Kruskal–Wallis test with Dunn’s test (b); two-sided, paired Student’s t-test (e,h,j, CD25+; k, CD25+); paired one-way analysis of variance (ANOVA) with Tukey’s test (g,j, CFSElow, k; %CFSElow, l); and mixed-effects model with the Geisser–Greenhouse correction and Tukey’s multiple-comparison test (m). Ag, antigen; NES, normalized enrichment score; GSEA, Gene Set Enrichment Analysis; GO, Gene Ontology. Source data
Fig. 4
Fig. 4. Fate switching of pDCs is triggered by TNF and blocked by IFN-I.
a, Venn diagrams showing overlap of active TFs between freshly isolated DCs and day 4 cultures, analyzed by snMultiome–seq (Extended Data Fig. 7a). b, TF activity score from a. The dot size corresponds to average chromVAR motif accessibility and gene expression scores. c, Motif accessibility score onto the UMAP of Fig. 1e. d, Motif accessibility score against pseudotime for clusters C1–C3 (snMultiome–seq). e, ID2 expression on day 2 cultures (SMART–seq2). f,g, Signature score of TCF4-regulated genes (f) and heatmap of selected TCF4-regulated genes (g), by SMART–seq2 (Extended Data Fig. 7c). h,i, Signature score (h) and heatmap (i) of SPI1-regulated genes (SMART–seq2) (Extended Data Fig. 7d). j, GSEA of selected pathways between pDCs and icDC2s (SMART–seq2). k, Expression of selected genes from j. l, Motif accessibility score versus pseudotime for clusters C1–C3 on snMultiome–seq (Extended Data Fig. 7e). m, Percentage of icDC2s in day 2 cultures with indicated cytokines (n = 7 donors, 7 experimental). n, TNF and IL-8 secretion in day 2 cultures (n = 11 donors, 11 experimental). o, Percentage of icDC2 in day 2 cultures with CD40L plus control antibodies (n = 6, 6 experimental), anti-TNFR1 and TNFR2 antibodies (n = 6 donors, 6 experimental), anti-TNFR1 antibodies (n = 4 donors, 4 experimental) and anti-TNFR2 antibodies (n = 4 donors, 4 experimental). p, Percentage TCF4hi and IRF8hi cells in day 2 cultures (n = 3 donors, 3 experimental), with representative flow cytometry plot (one of three donors). q, Percentage icDC2s in day 2 cultures with increasing TNF concentrations (2, 20, 200 and 2,000 ng ml−1) (n = 4 donors, 4 experimental). r, Percentage of icDC2 in day 4 cultures with increasing TNF concentrations (200 or 2,000 ng ml−1; n = 7 donors, 7 experimental; left) and with a second TNF dose added at day 2 (200 or 2,000 ng ml−1, respectively; n = 5 donors, 5 experimental; right). s, Correlation between TNFR1 (n = 8 donors, 8 experimental) or TNFR2 (n = 5 donors, 5 experimental) expression and icDC2 frequencies in day 2 cultures. t, Day 4-sorted pDCs (n = 4 donors, 4 experimental), itDCs (n = 3 donors, 3 experimental) and icDC2s (n = 4 donors, 4 experimental) re-cultured with IFNα for 2 additional days (analyzed on day 6). u, TNFR1+ (n = 6 donors, 6 experimental) and TNFR2+ (n = 5 donors, 5 experimental) cells in day 2 cultures, with or without IFNα. v, Percentage TCF4hi and IRF8hi cells in day 4 cultures (n = 4 donors, 4 experimental). w, Schematic of proposed TNF or IFN-I regulation of pDC fate. Statistical tests give the mean + s.d. throughout and are as follows: two-sided, Wilcoxon’s matched-pairs sign-rank test (m: groups 5–6; n); two-sided, paired Student’s t-test (o,u,v); paired one-way ANOVA with Tukey’s test (m: groups 1–4, p,r); paired one-way ANOVA with Dunnett’s test (q); and Pearson’s correlation (s). Source data
Fig. 5
Fig. 5. Fate switching of pDCs occurs during wounding.
Analysis of a public SMART–seq2 dataset of CD123hi pDCs (blue) and CD123int DCs (orange) isolated from human skin blister fluid. Blisters were challenged with saline or HDM. a, Signature score of day 2-culture pDCs, itDCs and icDC2s (SMART–seq2) and the ‘TNF signaling via NF-κB’ MSigDB gene set projected onto the saline blister dataset. b,c, Expression of selected genes from a depicted as a heatmap (b) or violin plots (c). d, As in a, but signature scores onto the HDM-challenged blister dataset. e, Within the HDM blisters, CD123hi pDCs were split into ‘high’, ‘middle’ and ‘low’ groups based on the panDC-pDC signature score (Extended Data Fig. 9i). Signature score of day 2-culture pDCs, itDCs and icDC2s (SMART–seq2) and the ‘TNF signaling via NF-κB’ MSigDB gene set. f, Expression of selected genes from e. g, Signature score of TCF4-regulated or SPI1-regulated cDC genes projected onto the HDM-challenged blister dataset. h, Correlation between the day 2-culture icDC2 transcriptional signature and the pDC or ‘TNF signaling via NF-κB’ signatures in saline and HDM blisters (Pearson’s correlation). i, Pseudotime trajectory analysis (Monocle3): expression of indicated gene signatures along pseudotime (saline and HDM datasets combined). HDM, house dust mite.
Fig. 6
Fig. 6. Loss of pDC identity during aging.
ac, Bulk RNA-seq and ATAC–seq were performed on sorted pDCs from six adult (age 24–30 years) and six elderly (age 73–89 years) donors (Extended Data Fig. 10a). a, Signature score of day 2 SMART–seq2 clusters projected onto bulk RNA-seq of adult and elderly donors. b, GSEA of the top two pathways differentially active between adult and elderly pDCs and heatmap of selected genes. c, Motif accessibility score of NF-κB1 computed from bulk ATAC–seq (Extended Data Fig. 10b). dh, Circulating pDCs from adult (n = 6 donors, age 25–41 years) and elderly (n = 6 donors, age 62–78 years) donors analyzed by CyTOF. d, UMAP of DC populations clustered by FlowSOM. e, UMAPs colored by relative protein expression (ArcSin). f, Bubble plot of key protein markers distinguishing clusters in d. g, UMAPs highlighting pDCs (top), CD123 (middle) or human leukocyte antigen (HLA)-DR (bottom) expression in adult and elderly donors. h, Bubble plot of protein expression in pDCs from adult or elderly donors (tDCs plotted as controls). i, Geometric MFI of TCF4 and IRF8 in pDCs from adult (n = 6 donors) and elderly (n = 9 donors; 1 cohort out of 2; Extended Data Fig. 10d) donors, by flow cytometry. j, Circulating pDCs from adult (n = 10 donors, 10 experimental) and elderly (n = 18 donors, 18 experimental) donors by flow cytometry. k,l, FACS-purified pDCs from adult (age 27–40 years; n = 21 experimental) and elderly (age >75 years; n = 4 experimental) donors cultured with CD40L for 4 d. k, Percentage of icDC2s from adult (n = 9 donors, 9 experimental) and elderly (n = 4 donors, 4 experimental) donors. l, Uptake of live xenogeneic cells (n = 6 adult donors in 6 experimental and 4 elderly donors in 4 experimental), apoptotic xenogeneic cells (n = 5 adult donors in 5 experimental and 4 elderly donors in 4 experimental), S. aureus (n = 6 adult donors in 6 experimental and 4 elderly donors in 4 experimental) and processing of DQ-OVA (n = 5 adult donors in 5 experimental and 4 elderly donors in 4 experimental) in day 4 cultures relative to controls. The statistical tests show mean ± s.d. throughout; two-sided, unpaired Student’s t-test (i,j,k,l). t-SNE, t-distributed stochastic neighbor embedding. Source data
Extended Data Fig. 1
Extended Data Fig. 1. Generation of a PanDC snMultiome-seq dataset of human dendritic cells.
a, Experimental design for generating panDC and sorted pDC snMultiome-seq datasets. DCs were magnetically enriched from fresh PBMCs, followed by FACS purification and nuclei isolation. snRNA-seq and snATAC-seq libraries were generated from nuclei and sequenced. b, PanDC purification strategy. Magnetically enriched DCs were stained and FACS-purified. Lineage-positive cells (CD3+, CD19+, CD20+, CD335+, CD66b+), CD14+ and CD16+ were excluded from live singlets, as were HLA-DR and CD33/CD123 cells. Representative plots before (top) and after (bottom) sorting are shown. c-d, Sorted panDCs were analyzed by flow cytometry to determine the frequency of each DC subset: pDCs (CD123+AXL), tDCs (CD123+AXL+), cDC2s (CD123CD11c+BDCA3), cDC1s (CD123BDCA3+) and “other” cells (CD123CD11cBDCA3). Flow cytometry plots (c) and corresponding quantification (d) are shown. Previously described CD100hi progenitors are contained within the “other” population (HLA-DR+CD11cCD123). e, UMAP of panDCs based on snRNA-seq (left), snATAC-seq (middle), and their integrated profiles using weighted nearest neighbor (WNN) analysis (right). Clusters are colored by unsupervised WNN clustering. f, Bar graph showing the percentage of DC subset within clusters from (e). g, Violin plots showing DC subset gene signature scores based on two publicly available datasets,, calculated using Seurat AddModuleScore function. h, DC2 (CD163CD5+ cells) and DC3 (CD163+CD14+ cells) gene signatures were applied to the cDC2 cluster of panDC dataset using the AddModuleScore_UCell function. i, Signature score of AXL+ DCs and progenitor populations, applied to the panDC dataset using the AddModuleScore function. Graphics in a created using BioRender.com.
Extended Data Fig. 2
Extended Data Fig. 2. Generation of a snMultiome-seq dataset of human pDCs before and after CD40L stimulation.
a, As in Extended Data Fig. 1a, but showing the purification of pDCs from the same donor at a different time point. Briefly, pDCs were magnetically enriched from PBMCs, stained and purified by FACS. b, pDC purification strategy. Lineage-positive cells (CD3+, CD19+, CD20+, CD335+, CD66b+), CD14+ and CD16+ were excluded from live singlets. Cells were then gated as BDCA4+AXLCD11cHLA-DR+CD123+BDCA1CD33low. Representative plots before (upper panels) and after (bottom) sorting are shown. Previously described CD100hi progenitors were not present in sorted pDCs. c, Experimental design for generating a snMultiome-seq dataset from CD40L- stimulated pDCs. Purified pDCs were cultured with CD40L (always in the presence of IL-3) for 4 days, live cells were sorted and subjected to snRNA-seq and snATAC-seq library preparation and sequencing. d, Bar graph showing cell recovery after 2, 4, or 6 days of culture with CD40L (always in the presence of IL-3) (mean + SD; n = 7 donors in 7 exp.; paired one-way ANOVA with Tukey’s multiple comparison test). e, WNN UMAP of day-4 culture snMultiome-seq dataset with cells colored by cell cycle stage based on Seurat analysis. f, Violin plots showing expression of selected cDC1 and cDC2 genes in panDC dataset (left) and day-4 culture dataset (right). g, Cells from 4 day-culture snMultiome dataset plotted by clusters and pseudotime trajectory. Graphics in a and c created using BioRender.com. Source data
Extended Data Fig. 3
Extended Data Fig. 3. Flow cytometry analysis of CD40L stimulated pDCs.
a, Purified pDCs were cultured with CD40L (always in the presence of IL-3), and the percentage of pDCs, itDCs and icDC2s was analyzed at day 2 (n = 11 donors, 11 exp.), day 4 (n = 14 donors, 14 exp.) and day 6 (n = 6 donors, 6 exp.) (mean+SD; unpaired two-way ANOVA with Tukey’s multiple comparison test). b, Percentage of cells in each SMART-seq2 cluster, colored by blood donor. c, UMAP of the SMART-seq2 dataset, colored by cell cycle phase according to Seurat analysis. d, Violin plots of selected gene expression in SMART-seq2. Bar graphs show protein expression in day-4 culture pDCs, itDCs and icDC2s. Data are shown as percentage of positive cells or gMFI relative to pDCs for the following markers: CD45RA, CD123 (n = 8 donors, 8 exp.); BDCA2 (n = 9 donors, 9 exp.); BDCA4 (n = 4 donors, 4 exp.); HLA-DR (n = 14 donors, 14 exp.); CD205, CD172a, CLEC10A, CD86 (n = 7 donors, 7 exp.); CD80, CD40 (n = 6 donors, 6 exp.); and percentages of LILRA4⁺ and CD62L⁺ cells (n = 5 donors, 5 exp.). (mean+SD; paired one-way ANOVA with Tukey’s multiple comparisons test). Source data
Extended Data Fig. 4
Extended Data Fig. 4. pDC fate during culture.
a-c, FACS-purified pDCs were stimulated with CD40L for 2 days, and then sorted into pDCs, itDCs and icDC2s and re-cultured with CD40L for an additional 2-4 days. a, Experimental set up. b, CD33 and CD11c expression at day 2 (top), day 4 (middle) and day 6 (bottom) for one representative donor. c, Quantification of (b) at day 4 (n = 4 donors, 4 exp.) and day 6 (n = 3 donors, 3 exp.) (mean+SD). d, Experimental set up: FACS-purified pDCs were stimulated with CD40L for 4 days, sorted into pDCs, itDCs and icDC2s, and re-cultured for 2 more days with either CD40L, IFNα, or control media (all conditions contain IL-3; Fig. 2m, Fig. 4t). e, CD33 and CD11c expression at day 4 (top) and day 6 (bottom) (1 donor out of 4). f, Pie charts showing distribution of pDCs, itDCs and icDC2s (top), and the percentage of apoptotic cells within each population, measured by Apotracker Green staining (bottom; mean±SD; unpaired two-way ANOVA with Tukey’s multiple comparison test), following CD40L stimulation. Data were collected by flow cytometry at day 1 (n = 8 donors, 8 exp.), day 2 (n = 8 donors, 8 exp.), and day 4 (n = 5 donors, 5 exp.). g, CTV-labelled pDCs were FACS-purified at 1, 10, 100, 1,000 or 5,000 cells/well onto a CFSE-labelled pDCs “filler” bed, and cultured for 4 days with CD40L. Representative flow cytometry plots from 1 of 4 donors (Fig. 2p). h, cDC2 (CD163CD5+ cells) and DC3 (CD163+CD14+ cells) gene signature was applied to the icDC2 cluster from day-4 snMultiome-seq (C3 in Fig. 1e) or day-2 SMART-seq 2 (cluster C3 in Fig. 2f) datasets using Seurat AddModuleScore_UCell function. i, Flow cytometry expression of cDC2 marker (CD5) and DC3 markers (CD14 and CD163) in day-4 cultures (mean+SD; n = 4 donors, 4 exp.; paired one-way ANOVA with Tukey’s multiple comparisons test). Source data
Extended Data Fig. 5
Extended Data Fig. 5. icDC2 are functional cDCs.
a, Cell area of freshly isolated pDCs (n = 28 cells) and cDC2 (n = 22 cells), and day-6 culture pDCs (n = 43 cells), itDCs (n = 26 cells) and icDC2s (n = 21 cells) from Fig. 3a. Each dot represents a single cell (1 of 2 donors; mean±SD; Kruskal-Wallis test with Dunn’s multiple comparisons). b, Heatmap of selected genes from the MHCII-related pathways shown in Fig. 3c. c-e, Purified pDCs were cultured with CD40L (in the presence of IL-3) for 4 days, then incubated for 3 h at 37 °C with various fluorescently labelled particulate antigens. As negative control, cells were treated with Cytochalasin D and incubated with antigens at 4 °C. Antigen uptake was measured by flow cytometry. Representative histograms (single donor), heatmaps, and bar graphs (relative to 4 °C control) are shown (paired two-way ANOVA with Tukey’s multiple comparisons test). c, Uptake of PKH-labelled autologous cells, apoptotic apoptotic (1:30 and 1:300, n = 5 donors, 5 exp.) and live (1:30, n = 2, 2 exp.; 1:300, n = 4 donors, 4 exp.). d, Uptake of PKH-labelled xenogeneic cells (mouse splenocytes), apoptotic (1:30, n = 3 donors in 3 exp.; 1:300, n = 5 in 5 exp.) and live (1:30, n = 3 donors in 3 exp.; 1:300, n = 6 donors in 6 exp.). e, Uptake of pHrodo-labeled S. aureus, 50 µg/ml (n = 5 donors, 5 exp.) and or 100 µg/ml (n = 6 donors, 6 exp.). f, Cells were incubated with DQ-OVA for 3 h to assess antigen processing (n = 5 donors, 5 exp.). Representative histogram, heatmap (mean), and bar graphs (relative to 4 °C control) are shown (paired two-way ANOVA with Tukey’s multiple comparisons test). g, Day-4 culture cells were loaded with apoptotic xenogeneic splenocytes for 3-18 hours. pDCs and icDC2s were stained and FACS-purified using the indicated gating strategy. h, Naive T cells were enriched to >98%. Representative plots before (top) and after (bottom) enrichment are shown. Source data
Extended Data Fig. 6
Extended Data Fig. 6. Epigenetic analysis and antigen presentation capacity of fresh DCs.
a, Epigenetic track showing chromatin accessibility at CIITA locus and peak-to-gene links. Promoter 1 is highlighted in grey; putative enhancers are highlighted in purple. b, Epigenetic tracks showing chromatin accessibility at the MARCH1 locus. Putative enhancers overlapping open peaks are highlighted in grey. c, Purification strategy for DC subsets. DCs were magnetically enriched from PBMCs, stained, and FACS-purified. Lineage-positive cells (CD3+, CD19+, CD20+, CD335+, CD66b+, CD14+, CD16+) were excluded from live singlets. Cells were gated as follows: pDCs (HLA-DR+CD123+BDCA1AXLCD11c); tDCs (HLA-DR+CD123+BDCA1AXL+); cDC2s (HLA-DR+CD123BDCA3CD11c+BDCA1+); and cDC1s (HLA-DR+CD123BDCA3+CD11c+BDCA1). Representative plots before (top) and after sorting (bottom) are shown (see also Fig. 3k). d, Magnetically enriched DCs were incubated with the indicated fluorescently labelled antigens for 3 h at 37oC. Uptake of xenogeneic live cells (n = 3 donors, 3 exp.) and S. aureus (100 μg/ml; n = 4 donors, 4 exp.), or processing of DQ-OVA (n = 3 donors, 3 exp.) were measured by flow cytometry and reported as percentage relative to 4oC controls (mean±SD; paired one-way ANOVA with Tukey’s multiple comparisons test). Source data
Extended Data Fig. 7
Extended Data Fig. 7. Fate decision process is dictated by TNF signaling via NF-κB.
a, TF activity scores (average chromVAR motif accessibility and gene expression) were calculated in the panDC (left) and day-4 culture (right) snMultiome-seq datasets. TFs with an activity score >0.6 are shown. b, Percentage TCF4hi cells in day-4 cultures (n = 4 donors, 4 exp.; paired one-way ANOVA with Tukey’s multiple comparisons test). c, Heatmap of all TCF4-regulated genes analyzed in Fig. 4g. d, Heatmap of all SPI1-regulated genes analyzed in Fig. 4i. e, Scatter plots showing motif accessibility vs pseudotime for the indicated TFs across clusters C1-C3 in the day-4 culture snMultiome-seq dataset (Fig. 4l). Source data
Extended Data Fig. 8
Extended Data Fig. 8. IFN-I blocks pDC fate switching.
a, Percentage of icDC2s and cell recovery after 2-days of culture with control media alone (IL-3) or increasing concentration of IFNα (10, 100, 1000 U/ml) (n = 4 donors, 4 exp.; paired one-way ANOVA with Dunnett’s multiple comparisons test). b, TNF secretion in cultures stimulated with CD40L, measured in supernatant by cytometric bead array (CBA) at day 1 (n = 5 donors, 5 exp.), day 2 (n = 11 donors, 11 exp.) and day 4 (n = 4 donors, 4 exp.) (mean+SD; two-sided Kruskal-Wallis test with Dunn’s multiple comparisons test). c, Percentage of icDC2s in day-4 cultures with CD40L and either TNFR1/2 blocking antibodies or isotype controls (all conditions contained IL-3) (n = 5 donors, 5 exp.; two-sided paired t test). d. Percentage of CD40+ cells before (day 0; n = 3 donors, 3 exp.) or after 1 day (n = 4 donors, 4 exp.), 2 days (n = 5 donors, 5 exp.), and 4 days (n = 3 donors, 3 exp.) culture with CD40L (mean±SD; unpaired one-way ANOVA with Tukey’s multiple comparisons test). e, Percentage of CD40+ cells after 4 days culture with CD40L and either TNFR1/2 blocking antibodies or isotype controls (all conditions contained IL-3). Representative flow cytometry plots and quantification shown (n = 4 donors, 4 exp.; two-sided paired t test). f, Cell recovery after pDC culture with increasing TNF concentrations (2, 20, 200, 2000 ng/ml) (all with IL-3), measured at day 2 (left; n = 4 donors, 4 exp.), day-4 (middle; n = 7 donors, 7 exp.), or day-4 with a second TNF dose (200, 2000 ng/ml) added on day 2 (right; n = 5 donors, 5 exp.) (paired one-way ANOVA with Tukey or Dunnett’s multiple comparison test; see Fig. 4q-r). g, Percentage of TNFR1+ and TNFR2+ cells in freshly isolated pDCs (n = 3 donors, 3 exp.; mean±SD). h, Percentage of icDC2 in day-4 cultures under indicated conditions (all with IL-3) (n = 3 donors, 3 exp.; paired one-way ANOVA with Tukey’s multiple comparisons test). i, The fresh pDC cluster in the SMART-seq2 dataset (pDC cluster in Fig. 2f) was split onto ‘High’ and ‘Low’ groups based on IFNα response signature (MSigDB). Violin plots show expression of selected IFN-stimulated genes. j, TNF and IL-8 secretion in day-2 cultures, measured in supernatant by CBA (n = 8 donors, 8 exp.; two-sided Wilcoxon matched-pairs signed rank test or paired t test). k, Flow cytometry plots of PDL1 and CD80 expression on pDCs, itDCs and icDC2s from day-4 cultures (CD40L) (left), and after 1-day re-stimulation with medium (IL-3) or CpG-A (1 of 4 donors in 4 exp.). Source data
Extended Data Fig. 9
Extended Data Fig. 9. pDC fate-switching during skin inflammation.
a-f, CITE-seq analysis of healthy and inflamed human skin samples from a public dataset. a, RNA UMAP of myeloid cell clusters (subsetted based on positive HLA-DR+ and MS4A1 gene expression). ‘HSP-myeloid’ denotes a myeloid cell cluster with high heat-shock protein expression, ‘LC’ denotes Langerhans cells. ‘cDC2act’ denotes an activated cDC2 cluster. b-c, Expression of key critical transcriptional (b) or protein (c) markers distinguishing cellular clusters in (a). d, RNA UMAPs from (a), showing cellular distribution in: healthy controls, all inflamed lesions (atopic dermatitis, psoriasis vulgaris, bullous pemphigoid, lichen planus and patients with clinicopathologically indeterminate rash), atopic dermatitis alone, and psoriasis vulgaris alone. Numbers of donors is indicated in brackets. The pDC cluster is highlighted in blue. e, Gene signature score of DC subsets from the panDC snMultiome (top) and SMART-seq2 (bottom) datasets projected onto pDC, cDC2 and cDC2act clusters from (a). f, Heatmap of selected genes shown in (e). g, pDC conversion was analyzed in human skin blisters challenged with saline or house dust mite (HDM). Shown is the “IFNα response” signature MSigDB score in CD123hi pDCs (blue) and CD123int DCs (orange) from saline and HDM blisters (Fig. 5a-d). h, Gene signature score of DC subsets from the panDC snMultiome dataset projected onto the saline-treated blister dataset. i, Within the HDM-treated blister dataset, CD123hi cells were stratified onto ‘High’, ‘Middle’ and ‘Low’ groups based on panDC-pDC signature score.
Extended Data Fig. 10
Extended Data Fig. 10. pDC gating strategy in adult and elderly donors.
a, pDCs were magnetically enriched from PBMCs of adult and elderly donors, stained, and purified by FACS. Cells were gated as BDCA4+AXLCD11c. Representative flow cytometry plots are shown before (left panels) and after sorting (right panels). b, Motif accessibility scores of selected TFs computed from bulk ATAC-seq of pDCs from adult and elderly donors (Fig. 6c). c, CyTOF gating strategy used for the experiments shown in Fig. 6d-h). d, gMFI of TCF4 and IRF8 in adult (n = 6 donors) and elderly (n = 8 donors) donors. PBMCs were cryopreserved, and cells from all donors in this cohort were stained and analyzed together in a single flow cytometry run (mean±SD; two-sided unpaired t test; one of two independent cohorts—see also Fig. 6i for the second cohort). Source data

References

    1. Nutt, S. L. & Chopin, M. Transcriptional networks driving dendritic cell differentiation and function. Immunity52, 942–956 (2020). - PubMed
    1. Adams, N. M., Das, A., Yun, T. J. & Reizis, B. Ontogeny and function of plasmacytoid dendritic cells. Annu. Rev. Immunol.42, 347–373 (2024). - PubMed
    1. Naik, S. H. et al. Diverse and heritable lineage imprinting of early haematopoietic progenitors. Nature496, 229–232 (2013). - PubMed
    1. Lee, J. et al. Lineage specification of human dendritic cells is marked by IRF8 expression in hematopoietic stem cells and multipotent progenitors. Nat. Immunol.18, 877–888 (2017). - PMC - PubMed
    1. Feng, J. et al. Clonal lineage tracing reveals shared origin of conventional and plasmacytoid dendritic cells. Immunity55, 405–422 (2022). - PMC - PubMed

Substances

LinkOut - more resources