. 2025 Sep;26(18):4563-4586.
doi: 10.1038/s44319-025-00546-x. Epub 2025 Aug 12.

Hyperactive PLCG1 induces cell-autonomous and bystander T cell activation and drug resistance

Affiliations

Hyperactive PLCG1 induces cell-autonomous and bystander T cell activation and drug resistance

Longhui Zeng et al. EMBO Rep. 2025 Sep.

Abstract

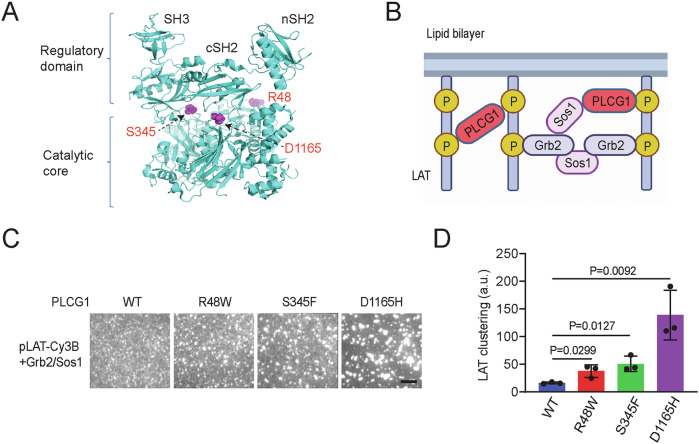
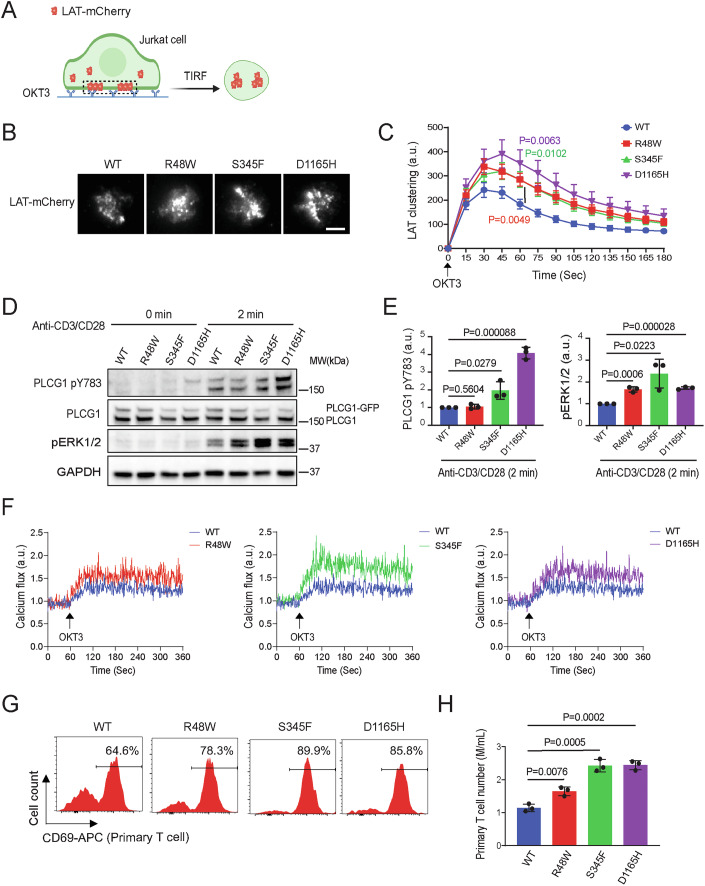
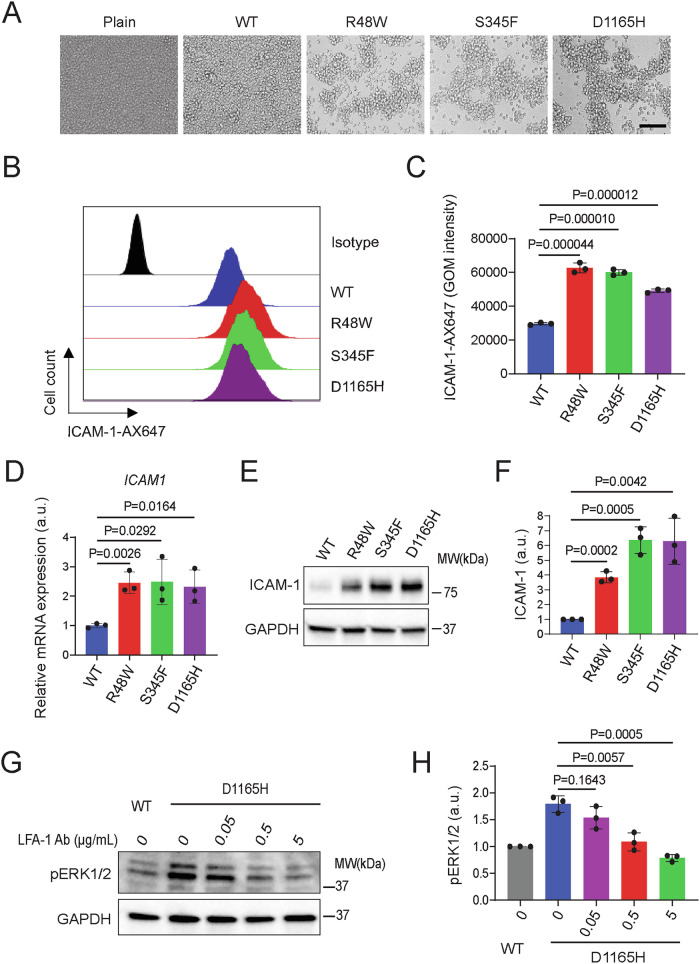
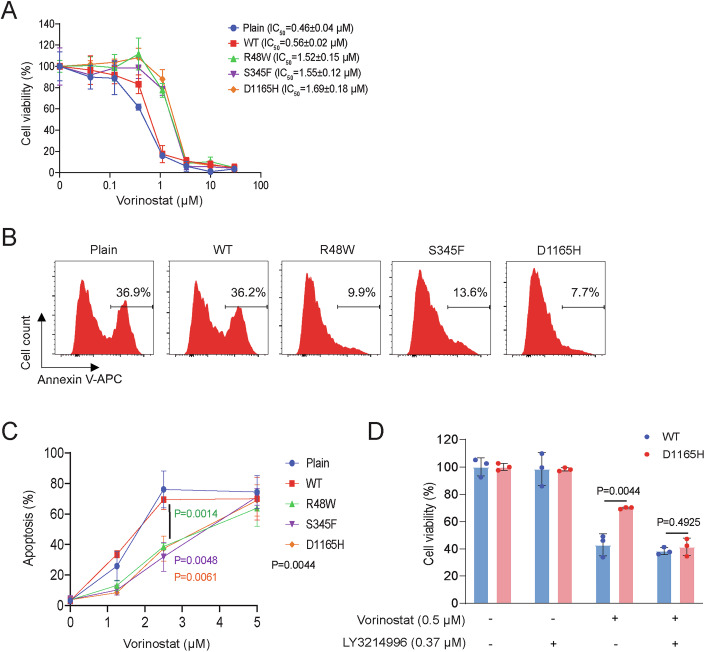
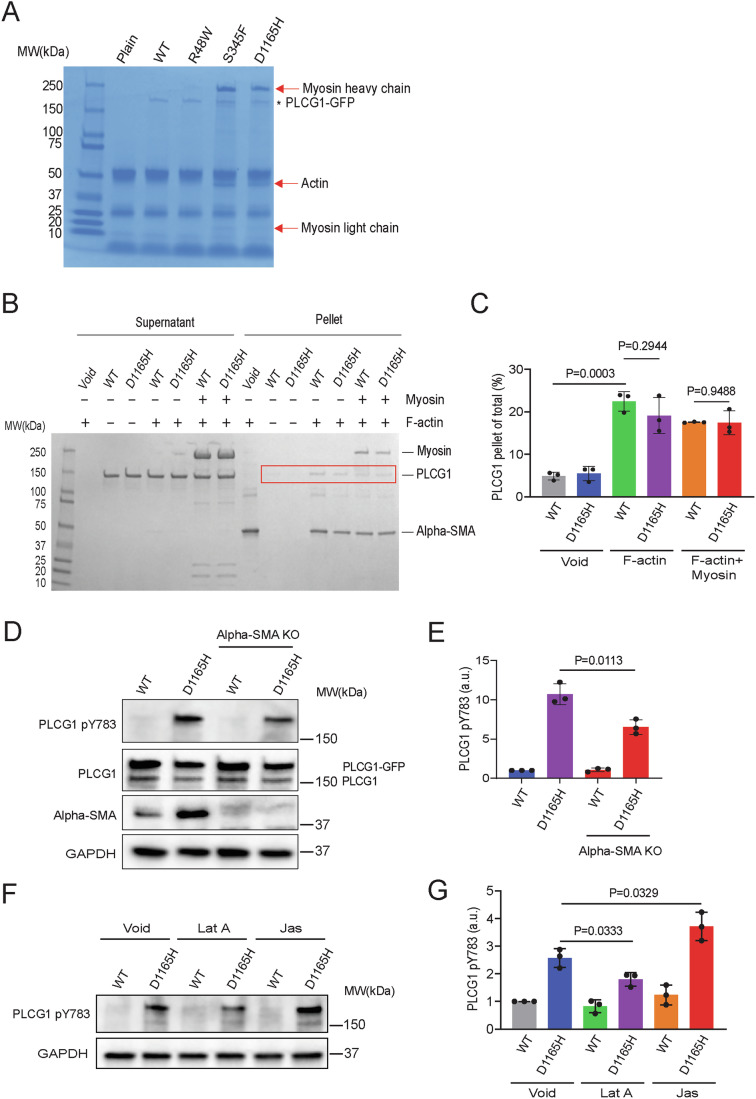
Phospholipase C gamma 1 (PLCG1) has been identified as the most frequently mutated gene in adult T-cell leukemia/lymphoma, suggesting a critical function of PLCG1 in driving T cell activation. However, it remains unclear how these mutations regulate T cell physiology and pathology. Here, we investigate three common leukemia/lymphoma-associated mutations (R48W, S345F, and D1165H). We discover that these mutations induce hyperactive T cell signaling and cause pro-survival phenotypes. PLCG1 mutants enhance LAT condensation, calcium influx, and ERK activation. They also promote T cell proliferation, upregulate cell adhesion molecules, induce cell aggregation, and confer resistance to Vorinostat, an FDA-approved drug for cutaneous T-cell lymphoma. The resistance depends on ERK signaling and can be reversed with an ERK inhibitor. Interestingly, PLCG1 mutants also induce bystander drug resistance in nearby cells expressing wild-type PLCG1. Mechanistically, alpha smooth muscle actin, which is specifically induced by PLCG1 mutants, directly binds PLCG1 to promote its activation. These results demonstrate that hyperactive PLCG1 promotes T cell survival and drug resistance by inducing non-canonical signaling.

Keywords: Actin; Condensation; ERK; PLCG1; T Cell.


Conflict of interest statement

Disclosure and competing interests statement. The authors declare no competing interests.

Figures

Figure 1
Figure 1. PLCG1 acquiring ATLL-associated mutations promotes LAT condensation in vitro.
(A) Location of the three T-cell leukemia/lymphoma-associated mutations in the structure of PLCG1 (PDB: 6PBC). (B) Schematics of biochemical reconstitution of LAT condensation on supported lipid bilayers. (C) TIRF microscopy revealed that PLCG1 mutations enhanced LAT condensation on bilayers at physiological concentrations. Cy3B-labeled LAT at 300 molecules/μm2 was incubated with 300 nM Sos1 (the fragment that contains proline-rich motifs), 3000 nM Grb2 and 50 nM PLCG1 for 0.5 h before imaging. Scale bar: 5 μm. (D) Quantification of LAT clustering as normalized variation. Shown are mean ± SD from n = 3 biological replicates. Unpaired two-tailed t test was used. Source data are available online for this figure.
Figure 2
Figure 2. PLCG1 mutants increase TCR-triggered T cell activation.
(A) Schematics of imaging T cell activation in live cells. Jurkat T cells expressing LAT-mCherry and PLCG1 WT or mutants were plated and activated on OKT3 antibody-coated glass. The formation of LAT condensates on plasma membranes were monitored by time-lapsed TIRF microscopy. (B) Representative images of Jurkat T cells stimulated with glass-coated OKT3. Images shown were 45 s after cell landing. Scale bar: 5 μm. (C) Quantification of LAT clustering during T cell activation. Shown are mean ± SEM. N = 24–30 cells. Unpaired two-tailed test was used for mutation groups compared to WT under stimulation at 60 s. R48W vs WT: P = 0.0049, S345F vs WT: P = 0.0102, D1165H vs WT: P = 0.0063. (D) Immunoblot analysis of Jurkat T cells harboring PLCG1 WT or indicated mutated variant stimulated with anti-CD3 and anti-CD28 antibodies. (E) Quantification of (D). Shown are mean ± SD from n = 3 biological replicates. Unpaired two-tailed t test was used. (F) Calcium flux monitored by flow cytometry following TCR activation. Jurkat T cells expressing calcium sensor GCaMP6s and PLCG1 WT or mutation were stimulated by OKT3 antibody and monitored by flow cytometry in a continuous recording mode. (G) Activation of human primary T cells expressing PLCG1 WT or mutants. The expression of CD69 was determined by flow cytometry 14 days after T cells were infected with lentivirus encoding PLCG1 WT or mutants. (H) Proliferation of human primary T cells expressing PLCG1 WT or mutants. The cell number was quantified 14 days after T cells were infected with lentivirus encoding PLCG1 WT or mutants. Shown are mean ± SD from n = 3 biological replicates. Unpaired two-tailed t test was used. Source data are available online for this figure.
Figure 3
Figure 3. Hyperactive PLCG1 is sufficient to trigger T cell activation and cytokine production without TCR engagement.
(A) Immunoblot analysis of signaling in Hut78 cells stably expressing PLCG1 WT or mutants (without TCR activation). (B) Quantification of (A). Shown are mean ± SD from n = 3 biological replicates. Unpaired two-tailed t test was used. (C) Profiling of protein kinase phosphorylation. Hut78 cells expressing PLCG1 WT or mutations were lysed, and applied to the proteome profiler human phospho-kinase array kit for analysis. The three kinases with altered phosphorylation were highlighted by blue arrows. (D) Quantification of the phosphorylation level of kinases. Shown are mean ± SD from n = 4 biological replicates. Unpaired two-tailed t test was used. (E) ELISA analysis of IL2 and TGF-beta secretion by Hut78 cells in resting versus activation states. Hut78 cells were activated by anti-CD3/CD28 antibodies for 72 h. Shown are mean ± SD from n = 3 biological replicates. Unpaired two-tailed t-test was used. Source data are available online for this figure.
Figure 4
Figure 4. Hyperactive PLCG1 signaling induces aggregation of Hut78.
(A) Aggregation of Hut78 cells expressing PLCG1 mutants. Scale bar: 100 μm. (B) Flow cytometry revealed ICAM-1 expression on Hut78 expressing PLCG1 WT or mutants. (C) Quantification of (B). GOM is geometric mean fluorescence intensity. Shown are mean ± SD from n = 3 biological replicates. Unpaired two-tailed t test was used. (D) The ICAM-1 mRNA level as determined by qPCR. Shown are mean ± SD from n = 3 biological replicates. Unpaired two-tailed t test was used. (E) The ICAM-1 protein level as determined by western blot. (F) Quantification of (E). Shown are mean ± SD from n = 3 biological replicates. Unpaired two-tailed t test was used. (G) Blocking ICAM-1and LFA-1 interaction inhibited ERK activation. LFA-1 blocking antibody was added to Hut78 expressing PLCG1 D1165H for 36 h. (H) Quantification of (D). Shown are mean ± SD from n = 3 biological replicates. Source data are available online for this figure.
Figure 5
Figure 5. Hyperactive PLCG1 confers Hut78 resistance to HDAC inhibitors.
(A) PLCG1 mutations conferred Hut78 resistance to vorinostat. The plain group is Hut78 cells without ectopically expressing PLCG1. The CCK8 assay was used to detect viable cell number after vorinostat treatment for 72 h. Shown are mean ± SD from n = 3 biological replicates. (B) PLCG1 mutations decreased vorinostat-induced apoptosis. Hut78 cells were incubated with 1.25 μM vorinostat for 60 h. (C) Quantification of vorinostat-induced apoptosis. Shown are mean ± SD from n = 3 biological replicates. The unpaired two-tailed t test was used to compare WT to R48W (P = 0.0014), S345F (P = 0.0048), D1165H (P = 0.0061) under 2.5 μM vorinostat treatment. (D) ERK inhibition mitigated vorinostat resistance in Hut78 cells. ERK inhibitor LY3214996 at noncytotoxic concentration 0.37 μM abolished the resistance to vorinostat in Hut78 expressing PLCG1 D1165H. Shown are mean ± SD from n = 3 biological replicates. Unpaired two-tailed t test was used. Source data are available online for this figure.
Figure 6
Figure 6. Hyperactive PLCG1 signaling induces a distinct gene profile from TCR activation.
(A) Venn plot illustrates the gene expression difference in the R48W, S345F and D1165H group as compared to the WT PLCG1. RNA-seq analysis was used to profile gene expression in Hut78 cells expressing WT or mutant PLCG1. Threshold: Log2 fold change >1 and FDR < 0.001 when comparing to the WT group. (B) Comparing gene expression profile between hyperactive PLCG1 signaling and TCR signaling. In the TCR group, Hut78 expressing PLCG1 WT was activated by anti-CD3/CD28 antibodies for 3 days. (C) Qiagen ingenuity pathway analysis (IPA) revealed pathways enriched in the gene set uniquely triggering by hyperactive PLCG1 signaling but not TCR signaling. (D) Immunoblot analysis of actin isoform expression in Hut78 cells. WT+Stimulation: PLCG1 WT was stimulated by anti-CD3/CD28 antibodies for 2 days. (E) Quantification of the actin expression. Shown are mean ± SD from n = 3 biological replicates. Unpaired two-tailed t test was used. Source data are available online for this figure.
Figure 7
Figure 7. Alpha smooth muscle actin-dependent activation of PLCG1 bearing ATLL mutations.
(A) Immunoprecipitation assay to identify PLCG1-binding partners. Hut78 cells expressing PLCG1-GFP (WT or mutant) were lysed, pulled down by beads coated with protein G and an anti-GFP antibody-coated, and applied for SDS-PAGE. The specific bands stained by Coomassie Blue were cut and identified using mass spectrometry. The plain sample is Hut78 cells without exogenously expressed PLCG1. (B) Pelleting assay to determine the direct interaction between PLCG1 and filamentous actin in vitro. Input: 4 µM α-SMA (pre-assembled into filaments), 0.4 µM PLCG1, and 1 µM myosin. (C) Quantification of PLCG1 binding to F-actin. Shown are mean ± SD from n = 3 biological replicates. Unpaired two-tailed t test was used. (D) Immunoblotting of PLCG1 phosphorylation in alpha-SMA knockout Hut78 cells. (E) Quantification of PLCG1 phosphorylation from (D). Shown are mean ± SD from n = 3 biological replicates. Unpaired two-tailed t-test was used. (F) Regulation of PLCG1 phosphorylation by filamentous actin in Hut78 cells. Actin filaments were destabilized and stabilized with the treatment of 0.5 μM latrunculin A (Lat A) or 0.15 μM jalapinolate (Jas), respectively for 0.5 h. (G) Quantification of PLCG1 phosphorylation. Shown are mean ± SD from n = 3 biological replicates. Unpaired two-tailed-t test was used. Source data are available online for this figure.
Figure 8
Figure 8. Hyperactive PLCG1 signaling in human primary T cells and its clinical relevance to T-cell leukemia/lymphoma.
(A) PLCG1 mutation induced ERK phosphorylation and alpha-SMA expression in human primary T cells as determined by Western blot. (B) PLCG1 mutation enhanced ICAM-1 expression in human primary T cells as determined by flow cytometry. (C) Quantification of ICAM-1 expression from (B). Shown are mean ± SD from n = 3 biological replicates. Unpaired two-tailed t test was used. (D) RNA-seq analysis of ATLL samples. The expressions of alpha-SMA (ACTA2) and ICAM-1 (ICAM1) in ATLL samples (n = 66) were compared to those in healthy controls (n = 3). Unpaired two-tailed Welch’s t test was used. (E) Mechanisms and consequences of hyperactive PLCG1 signaling triggered by T-cell leukemia/lymphoma-associated mutations. Source data are available online for this figure.
Figure EV1
Figure EV1. PLCG1 mutants promote the activation of T cells.
(A) Recombinant proteins used in this study. The purified proteins were loaded to SDS-PAGE followed by Coomassie Blue staining. (B) FRAP analysis of LAT condensates. Shown are mean ± SD from n = 10 condensates. (C) Activation of human primary T cells expressing PLCG1 WT or mutants. The expression of CD69 was determined by flow cytometry 14 days after T cells were infected with lentivirus encoding PLCG1 WT or mutants. This is a repeated experiment using T cells from a different donor than what was used in Fig. 2G. (D) Proliferation of human primary T cells expressing PLCG1 WT or mutants. The cell number was quantified 14 days after T cells were infected with lentivirus encoding PLCG1 WT or mutants. This is a repeated experiment using T cells from a different donor than what was used in Fig. 2H. Shown are mean ± SD from n = 3 biological replicates. Unpaired two-tailed t test was used. (E) Immunoblot analysis of signaling in Hut78 cells ectopically expressing GFP-tagged PLCG1 WT or mutants (without TCR activation). Low-titer virus was used so that PLCG1 WT or mutants were expressed at a similar level to the endogenous PLCG1. (F) Quantification of (E). Shown are mean ± SD from n = 3 biological replicates. Unpaired two-tailed t-test was used.
Figure EV2
Figure EV2. Hut78 cells expressing PLCG1 mutations induce aggregation and activation of neighboring cells expressing the wild-type PLCG1.
(A) Conditioned media from Hut78 cells expressing D1165H did not induced cell aggregation. Hut78 cells expressing PLCG1 WT were cultured in supernatant from Hut78 cells expressing the WT or D1165H PLCG1 for 2 days. (B) The expression of LFA-1 (Two subunits, CD11a and CD18) on the cell surface of Hut78 was detected by flow cytometry. (C) Schematics of co-culture assay. Hut78 cells harboring PLCG1 WT or D1165H were co-cultured with Far-red dye-labeled plain Hut78 cells at 1:1 ratio. (D) Plain Hut78 cells co-aggregated with Hut78 expressing D1165H. Red arrow indicates larger cell aggregate. Scale bar: 100 μm. An enlarged inset is shown on the right. Scale bar: 20 μm. (E) Schematics of the co-culture assay. Violet labeled Hut78 cells were co-cultured with Hut78 cells expressing PLCG1-GFP WT or D1165H in a 1:1 ratio for 72 h. (F) ICAM-1 cell surface expression by FACS. Shown are mean ± SD from n = 3 biological replicates. Unpaired two-tailed t-test was used. (G) The co-culture cells were sorted by FACS, lysed, and analyzed by Western blot. (H) Quantification of ERK phosphorylation from (G). Shown are mean ± SD from n = 3 biological replicates. Unpaired two-tailed t-test was used.
Figure EV3
Figure EV3. PLCG1 mutations confer Hut78 resistance to HDAC inhibitors.
(A) PLCG1 mutations conferred Hut78 resistance to belinostat. The plain group is Hut78 cells without ectopically expressed PLCG1. The CCK8 assay was used to detect viable cell number after belinostat treatment for 72 h. Shown are mean ± SD from n = 3 biological replicates. (B) PLCG1 mutations conferred Hut78 resistance to panobionostat. The plain group is Hut78 cells without ectopically expressed PLCG1. The CCK8 assay was used to detect viable cell number after panobinostat treatment for 72 h. Shown are mean ± SD from n = 3 biological replicates. (C) STAT3 inhibitor napabucasin did not affect resistance to vorinostat. Shown are mean ± SD from n = 3 biological replicates. Unpaired two-tailed t-test was used. (D) Schematics of the co-culture assay with vorinostat treatment. Plain Hut78 cells (grey) were co-cultured with Hut78 cells expressing PLCG1-GFP WT or D1165H in a 1:1 ratio for 1 day, and then treated with 1 μM vorinostat for 48 h before being analyzed for apoptosis marker. (E) Hut78 cells expressing PLCG1 D1165H protected the neighboring plain Hut78 cells from vorinostat-induced apoptosis. Hut78 cells expressing PLCG1 WT or D1165H were co-cultured with plain Hut78 cells at 1:1 ratio. The apoptosis level, as indicated by annexin V staining, was determined by flow cytometry. Shown are mean ± SD from n = 3 biological replicates. Unpaired two-tailed t-test was used.
Figure EV4
Figure EV4. Overlapped genes between hyperactive PLCG1 signaling and TCR signaling.
(A) Qiagen ingenuity pathway analysis (IPA) showed pathways enriched in overlapping genes between hyperactive PLCG1 signaling and TCR signaling. (B) Cell surface protein expression by flow cytometry. Shown are mean ± SD from n = 3 biological replicates. Unpaired two-tailed t test was used.
Figure EV5
Figure EV5. PLCG1 sequence in Jurkat and Hut78 cells as revealed by whole-genome sequencing.
(A) Common variants of PLCG1 in Jurkat and Hut78 cells. (B) Local view of the PLCG1 common variants in Jurkat and Hut78 cells as compared to reference human genome sequence. (C) Local view of sequences encoding PLCG1-R48. (D) Local view of sequences encoding PLCG1-S345. (E) Local view of sequences encoding PLCG1-D1165.

Update of

References

    1. Ananthanarayanan B, Das S, Rhee SG, Murray D, Cho W (2002) Membrane targeting of C2 domains of phospholipase C-delta isoforms. J Biol Chem 277:3568–3575 - PubMed
    1. Balagopalan L, Kortum RL, Coussens NP, Barr VA, Samelson LE (2015) The linker for activation of T cells (LAT) signaling hub: from signaling complexes to microclusters. J Biol Chem 290:26422–26429 - PMC - PubMed
    1. Bartelt RR, Cruz-Orcutt N, Collins M, Houtman JC (2009) Comparison of T cell receptor-induced proximal signaling and downstream functions in immortalized and primary T cells. PLoS ONE 4:e5430 - PMC - PubMed
    1. Behjati S, Tarpey PS, Sheldon H, Martincorena I, Van Loo P, Gundem G, Wedge DC, Ramakrishna M, Cooke SL, Pillay N et al (2014) Recurrent PTPRB and PLCG1 mutations in angiosarcoma. Nat Genet 46:376–379 - PMC - PubMed
    1. Cassioli C, Balint S, Compeer EB, Felce JH, Gamberucci A, Della Bella C, Felce SL, Brunetti J, Valvo S, Pende D et al (2021) Increasing LFA-1 expression enhances immune synapse architecture and T cell receptor signaling in Jurkat E6.1 cells. Front Cell Dev Biol 9:673446 - PMC - PubMed

LinkOut - more resources