. 2025 Aug 12;16(1):7491.
doi: 10.1038/s41467-025-62750-6.

Irreversible furin cleavage site exposure renders immature tick-borne flaviviruses fully infectious

Affiliations

Irreversible furin cleavage site exposure renders immature tick-borne flaviviruses fully infectious

Jiří Holoubek et al. Nat Commun. .

Abstract

Flavivirus assembly is driven by the envelope glycoproteins pre-membrane (prM) and envelope (E) in the neutral pH environment of the endoplasmic reticulum. Newly budded, spiky particles are exported through the Golgi apparatus, where mildly acidic pH induces a major surface rearrangement. The glycoproteins reorganize into (prM/E)\₂ complexes at the surface of smooth particles, with prM trapped at the E dimer interface, thereby exposing a furin cleavage site (FCS) for proteolytic maturation into infectious virions. Here, we show that in the absence of furin, immature tick-borne flavivirus particles-tick-borne encephalitis virus, Langat virus, and Louping ill virus-remain fully infectious and pathogenic in female BALB/c mice, in contrast to mosquito-borne flaviviruses such as Usutu, West Nile, and Zika viruses. We further show that the FCS in tick-borne viruses remains exposed at neutral pH, allowing furin at the surface of target cells to activate viral fusogenicity, while mosquito-borne counterparts require acidic re-exposure. Mutations increasing the dynamic behavior of the E dimer mimic the mosquito-borne phenotype, with retracted FCS at neutral pH and loss of infectivity. Our multidisciplinary approach-combining virological assays, targeted mutagenesis, structural modeling, and molecular dynamics simulations-highlights the role of E dimer dynamics in regulating flavivirus maturation and infectivity.


Conflict of interest statement

Competing interests: The authors declare no competing interests.

Figures
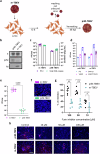
Fig. 1
Fig. 1. Production and characterization of immature prM-containing TBEV.
a Schematic overview. LoVo cells (Δfurin) were infected with TBEV (MOI = 2). At 12 h post-infection (hpi), unbound virus was removed, the cells were washed with PBS, and fresh medium was added. At 48 hpi, prM-TBEV virus was harvested. b Western blot analysis of TBEV and prM-TBEV. Proteolytic processing of m-TBEV by furin yielded a completely cleaved prM protein. Without furin, the prM-TBEV sample contained a majority of immature prM-containing particles, as confirmed by the band corresponding to uncleaved prM protein. c Viral titres of m-TBEV and prM-TBEV determined by plaque assay, compared with viral RNA levels from quantitative PCR with reverse transcription (RT-qPCR). d Susceptibility of mammalian (PS, VERO, BHK-21) and tick (IRE/CTVM19) cell lines to prM-TBEV and m-TBEV. e, f Role of furin during host cell entry. LoVo cells were infected with TBEV and prM-TBEV (MOI = 0.1). The viral load in supernatant was determined by plaque assay, and infectivity of the prM variant was visualized using mCherry_prM-TBEV and mCherry_TBEV. g, h To confirm that furin was necessary during entry steps of prM-TBEV infection, PS cells were pretreated with the furin inhibitor decanoyl-RVKR-CMK (100, 50, 25, and 0 μM). Cells were then infected with mCherry variants of the virus, as described above. At 48 hpi, infection was visualized, and the percentage of inhibition was determined by plaque reduction assay. Each image is representative of two separate experiments (n = 3). Dashed lines correspond to the detection limit of the plaque assay. Scale bars = 200 μm. Data from experiments presented in c–e are from biological duplicates or triplicates (n = 3) presented as mean values ± SD. The statistical significance was calculated using Mann-Whitney test for comparing two groups; ns, P > 0.05, *P < 0.05, **P  <  0.01, ***P < 0.001, ****P < 0.0001. Schematic elements in panel a and selected annotation graphics were created in BioRender. Ruzek, D. (https://BioRender.com/4n4b27g).
Fig. 2
Fig. 2. Tick- and mosquito-borne flaviviruses and their sensitivity to pH.
a TBFV and MBFV were propagated in LoVo cells to produce prM variants. The infectivity of prM samples was determined 48 h post infection (hpi) by plaque assay. b, c To confirm that MBFV could replicate in LoVo cells, viral RNA levels were quantified by RT-qPCR, and the level of viral RNA copies per ml (rPFU ml−1) was compared to PFU ml−1. d These ratios showed dramatically decreased infectivity for prM-USUV and prM-WNV. e In vitro furin cleavage of prM-TBEV at neutral or acidic pH, followed by infection of LoVo cells (at neutral/acidic pH). The amount of infectious virions was determined 48 hpi by plaque assay. f In vitro cleavage of prM-USUV was performed at neutral or acidic pH, followed by infection of PS cells (at neutral/acidic pH). After 48 hpi, PFU mL−1 was determined by plaque assay. g Immunofluorescence of prM-TBEV and prM-USUV infection showed differing pH dependence of furin cleavage. Blue signal (DAPI) = cell nuclei; green signal = viral envelope protein. Scale bar = 200 μm. h Scheme of reversible/irreversible conformational changes induced by neutral and acidic pH. Each image is representative of at least two separate experiments (n = 3). Data were statistically analysed using the Mann-Whitney test. Data from experiments presented in a–f are from at least two separate biological experiments (n = 3) presented as mean values ± SD. The statistical significance was calculated using Mann-Whitney test for comparing two groups; ns, P  >  0.05, *P  <  0.05, **P  <  0.01, ***P  <  0.001, ****P  <  0.0001. Schematic elements in panel a and selected annotation graphics were created in BioRender. Ruzek, D. (https://BioRender.com/4n4b27g).
Fig. 3
Fig. 3. Comparison of the pathogenicity of prM-TBEV/m-TBEV and prM-WNV/m-WNV in a mouse model.
a Two groups of adult BALB/c mice (total n = 11 per group in two independent experiments) were subcutaneously infected with a dose of 102 genome equivalents per mouse (gen. eq.) of prM-TBEV or m-TBEV, respectively. In the case of prM-TBEV, the infectious dose calculation corresponded to ~ 40 PFU for 102 gen. eq. per mouse. Survival rates and clinical scores were monitored for 28 days. b Body weight changes were monitored and showed a similar pattern in all groups (6 mice per group, single experiment). c Clinical score was evaluated as follows: 1, no signs; 2, piloerection; 3, hunched back; 4, paralysis; and 5, death (total n = 11 mice per group, two experiments). d Viral titres in serum were evaluated 3 dpi. (6 mice per group, single experiment). e Mouse brains were harvested 8 dpi and viral titres were determined by plaque assay (5 mice per group, single experiment). f As in the above experiment, two groups of mice were infected with either prM-WNV or m-WNV, and survival was monitored for 28 days (total n = 11 per group in two independent experiments). In the case of prM-WNV, the infectious dose calculation corresponds to ~ 0.7 PFU for 102 gen. eq. per mouse. g Mouse body weight was monitored for 14 days (6 mice per group, single experiment). h Clinical signs of disease were assessed as described above (total n = 11 mice per group, two experiments). i, j Viral titres in serum (6 mice per group, single experiment) and brains (5 mice per group, single experiment) were measured by plaque assay 3 and 8 dpi, respectively. Survival rates were statistically evaluated using the log-rank Mantel-Cox test. Mouse and syringe icons were obtained from Microsoft PowerPoint’s icon set.
Fig. 4
Fig. 4. Biochemical and structural characterization of the furin cleavage site in flaviviruses.
a Peptide substrates for furin activity assays were designed using the DABCYL-EDANS FRET pair. Each substrate includes five amino acids flanking both sides of the scissile bond to mimic the natural cleavage context. b, c The pH profile of each substrate was determined at a fixed concentration close to its Km at pH 7.0: HSRRSRRSLT (2.5 μM), HSKRSRRSIA (3 μM), EGSRSRRSVL (8 μM), and EGSRTRRSVL (5 μM). Reactions were performed in triplicate, and data are shown as mean ± SD. d, The prM/E heterodimer. The left panel shows the prM/E protomer from the experimental cryo-EM structure of an immature particle of TBEV at neutral pH (PDB 8PUV36). The two other panels show AlphaFold predictions, the middle panel is a prediction of the prM/E heterodimer, the right panel is the prediction of a (prM/E)2 dimer, but only one prM/E protomer is shown, for clarity (see Supplementary Fig. 4c). The limits of the linker region containing FCS are indicated by two stars (yellow and green) in the left panel. A dotted ribbon in the left panel (near the green star) indicates a disordered region of the linker. The framed region is zoomed beneath each panel, slightly rotated for clarity. A red arrow points to the scissile bond, showing that it is located at the site where the zipper enters the groove underneath the E protein. The side chains of residues discussed in the text are shown as sticks, including Asn255 in E and the hydrogen bonds it makes drawn in dotted lines. The side chain of Tyr255 is also drawn, to show that the polypeptide chain of the linker, in between residues 82 and 87, interferes with contacts with Pro210 (in the second protomer, not shown) across the E dimer interface. The experimental structure is displayed as ribbons colored coded according to temperature (B) factors in the order lowest-blue < cyan < green < yellow < red-highest. The AF3 predictions are shown color-coded by plDDT (orange < 50, yellow >  50, cyan > 70, blue > 90). Schematic elements in panel a were created in BioRender. Ruzek, D. (https://BioRender.com/4n4b27g).
Fig. 5
Fig. 5. Reverse genetics to explore the phenotype of a mutant TBEV and molecular dynamic simulations.
a Plaque morphology of mutant (m-rTBEV) and parental (m-TBEV) viruses. b Replication kinetics of both variants in mammalian PS cells and tick cells IRE/CTVM19 (c). d Plaque and RNA content in LoVo-derived immature prM-rTBEV and prM-TBEV after 48 hpi. e, Genomic RNA:PFU ratio for prM-rTBEV versus prM-TBEV. f pH sensitivity of virus samples pretreated with r-furin at acidic or neutral pH, followed by infection of PS cells. g Plaque assay of furin-treated virus samples to assess cleavage efficiency at different pH values. Data in b–g represent at least two independent biological replicates and are shown as mean ± SD. Statistics is done using the Mann–Whitney test; ns, P > 0.05, *P < 0.05, **P < 0.01, ***P < 0.001, ****P < 0.0001. h Schematic of MD simulation setup for (prM-E)₂ dimer in a lipid bilayer. Water molecules and ions are not shown (top panel). i Distributions of per-residue Root Mean Square Fluctuations (RMSF) across all residues of the E dimer. Raw normalized histograms are represented by bars, kernel density estimations as solid lines. j Two dimensional distributions of number of contacts formed between each of the two zippers in the dimer (green) and the neighboring protein E chain (violet), for (prM-E)₂WT (bottom panel, red) and (prM-E)₂MUT (bottom panel, blue) k Distributions of distances between the Cα atoms of residues H208 and G258 in (prM-E)₂, represented as in panel i. l Snapshots of representative configurations of (prM-E)₂WT (S1) and (prM-E)₂MUT (S2-S4). The protein E loop D203-T211 as well as residues L257 and D259 are coloured in white, residues H208 and G258 in gray, and the FCS on prM in red. Black dashed lines indicate the distance between the Cα atoms of residues H208 and G258. m Distributions of distances between the carbonyl oxygen of residue 208 and the amide nitrogen of residue 256 in (sE)₂, represented with red and blue colors indicating (sE)₂WT and (sE)₂MUT, respectively. n Distribution of number of water molecules in the first coordination shell of atoms at the interface of the (sE)₂ dimer, represented as in panel m. Colors indicate WT (red) and mutant (blue) variants throughout panels (i–n).
Fig. 6
Fig. 6. Schematic representation of maturation differences during the infectious cycle of TBFVs and MBFVs.
Schematic representation of flavivirus maturation process upon assembly of new particles in an infected cell, reflecting current understanding based on structural studies, experimental observations, and model-based predictions. a–I Immature particles, which bud at neutral pH into the ER lumen, contain 60 spikes formed of (prM/E)₃ trimers depicted with prM in yellow and E in blue. PrM has a globular pr head masking the fusion loop in E, and a long linker that connects to its transmembrane domains. The linker contains a zippering element (green), which inserts at neutral pH into a non-polar groove in E, thereby protecting the adjacent FCS (in red) from exposure and cleavage. a–II During transport through the GA, the particle is exposed to increasingly acidic pH, which triggers (E/prM)₃ dissociation and ejection of the zipper from the E groove, effectively exposing the FCS. a–III The E/prM protomers reorganize to make 90 (prM/E)₂ dimers in a smooth herringbone lattice, with the pr moiety of prM still masking the fusion loop but with the linker unzipped and the FCS exposed. a–IV The presence of furin (green pacman) results in cleavage and maturation of the particle. MBFVs and TBFVs released from furin-deficient cells (into the extracellular environment with neutral pH – panel B) show different behavior: while the former reverts to the spike form adopted in the ER, resulting in re-zippering and re-formation of (prM/E)₃ trimers (b–V) this is not the case for TBFVs. b–VI In this case, the more stable interface between E protomers of the (prM/E)₂ dimer prevents the zipper from re-entering the E groove, which is located beneath the dimer, facing the viral membrane. The FCS thus remains exposed at the surface of smooth particles and furin cleaves it at neutral pH, in striking contrast to MBFVs. In TBFVs, this cleavage can occur at the host cell membrane upon infection, leading to the release of the cleaved pr fragment and subsequent endocytosis (b–VI and c). During endocytosis, the decreasing pH activates the fusion loop, facilitating fusion with the endosomal membrane and initiating a new infectious cycle (c). Selected graphics were created in BioRender. Ruzek, D. (https://BioRender.com/4n4b27g.

References

    1. Pierson, T. C. & Diamond, M. S. The continued threat of emerging flaviviruses. Nat. Microbiol.5, 796–812 (2020). - PMC - PubMed
    1. Gould, E. & Solomon, T. Pathogenic flaviviruses. Lancet371, 500–509 (2008). - PubMed
    1. Chiffi, G., Grandgirard, D., Leib, S. L., Chrdle, A. & Ruzek, D. Tick-borne encephalitis: a comprehensive review of the epidemiology, virology, and clinical picture. Rev. Med. Virol.33, e2470 (2023). - PubMed
    1. Campbell, G. L., Marfin, A. A., Lanciotti, R. S. & Gubler, D. J. West Nile virus. Lancet Infect. Dis.2, 519–529 (2002). - PubMed
    1. Solomon, T. & Vaughn, D. W. Pathogenesis and clinical features of Japanese encephalitis and West Nile virus infections. Jpn. Encephalitis West Nile Viruses267, 171–194 (2002). - PubMed

MeSH terms

LinkOut - more resources