. 2025 Aug 12;16(1):7468.
doi: 10.1038/s41467-025-62693-y.

Dengue virus susceptibility in Aedes aegypti linked to natural cytochrome P450 promoter variants

Affiliations

Dengue virus susceptibility in Aedes aegypti linked to natural cytochrome P450 promoter variants

Sarah H Merkling et al. Nat Commun. .

Abstract

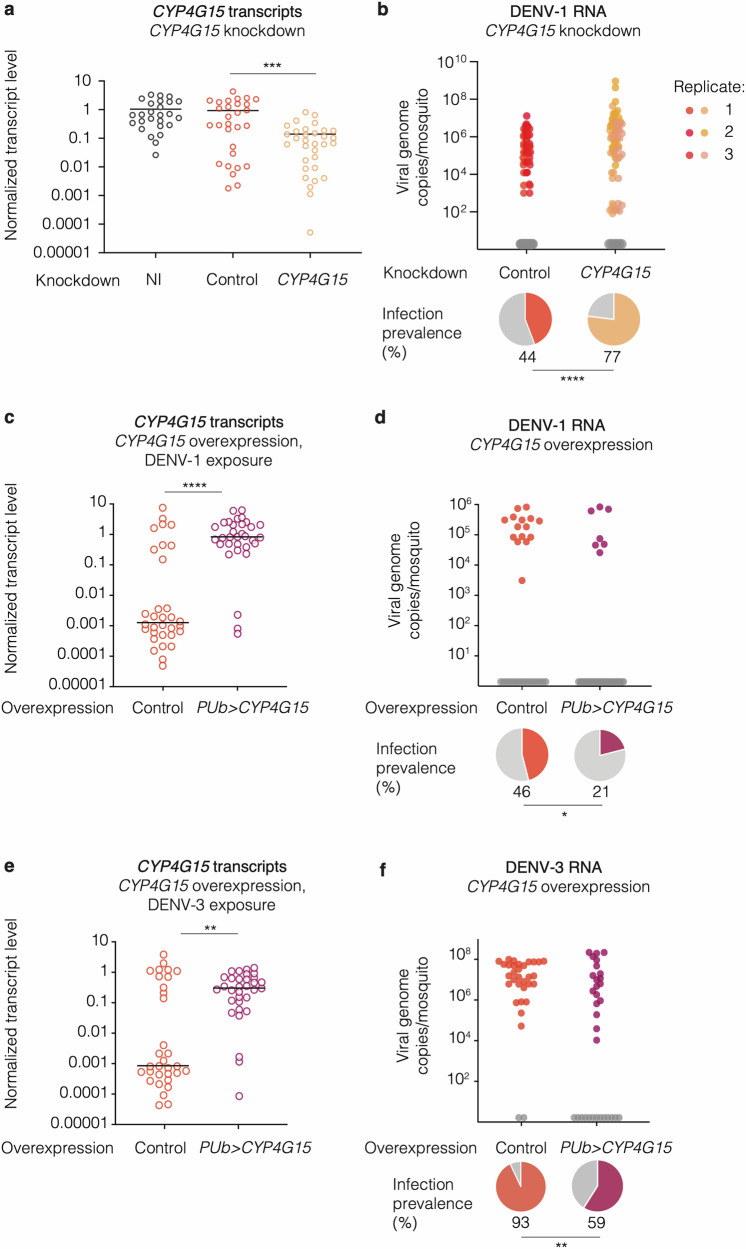
The mosquito Aedes aegypti is the primary vector for dengue virus (DENV), which infects millions of people annually. Variability in DENV susceptibility among wild Ae. aegypti populations is governed by genetic factors, but specific causal variants are unknown. Here, we identify a cytochrome P450-encoding gene (CYP4G15) whose genetic variants drive differences in DENV susceptibility in a natural Ae. aegypti population. CYP4G15 is transiently upregulated in DENV-resistant midguts, while knockdown increases susceptibility, and transgenic overexpression enhances resistance. A naturally occurring 18-base-pair promoter deletion reduces CYP4G15 expression and confers higher DENV susceptibility. The unexpected role of a cytochrome P450 in DENV susceptibility challenges the long-standing focus on canonical immune pathways and opens new avenues for understanding antiviral defense and DENV transmission in mosquitoes.


Conflict of interest statement

Competing interests: The authors declare no competing interests.

Figures

Fig. 1
Fig. 1. Early transcriptomic analysis of individual midguts identifies Ae. aegypti genes associated with DENV-1 infection outcome.
a Map of the African continent (from Wikimedia Commons: https://fr.wikipedia.org/wiki/Fichier:Location_Gabon_AU_Africa.svg) showing the geographical origin (red dot) of the Bakoumba strain of Ae. aegypti. b Experimental scheme for the time-course analysis of infection outcome in Ae. aegypti mosquitoes from Bakoumba following an infectious bloodmeal containing 5 × 106 focus-forming units (FFU)/ml of DENV-1. Day 0 samples were collected just after the infectious bloodmeal. Viral RNA levels and infectious titers were determined on the same mosquito homogenates by RT-qPCR and virus titration, respectively. c Time course of DENV-1 RNA levels in single mosquitoes. The graph shows the abundance of viral RNA over time and the pie charts below represent the proportion of positive individuals (n = 24 mosquitoes per time point). Statistical significance of differences in infection prevalence was assessed relative to day 0 by chi-squared test (day 2: p = 0.0004; day 7: p = 0.0019; day 10: p = 0.0002) and shown in the figure (**p < 0.01; ***p < 0.001). d Time course of DENV-1 infectious titers in single mosquitoes. The graph shows the infectious titer over time and the pie charts below represent the proportion of positive individuals (n = 24 mosquitoes per time point). Statistical significance of differences in infection prevalence was assessed relative to day 0 by chi-squared test and shown in the figure (****p < 0.0001) except when prevalence was 0%, making the chi-squared test invalid. e Bar plot showing the number of differentially expressed genes between DENV-1-infected (n = 8) or uninfected midguts (n = 8) identified by RNA-seq 1 and 2 days post exposure (d.p.e.). Infection status of the samples was determined by RT-qPCR prior to RNA-seq (Fig. S1). A gene was considered differentially expressed when the fold change in transcript abundance was ≥2 and the adjusted p value was ≤0.05 (Fig. S2c). f Venn diagrams showing the absence of overlap between differentially expressed genes at 1 and 2 d.p.e. Source data are provided as a Source Data file.
Fig. 2
Fig. 2. CYP4G15 is an antiviral factor against DENV-1 and DENV-3.
a CYP4G15 expression in whole mosquitoes upon gene silencing, 2 days after double-stranded RNA (dsRNA) injection targeting CYP4G15 (n = 31) or GFP (n = 29) as a control. Non-injected (NI) mosquitoes (n = 26) were also included. Statistical significance of the pairwise differences was assessed by two-sided Mann–Whitney’s test (CYP4G15 vs. GFP: p = 0.0001). b DENV-1 RNA levels and infection prevalence in whole mosquitoes upon gene silencing of CYP4G15 (n = 91) or GFP (n = 95) as a control. Viral RNA was quantified 5 days post DENV-1 exposure (7 days post dsRNA injection). The data presented are a combination of 3 experimental replicates. Viral RNA levels varied across replicates, represented by different color shades, while prevalence remained consistent across all replicates. Statistical significance of the overall difference in infection prevalence was assessed by chi-squared test (p < 0.0001). c, e CYP4G15 expression in whole mosquitoes upon systemic CYP4G15 overexpression and DENV-1 (c) or DENV-3 (e) exposure. Statistical significance of the pairwise differences (n = 32 mosquitoes per group) was assessed by two-sided Mann–Whitney’s test (DENV-1: p < 0.0001; DENV-3: p = 0.0037). d, f DENV-1 RNA levels and infection prevalence in whole mosquitoes upon systemic CYP4G15 overexpression and DENV-1 (d) or DENV-3 (f) exposure. Statistical significance of the difference in infection prevalence (n = 32 mosquitoes per group) was assessed by chi-squared test (DENV-1: p = 0.0353; DENV-3: p = 0.0012). In cf, CYP4G15 was overexpressed transgenically under the control of a Polyubiquitin promoter (PUb) and mosquitoes were tested 5 days after DENV exposure. In b, d, f, the graph shows viral RNA levels, and the pie charts below represent the proportion of positive individuals. In bf, the control line was the corresponding wild-type mosquito strain. Bloodmeal titers were 5 × 106 focus-forming units (FFU)/ml (a, b) and 107 FFU/ml (c, d) of DENV-1, and 106 FFU/ml (e, f) of DENV-3. In a, c, e, relative CYP4G15 expression was calculated as 2−∆Ct, where ∆Ct = CtCYP4G15 CtRP49, using the housekeeping gene RP49 for normalization. In af, the horizontal bars represent the medians and statistically significant differences are shown (*p < 0.05; **p < 0.01; ***p < 0.001; ****p < 0.0001). Source data are provided as a Source Data file.
Fig. 3
Fig. 3. Natural genetic variants of the CYP4G15 promoter drive expression differences.
a Schematic representation of the two main genetic variants (CYP4G15Δ0 and CYP4G15Δ18) of the CYP4G15 promoter of mosquitoes from the Bakoumba strain, which differ by the presence/absence of an 18-bp deletion 259 bp upstream of the coding sequence (CDS) and 67 bp upstream of the 5′ untranslated region (5′-UTR). b CYP4G15 expression in whole mosquitoes with different CYP4G15 promoter genotypes (n = 38 CYP4G15Δ0/Δ0 homozygotes, n = 19 CYP4G15Δ0/Δ18 heterozygotes, and n = 3 CYP4G15Δ18/Δ18 homozygotes), quantified by RT-qPCR. Statistical significance of the pairwise differences was assessed by two-sided Mann-Whitney’s test (CYP4G15Δ0/Δ0 vs. CYP4G15Δ0/Δ18: p = 0.0002). c Images of overlaid brightfield and GFP signals in transgenic pupae carrying a GFP transgene placed under the control of the CYP4G15Δ18 (left) or CYP4G15Δ0 (right) promoter, denoted as PromΔ0 > GFP and PromΔ18 > GFP, respectively. d Image quantification of GFP mean signal intensity in pupae from the transgenic PromΔ0 > GFP (n = 61) and PromΔ18 > GFP (n = 58) lines pictured in (c). Statistical significance of the difference was assessed by two-sided Mann-Whitney’s test (p < 0.0001). e GFP expression in the whole bodies of adult female mosquitoes from the PromΔ0 > GFP (n = 40) and PromΔ18 > GFP (n = 40) reporter lines, quantified by RT-qPCR. Statistical significance of the difference was assessed by two-sided Mann-Whitney’s test (p < 0.0001). In b, e, relative gene expression was calculated as 2−∆Ct, where ∆Ct = CtGene CtRPS17, using the housekeeping gene RPS17 for normalization. In b, d, e, the horizontal bars represent the medians, and statistically significant differences are shown (**p < 0.01; ****p < 0.0001). Source data are provided as a Source Data file.
Fig. 4
Fig. 4. CYP4G15 promoter genotype contributes to natural variation in DENV susceptibility.
a Statistical association between CYP4G15 promoter variants and phenotypic groups of mosquitoes from the Bakoumba strain categorized in a previous study as either resistant or susceptible to DENV-1 and DENV-3, respectively. CYP4G15 genotype was determined by Sanger sequencing of the promoter region. The total number of mosquitoes genotyped for each phenotypic group (n) is indicated next to the stacked bars. Statistical significance of the genotype-phenotype associations was assessed by Fisher’s exact test and shown in the figure (*p = 0.0189; **p = 0.0011). b Dose-response curves for DENV-1 (left) and DENV-3 (right) infection of the Bakoumba strain and two sub-strains homozygous for the CYP4G15Δ18 and CYP4G15Δ0 variants, respectively. In three experimental replicates, the proportion of mosquitoes positive for viral RNA 7 days post DENV exposure are shown as a function of the bloodmeal titer in log10-transformed focus-forming units (FFU)/ml. The size of the symbols is proportional to the sample size (n = 24 mosquitoes per group, except n = 22 for DENV-1 CYP4G15Δ0 medium dose in replicate 1 and DENV-1 CYP4G15Δ18 medium dose in replicate 3). The curves represent logistic fits of the data combined from the three replicates, with 95% confidence intervals shown as shaded bands. The full statistical analysis of the dose-response curves is provided in Table S1. cCYP4G15 expression in whole bodies of sub-strains homozygous for the CYP4G15Δ18 and CYP4G15Δ0 variants derived from the Bakoumba strain 1 day after DENV-1 (left) or DENV-3 (right) exposure (samples sizes from left to right: n = 28, n = 31, n = 32, n = 24, n = 24, n = 24, n = 28, n = 19, n = 30, n = 24, n = 24, n = 17). Relative gene expression was calculated as 2−∆Ct, where ∆Ct = CtCYP4G15 CtRPS17, using the housekeeping gene RPS17 for normalization. Data shown in c correspond to the highest (DENV-1) or intermediate (DENV-3) bloodmeal titers of experimental replicates 1 and 2 shown in (b). Statistical significance of the pairwise differences was assessed by two-sided Mann-Whitney’s test and statistically significant differences are shown in the figure (**p = 0.0034; ***p < 0.0001). d Frequency of the CYP4G15Δ18 variant in wild Ae. aegypti populations worldwide (world map from the R package maps). Pie charts represent the proportion of individuals mosquitoes carrying at least one copy of the CYP4G15Δ18 variant detected in whole-genome sequences of populations from various geographical locations. The size of the circles represents the number of sequenced individuals per population. Source data are provided as a Source Data file.

References

    1. Bhatt, S. et al. The global distribution and burden of dengue. Nature496, 504–507 (2013). - PMC - PubMed
    1. Brady, O. J. & Hay, S. I. The global expansion of dengue: how Aedes aegypti mosquitoes enabled the first pandemic arbovirus. Annu. Rev. Entomol. 10.1146/annurev-ento-011019-024918 (2020). - PubMed
    1. Bennett, K. E. et al. Variation in vector competence for dengue 2 virus among 24 collections of Aedes aegypti from Mexico and the United States. Am. J. Trop. Med. Hyg.67, 85–92 (2002). - PubMed
    1. Gubler, D. J., Nalim, S., Tan, R., Saipan, H. & Sulianti Saroso, J. Variation in susceptibility to oral infection with dengue viruses among geographic strains of Aedes aegypti. Am. J. Trop. Med. Hyg.28, 1045–1052 (1979). - PubMed
    1. Bosio, C. F., Beaty, B. J. & Black, W. C. Quantitative genetics of vector competence for dengue-2 virus in Aedes aegypti. Am. J. Trop. Med. Hyg.59, 965–970 (1998). - PubMed

Substances

LinkOut - more resources