Microbiome drives age-dependent shifts in brain transcriptomic programs at the single-cell level in Drosophila
- PMID: 40796784
- PMCID: PMC12344059
- DOI: 10.1038/s41522-025-00781-z
Microbiome drives age-dependent shifts in brain transcriptomic programs at the single-cell level in Drosophila
Abstract
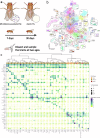
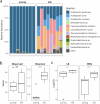
The gut microbiome plays a critical role in brain function and the brain-gut axis, yet its cellular and molecular mechanisms remain unclear. Here, we present the first comprehensive single-cell transcriptomic atlas of brain cells from adult Drosophila melanogaster raised under axenic and microbiome-associated conditions, spanning young and old ages. Profiling 34,427 cells across 101 clusters, we annotated 56 cell types and identified cell type-specific gene signatures influenced by the microbiome. Transcriptional shifts were most pronounced in old flies, with glial cells and dopaminergic neurons among the most microbiome-responsive cell types. Differentially expressed genes (DEGs) were enriched in pathways related to mitochondrial activity, energy metabolism, and Notch signaling. We also quantified age-associated changes in the gut microbiome, observing reduced Acetobacter dominance and increased microbial diversity that corresponded with heightened brain transcriptional responses. These findings illuminate the cell type-specific impacts of the microbiome on brain gene expression and lay the groundwork for understanding the molecular underpinnings of the microbiome-gut-brain axis.
© 2025. The Author(s).
Conflict of interest statement
Competing interests: The authors declare no competing interests.
Figures


Similar articles
-
Reduced expression of Pss gene in Drosophila cortex glia causes dopaminergic cell death.J Parkinsons Dis. 2025 Aug;15(5):957-969. doi: 10.1177/1877718X251349407. Epub 2025 Jun 16. J Parkinsons Dis. 2025. PMID: 40518954
-
Kismet/CHD7/CHD8 affects gut microbiota, mechanics, and the gut-brain axis in Drosophila melanogaster.Biophys J. 2025 Mar 18;124(6):933-941. doi: 10.1016/j.bpj.2024.06.016. Epub 2024 Jun 19. Biophys J. 2025. PMID: 38902926
-
Bladder cancer microbiome and its association with chemoresponse.Front Oncol. 2025 Jul 21;15:1506319. doi: 10.3389/fonc.2025.1506319. eCollection 2025. Front Oncol. 2025. PMID: 40761254 Free PMC article.
-
Pharmaco-psychiatry and gut microbiome: a systematic review of effects of psychotropic drugs for bipolar disorder.Microbiology (Reading). 2025 Jun;171(6):001568. doi: 10.1099/mic.0.001568. Microbiology (Reading). 2025. PMID: 40528728 Free PMC article. Review.
-
Behavioral interventions to reduce risk for sexual transmission of HIV among men who have sex with men.Cochrane Database Syst Rev. 2008 Jul 16;(3):CD001230. doi: 10.1002/14651858.CD001230.pub2. Cochrane Database Syst Rev. 2008. PMID: 18646068
References
-
- Morais, L. H., Schreiber, H. L. & Mazmanian, S. K. The gut microbiota–brain axis in behaviour and brain disorders. Nat. Rev. Microbiol.19, 241–255 (2021). - PubMed
-
- Daly, K. et al. Toll-like receptor 9 expressed in proximal intestinal enteroendocrine cells detects bacteria resulting in secretion of cholecystokinin. Biochem. Biophys. Res. Commun.525, 936–940 (2020). - PubMed
Grants and funding
LinkOut - more resources
Full Text Sources

