. 2025 Aug 12;26(1):242.
doi: 10.1186/s13059-025-03720-5.

Mutations of short tandem repeats explain abundant trait heritability in Arabidopsis

Affiliations

Mutations of short tandem repeats explain abundant trait heritability in Arabidopsis

Zhi-Qin Zhang et al. Genome Biol. .

Abstract

Background: Short tandem repeat (STR) mutations are major drivers of genetic variation and deeply influence phenotypic diversity and evolution, they are often overlooked despite their significant effects.

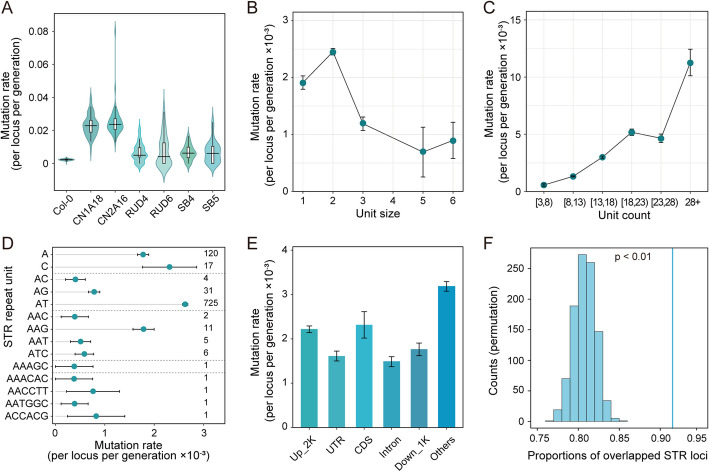
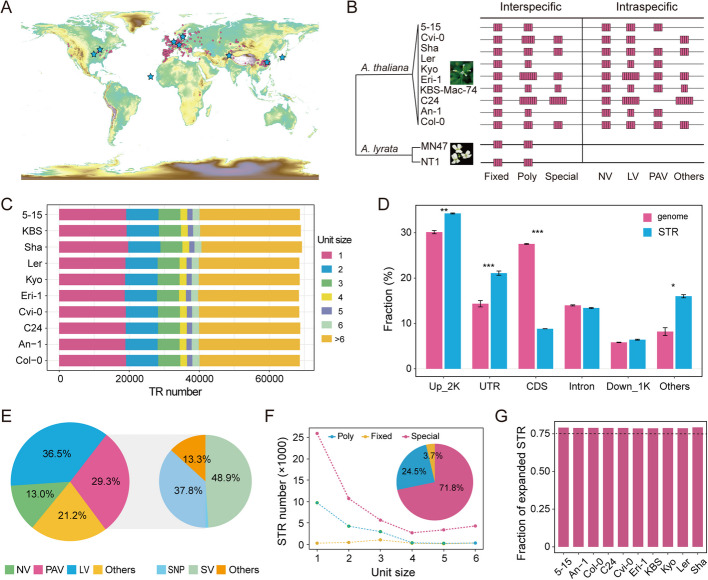
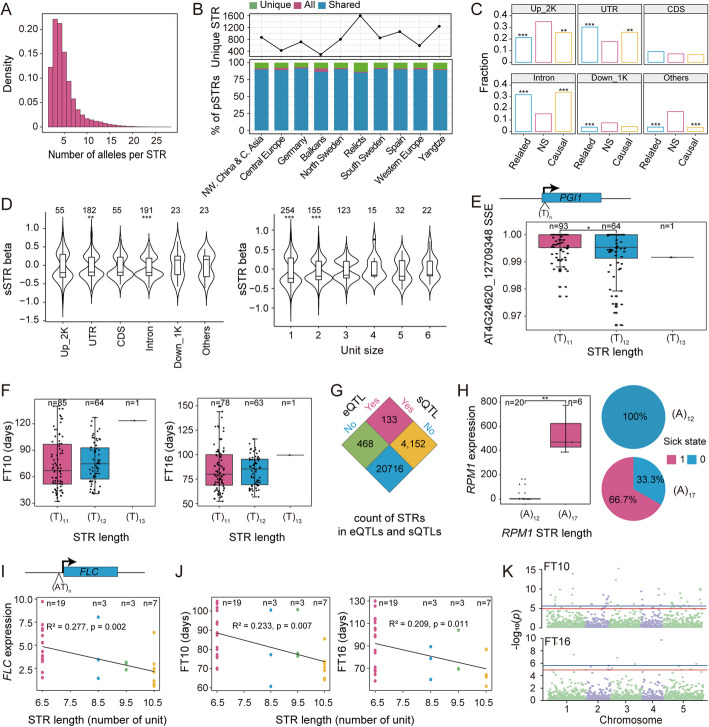
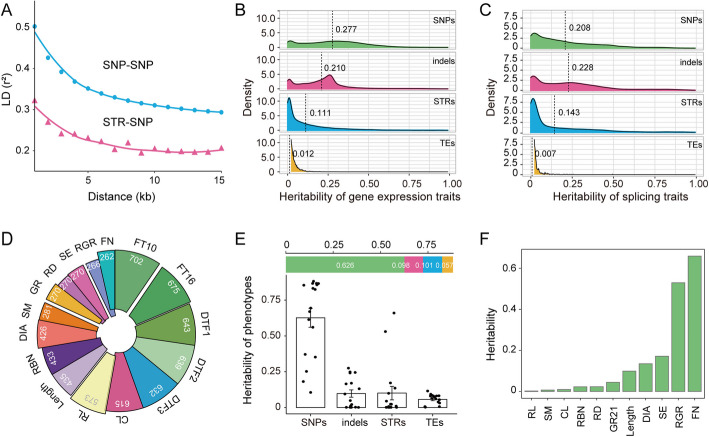
Results: Here, we leverage mutation accumulation lines descended from Col-0 accession of Arabidopsis thaliana to assess the variation in the repeat length of STRs (STR mutation rate). We find that STR mutation rate far exceeds single nucleotide polymorphisms rates. Interspecific comparison between A. thaliana and Arabidopsis lyrata reveals rapid STR turnover, with the most majority of the loci occurring only in A. thaliana. Intraspecific comparison of ten assembled A. thaliana genomes reveals that 29.3% of STRs display presence/absence variations, 36.5% show length variation, 21.2% have both types of variations, while only a small proportion have no variation. By association analysis, we find several STRs are associated with diverse phenotypes. Further analysis based on RNA-seq dataset from 413 accessions, we identify 3,871 expression-associated STRs and 651 splicing-associated STRs, of which over one thousand co-localized with known signals for diverse traits detected by genome-wide association studies. Notably, based on analysis of the expression levels of 24,175 genes and splice site strength values of 12,784 splice sites, as well as 16 phenotypes of natural A. thaliana populations, we determine the similar average heritability of these three trait sets explained by STR variation.

Conclusions: Our results reveal the evolutionary dynamics of STRs, and highlight the importance of STR variation as an important contributor to missing heritability in regulating complex traits.

Keywords: Arabidopsis thaliana; Evolution; Missing heritability; Mutation rate; Natural variation; Short tandem repeats.


Conflict of interest statement

Declarations. Ethics approval and consent to participate: Not applicable. Consent for publication: Not applicable. Competing interests: The authors declare no competing interests.

Figures

Fig. 1
Fig. 1
STR mutational landscape in mutation accumulation (MA) lines. A STR mutation rates (per STR locus per generation) for seven A. thaliana founder lines (Col-0, CN1A18, CN2A16, RUD4, RUD6, SB4, and SB5) after 8–25 generations of mutation accumulation. B The mutation rates for STRs of different unit size. Error bars indicate mean ± SE. C The mutation rates for STRs of different unit count in Col-0. Error bars indicate mean ± SE. D The mutation rates for STRs of different repeat units. Some repeat units are not shown because no variation of these motifs has been identified in MA lines, probably due to limited generation. The number on the right represents the number of STR loci identified for different repeat unit. E STR mutation rates in different genomic regions. "Others" are STRs not present in 2 kb upstream (Up_2K), untranslated regions (UTR), coding sequences (CDS), intron and 1 kb downstream (Down_1K) of genes. F The numbers represent the expected and observed overlap ratios between the mutated STR loci found in Col-0 MA lines and the polymorphic STR loci found in the 1,168 natural accessions. The histogram represents the distribution of expected overlap, and 1,000 permutations were performed to generate the expected distribution; and the vertical line represents observed overlap
Fig. 2
Fig. 2
Intra- and interspecific STR mutational landscape. A Geographical distribution of nine assembled non-reference Arabidopsis accessions (blue stars) and 1,168 resequenced (red points) accessions analyzed. B Schematic diagrams of different classes of STR variation. STR variation among species can be divided into three categories: Fixed, STR loci with the same motif and repeat unit number; Poly, STR loci with the same motif but different repeat unit number; Special, STR loci only present in Arabidopsis. STR variation within species can be divided into four categories: PAV, STR loci with presence/absence variation; LV, STR loci with length variation; NV, STR loci with no variation; Others, STR loci with both LV and PAV together. C Identification of tandem repeats in the collinear regions of ten assembled genomes. Each bar shows the number of homopolymer, dinucleotide, trinucleotide, tetranucleotide, pentanucleotide, hexanucleotide repeats and repeating sequences with repeat units greater than six. D Distribution of genomic regions and STR loci across genomic annotations. Genome: the proportion of different functional regions in the ten assembled genomes. STR: the proportion of STR loci in different genomic regions of the ten assembled genomes. Fisher’s exact test was used. *, p < 0.05; **, p < 0.01; ***, p < 0.001. Error bars means (± SE). E Left: Overview of the type of STR mutations detected at ten assembled genomes. Right: the proportion of STR PAVs contributed by different variations. F Overview of the STR mutation types detected between Arabidopsis and A. lyrata. The number of Fixed, Poly, and Special STRs for various motif sizes is displayed in a line chart, and the proportions of each are displayed in a pie chart. G The proportion of expanded STRs in Arabidopsis relative to A. lyrata. KBS denotes sample KBS-Mac-74
Fig. 3
Fig. 3
The functional impact of STR variation. A The distribution of allele counts per STR locus across all genotyped STRs in 1,168 accessions. B Number of unique STRs (upper) and proportions of different polymorphic STRs (pSTRs) (lower) across different populations of 1,168 accessions. Unique, only exists in one population; Shared, exist in two or more but not all populations; All, exist in all populations. C The proportion of sSTRs in each category (NS, related, or causal) in each genomic region. NS, STRs that were not reported to be significantly correlated with any alternative splicing site; related, STRs that were significantly associated with at least one alternative splicing site but were not reported as causal; causal, STRs that were reported as causal for at least one alternative splicing site. The p value displayed above the bars represents Fisher's exact test for enrichment significance, in contrast to STRs with no significant correlation with other splicing site. *, p < 0.05; **, p < 0.01; ***, p < 0.001. D Left: the effect size (beta value) of sSTRs classes across genomic annotations. Right: the effect size of sSTRs classes with different motif lengths. Binomial test was used. Beta value represents the effect size of STR loci on splicing variation, and a value greater than 0 indicates a positive correlation. E sSTR associated with AT4G24620_12709348 splice variation. The x-axis shows STR genotype and the y-axis gives Splice-site Strength Estimate (SSE) value. Repeat number variation of STR in the intron of PGI1 is correlated with flowering time variation. The x-axis shows STR genotype and the y-axis gives flowering time in 10 °C (FT10) and 16 °C (FT16). G Counts of STR in eQTL and sQTL. eQTL: expression quantitative trait loci. sQTL: splicing quantitative trait loci. H Repeat number variation near RPM1 is linked with GWAS signal of pathogen susceptibility. Left: the x-axis shows STR genotype and the y-axis gives normalized RPM1 expression. Wilcox test was used. Right: the pie chart represents the proportion of different susceptibility states under (A)12 (upper) and (A)17 (lower). 0 represents disease resistance and 1 represents disease susceptibility. I eSTR associated with FLC expression variation. The x-axis shows STR genotype and the y-axis gives normalized FLC expression. J Repeat number variation of STR in 2 kb upstream of FLC is correlated with flowering time variation. The x-axis shows STR genotype and the y-axis gives flowering time in 10 °C (FT10) and 16 °C (FT16). K GWAS analysis of FT10 and FT16. The red horizontal line corresponds to the significance threshold (0.05/STR loci number) and blue horizontal line corresponds to the significance threshold (0.01/STR loci number)
Fig. 4
Fig. 4
Trait heritability contributed by STRs. A LD estimates for SNP-SNP and SNP-STR loci. Loess regression lines for each category are plotted. B Comparison of heritability of gene expression level contributed by STRs, SNPs, TEs and indels. Heritability was estimated by random effects corresponding to each category. The vertical dashed lines indicate the mean values. C Comparison of heritability of alternative splicing strength contributed by STRs, SNPs, TEs and indels. The vertical dashed lines indicate the mean values. D The phenotypes used to calculate heritability. Numbers indicates available accessions of each phenotype. E Comparison of heritability of phenotypes contributed by STRs, SNPs, TEs and indels. Horizontal bar chart represents the average heritability contributed by various variants; from left to right, SNPs, indels, STRs and TEs. Error bars indicate mean ± SE. F The heritability contributed by STRs in diverse phenotypes. Four phenotypes (DTF2, CL, RL and DIA) without any heritability contribution from STRs were not shown

Similar articles

References

    1. Willems T, Zielinski D, Yuan J, Gordon A, Gymrek M, Erlich Y. Genome-wide profiling of heritable and de novo STR variations. Nat Methods. 2017;14:590–2. - PMC - PubMed
    1. McGurk MP, Barbash DA. Double insertion of transposable elements provides a substrate for the evolution of satellite DNA. Genome Res. 2018;28:714–25. - PMC - PubMed
    1. Messier W, Li S-H, Stewart C-B. The birth of microsatellites. Nature. 1996;381:483–3. - PubMed
    1. Ellegren H. Microsatellites: simple sequences with complex evolution. Nat Rev Genet. 2004;5:435–45. - PubMed
    1. Fotsing SF, Margoliash J, Wang C, Saini S, Yanicky R, Shleizer-Burko S, Goren A, Gymrek M. The impact of short tandem repeat variation on gene expression. Nat Genet. 2019;51:1652–9. - PMC - PubMed

LinkOut - more resources