. 2025 Aug 13;16(1):7493.
doi: 10.1038/s41467-025-62762-2.

CYP1B1-AS1 regulates CYP1B1 to promote Coxiella burnetii pathogenesis by inhibiting ROS and host cell death

Affiliations

CYP1B1-AS1 regulates CYP1B1 to promote Coxiella burnetii pathogenesis by inhibiting ROS and host cell death

Aryashree Arunima et al. Nat Commun. .

Abstract

Coxiella burnetii (Cb), the causative agent of Q fever, replicates within host macrophages by modulating immune responses through poorly understood mechanisms. Long non-coding RNAs (lncRNAs) are crucial yet underexplored regulators of inflammation, particularly in Cb pathogenesis. Employing a comparative transcriptomic analysis of THP-1 macrophages infected with 16 different microbes, we dissect a core set of immune-responsive lncRNAs such as MAILR, LINC01215, PACER, and MROCKI-common to human anti-pathogen responses, and distinguish them from lncRNAs specifically altered at early (1 h) time points in individual infections. In particular, our approach identifies lncRNA CYP1B1-AS1 as specifically upregulated in a spatiotemporal manner along with CYP1B1 in cis during Cb infection. Promoter assays confirm their co-regulation via a shared bidirectional promoter, while aryl hydrocarbon receptor (AHR)-lucia luciferase and nuclear translocation assays demonstrate that Cb infection activates AHR, driving their transcription. Knockdown of CYP1B1-AS1 or CYP1B1 alone disrupts mitochondrial homeostasis, increases ROS and mitochondrial dysfunction, and exacerbates apoptosis during infection. These findings position the CYP1B1-AS1/CYP1B1 axis as a key regulator of mitochondrial homeostasis under AHR signaling, supporting an intracellular environment that benefits Cb replication. Our results highlight the critical roles of lncRNAs in immune regulation and provide a valuable resource for future lncRNA research.


Conflict of interest statement

Competing interests: The authors declare no competing interests.

Figures
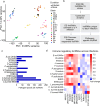
Fig. 1
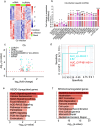
Fig. 1. RNA-seq analysis reveals common and pathogen-specific immune-regulatory lncRNA expression profiles in THP-1 macrophages across bacterial infections.
a Principal component analysis (PCA) of RNA-seq data illustrating transcriptional variance across infections, including C. burnetii Nine Mile Phase II (Cb), C. burnetii Nine Mile Phase II dotA::Tn (CbA), C. burnetii Nine Mile Phase II dotB::Tn (CbB), Escherichia coli DH5α (Ec5), enterohemorrhagic E. coli O157 (EcT/EHEC), E. coli O157Δstx (EcN/EHECΔstx), Bacillus subtilis P31K6 (Bs), Francisella novicida U112 (Fn), Pseudomonas aeruginosa PAO1 (Pa), Staphylococcus aureus JE2 (Sa), Salmonella enterica subsp. Typhimurium SL1344 (STm), Rhizobium radiobacter (Rr), Micrococcus luteus (Ml), Listeria innocua (Li), Enterococcus faecalis (Ef), and Brucella melitensis ΔvjbR (Bmv). PCA was performed using normalized RNA-seq data to assess global transcriptional variance. Infected samples are denoted by circles; mock-infected controls as triangles. Data points are color-coded by infection. b Experimental workflow for identifying common and pathogen-specific lncRNAs following infection of THP-1 macrophages. Schematics created using BioRender.com. c Bar graph summarizing the number of pathogen-specific differentially expressed (DE) lncRNAs identified across the infections analyzed. d Heatmap showing quantitative real-time PCR (RT-qPCR) validation of selected immune-regulatory lncRNAs that are either commonly regulated across infections or specifically altered during C. burnetii infection. Expression normalized to ACTB and shown relative to mock-infected controls (set to 1). lncRNAs with a log₂ fold change ≥ 1.5 or ≤ 0.5 were considered DE. Data represent mean ± SD from three independent experiments (n = 3). Source data are provided as a Source Data file.
Fig. 2
Fig. 2. CYP1B1-AS1 and ENSG00000286147 (lnc-DKK2) as C.burnetii infection-associated lncRNAs.
a Hierarchical clustering heatmap of differentially expressed (DE) lncRNA-mRNA pairs during C. burnetii (Cb, NMII) infection. Each row represents a gene, and each column represents a biological replicate (n = 4). Color intensity indicates normalized gene expression. b RT-qPCR validation of DE lncRNAs specific to Cb and CbΔdotA (CbA) infections. Gene expression normalized to ACTB and shown relative to mock-infected controls (set to 1). Data represent the mean ± SD from three independent experiments (n = 3). Statistical test: two-way ANOVA; exact p-values (in the same order as the asterisks): lnc-DKK2: 0.035; PKP4-AS1: 0.008; GSTCD-AS1: 0.0487; DDX11-AS1: 0.0432; ENSG00000285650: 0.045; ENSG00000261668: 0.008; ENSG00000273669: 0.0087; ENSG00000260430: 0.035; LBX2-AS1: 0.0279; LINC03072: 0.008; TLR8-AS1: <0.0001; LINC01232: 0.0002; SBF2-AS1: <0.0001; LINC00942: 0.002; LINC00926: 0.008; LINC01426: 0.004; NRAD1: 0.0326; UBR5-DT: 0.0086; PIRAT1: 0.0049; CYP1B1-AS1: <0.0001. c Scatter plot of DE lncRNAs and mRNAs during Cb infection, highlighting CYP1B1-AS1 (violet), lnc-DKK2 (blue), and their target mRNAs CYP1B1 (green) and DKK2 (yellow). d Receiver operating characteristic (ROC) curve analysis displaying the diagnostic value of lnc-DKK2 and CYP1B1-AS1 in infection models, with area under the curve (AUC) values at p < 0.01 and 95% confidence intervals (CI). e, f KEGG pathway enrichment analysis of mRNAs associated with DE lncRNAs: e upregulated, f downregulated. Statistical test: one-sided Fisher’s exact test; p-values adjusted using the Benjamini–Hochberg false discovery rate (FDR) method. Bar height represents −log10(p-value) with color intensity representing the proportion of transcripts associated with each pathway. Source data are provided in the Source Data file.
Fig. 3
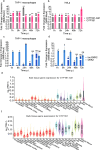
Fig. 3. Spatiotemporal expression of CYP1B1-AS1 and lnc-DKK2 during C.burnetii infection.
a RT-qPCR analysis of CYP1B1-AS1 and CYP1B1 in infected THP-1 macrophages (NMII) at the indicated time points. Statistical test: two-way ANOVA; exact p-values (in the order as asterisks): CYP1B1-AS1: 0.03, 0.009, 0.003, 0.0038, and 0.0044; CYP1B1: 0.021, 0.0098, 0.009, 0.0042, and 0.0086. b RT-qPCR analysis of CYP1B1-AS1 and CYP1B1 in infected HeLa cells. Statistical test: two-way ANOVA; exact p-values (in the order as asterisks): CYP1B1-AS1: 0.0089, 0.05, 0.0035, 0.048, and 0.036; CYP1B1: 0.029, 0.0395, 0.0027, 0.0102, and 0.033. c, d RT-qPCR analysis of lnc-DKK2 and DKK2 in infected c THP-1 macrophages and d HeLa. Statistical test: two-way ANOVA; *p < 0.05; **p < 0.01; ns, not significant, p ≥ 0.05. Exact p-values are provided in the Source data file. For ad, expression was normalized to ACTB and shown relative to mock-infected controls (set to 1). Data represent mean ± SD from three independent experiments. e, f Bulk RNA-seq–based tissue expression profiles of e CYP1B1-AS1 and CYP1B1 from the Genotype-Tissue Expression (GTEx v.10) database, shown as log10-transcripts per million (TPM + 1). TPMs were computed from gene models with isoforms collapsed to a single gene; no additional normalization was applied. These data are derived from a publicly available RNA-seq database; biological/technical replication is not applicable. Box plots show the median (center line), 25th and 75th percentiles (box), and whiskers at 1.5× the interquartile range (IQR). Data points outside this range are plotted as individual outliers. Tissues include brain regions (e.g., amygdala, hippocampus, cerebellum) and peripheral tissues (e.g., liver, lung, kidney, spleen, blood).
Fig. 4
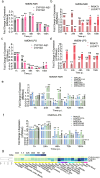
Fig. 4. Temporal analysis of CYP1B1-AS1 and immune-responsive lncRNAs in primary human monocyte-derived macrophages (hMDMs) during C. burnetii NMI infection.
hMDMs were either infected with Cb-NMI at an MOI of 10 or stimulated with lipopolysaccharide (LPS, 10 ng/mL). RT-qPCR analysis of (a) CYP1B1-AS1 and CYP1B1 and (b) PIRAT1 and LUCAT1 in Cb-NMI-infected hMDMs at various time points (p.i.). Statistical test: two-way ANOVA; exact p-values (in the same order as asterisks): CYP1B1-AS1: 0.0075, 0.0218, 0.0089; CYP1B1: 0.0006, 0.0458, 0.0057; PIRAT1: 0.001, 0.0037, 0.0029; LUCAT1: 0.001, 0.0035, 0.014, 0.0229; and ns, not significant, p ≥ 0.05. RT-qPCR analysis of (c) CYP1B1-AS1 and CYP1B1, d PIRAT1 and LUCAT1 in LPS-treated hMDMs. Statistical test: two-way ANOVA; exact p-values (in the same order as asterisks): CYP1B1-AS1: 0.0006, 0.0008 and 0.0178; CYP1B1: 0.0039, 0.0002, 0.0003 and 0.0122; PIRAT1: 0.0007 and 0.0051; LUCAT1: 0.0022, 0.0007, and 0.05; and ns, p ≥ 0.05. Expression dynamics of core immune-responsive lncRNAs (MAILR, LINC01215, PACER, MROCKI, MIR155HG, and MIR222HG) in response to (e) Cb-NMI infection or (f) LPS stimulation. Statistical test: two-way ANOVA; *p < 0.05; **p < 0.01; ***p < 0.001; ****p < 0.0001; ns not significant, p ≥ 0.05. Exact p-values are provided in the Source data file. For all data af: expression normalized to ACTB and shown as fold changes relative to uninfected or unstimulated controls (mock, set to 1). Data represent mean ± SD of three technical replicates from two independent experiments. g GTEx-heatmap showing co-expression of CYP1B1-AS1, CYP1B1, and AHR across human tissues. Values are presented as log10(TPM + 1) with color intensity representing relative gene expression.
Fig. 5
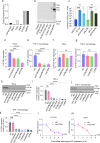
Fig. 5. CYP1B1-AS1 is transcribed from a shared bidirectional promoter and regulates CYP1B1 in cis.
a Coding Potential Assessment Tool (CPAT) analysis predicting low coding potential for CYP1B1-AS1. Known lncRNAs (TUG1, NEAT1, ANCR, MALAT1), and mRNAs (CYP1B1, GAPDH) serve as controls. b Immunoblot analysis of HEK293T cells transfected with pCDNA-CYP1B1-AS1. Controls: untransfected, empty vector (pCDNA-FLAG) and FLAG-tagged ANCR, CYP1B1, or GAPDH. c Dual-luciferase assay demonstrating bidirectional promoter activity (arbitrary units) of the CYP1B1-AS1 promoter (PCYP1B1-AS1), driving Firefly (F-Luc/FL) and Renilla luciferase (R-Luc/RL). pF-Luc and pR-Luc are positive controls for ACTB promoter (PACTB), and pGL4 is an empty vector. Statistical test: one-way ANOVA. Exact p-values: pF-Luc: 0.0001; pCYP1B1FL: 0.0029; pR-Luc: 0.0004; pCYP1B1RL: 0.0037. RT-qPCR showing reduced CYP1B1 expression after CYP1B1-AS1 knockdown in (d) HeLa and (e) THP-1 macrophages. RT-qPCR showing CYP1B1-AS1 expression following CYP1B1 knockdown in (f) HeLa and (g) THP-1 macrophages. Expression normalized to HPRT. KD1/KD2 represent different siRNA-mediated knockdowns or their combination (lncCYPB for CYP1B1-AS1, CYPB for CYP1B1). Statistical test dg: one-way ANOVA; exact p-values: d ***p = 0.0002 (lncCYPB-KD1); d ***p = 0.0003 (lncCYPB-KD2); d, e ****p < 0.0001; f, g ns not significant, p ≥ 0.05. h Immunoblot and (i) densitometry analysis of CYP1B1 after CYP1B1-AS1 or CYP1B1 knockdown in HeLa cells. j Immunoblot, and (k) densitometry analysis of CYP1B1 after CYP1B1-AS1 or CYP1B1 knockdown in THP-1 macrophages. Statistical test i, k: one-way ANOVA; ns, p ≥ 0.05; ****p < 0.0001. β-Actin: the loading control. l, m mRNA decay assay measuring half-lives (t1/2) of (l) CYP1B1 and (m) HPRT in NC and lncCYPB cells after actinomycin D treatment. Decay calculated from a one-phase regression plot from 2(−ΔCT) values. All blots and data represent mean ± SD from three independent experiments (n = 3). Source data are provided as a Source Data file.
Fig. 6
Fig. 6. Knockdown of CYP1B1-AS1 and CYP1B1 enhances inflammation and restricts C.burnetii replication.
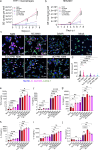
a, b Intracellular replication of C.burnetii (NMII) assessed by genomic equivalent (GE) quantification over a 7-day time course following knockdown of CYP1B1-AS1 (lncCYPB), CYP1B1 (CYPB), or both (dCYPB) and negative control siRNA-treated (NC) in (a) THP-1 macrophages (MOI = 50) and (b) HEK293T cells (MOI = 100). Additional controls include CbA-infected (ΔdotA) and uninfected cells (mock). Data represent mean ± SD from three independent experiments (n = 3). Statistical test (a-b): two-way ANOVA; exact p-values; p = 0.007 (ΔdotA); p = 0.008 (lncCYPB: NMII); p = 0.0073 (CYPB: NMII); p = 0.0091 (dCYPB:NMII); ****p < 0.0001; ns not significant, p ≥ 0.05. c Representative immunofluorescence images of THP-1 macrophages infected with C. burnetii (NMII or ΔdotA) at 5 days p.i. Nuclei (Hoechst 33342, blue), LAMP-1 (lysosomal marker, green), C.burnetii (magenta), Scale bar: 10 μm. d Quantification of Coxiella-containing vacuoles (CCVs) area using ImageJ, QuPath, and Labkit, with each LAMP-1+ bacterial compartment representing an individual CCV. Data represent median at 95% CI of 100 CCVs per repeat (n = 3); one-way ANOVA; ****p < 0.0001; ns, p ≥ 0.05. ej ELISA quantification of cytokines in supernatants from THP-1 macrophages under indicated knockdown and infection conditions: e TNF-α, f IL-6, g IL-8, and h IL-1β, i IL-10, and j IFN-γ. For ej, data represent mean ± SD for n = 3. Statistical test: one-way ANOVA; *p < 0.05; **p < 0.01; ***p < 0.001; ****p < 0.0001; ns, p ≥ 0.05. Exact p-values and source data are provided as a Source Data file.
Fig. 7
Fig. 7. AHR signaling transcriptionally regulates CYP1B1-AS1 and CYP1B1 during C. burnetii infection.
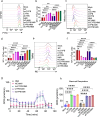
a RT-qPCR analysis of CYP1B1-AS1 in C. burnetii-infected (NMII) THP-1 cells, with or without AHR agonist FICZ (200 or 400 nM). Expression normalized to HPRT and compared to mock. Statistical test: two-way ANOVA; ****, p < 0.0001. Representative immunoblot (b) and densitometry (c) of CYP1B1 protein following NMII infection and/or FICZ treatment. β-Actin: loading control. Statistical test: two-way ANOVA; *p < 0.05; **p < 0.01; ***p < 0.001. d AHR nuclear translocation assessed by fractionation and immunoblotting after infection and FICZ (400 nM) treatment. Lamin B1 (nuclear) and α-Tubulin (cytoplasmic) were used as controls. Samples were from the same experiment, processed in parallel (n = 3). Nuc-nuclear fraction; Cyto-cytoplasmic fraction; WCL-whole cell lysate. e Densitometry quantification of AHR in Nuc vs. WCL, normalized to Lamin B1. One-way ANOVA; **p = 0.002; ****p < 0.0001. f Densitometry quantification of AHR in Nuc vs. Cyto (normalized to α-Tubulin). One-way ANOVA; ***p = 0.0003; ****p < 0.0001. g AHR-luciferase reporter assay in HepG2-AHR-Lucia cells infected with NMII and treated with FICZ (400 nM) or AHR antagonist CH-223191 (10 μM). Luminescence was measured over 150 h p.i., and normalized to mock. NC = endotoxin-free water; CH223 = antagonist control. Two-way ANOVA; exact p-values: 0.0005 (FICZ-1h); 0.0003 (NMII-1h); 0.009 (NMII-FICZ-1h); <0.0001. RT-qPCR analysis of CYP1B1-AS1 and CYP1B1 after AHR knockdown (AHR-KD) in (h) HeLa and i THP-1. Expression normalized to HPRT and compared to negative control siRNA (NC)-treated cells. h, i Two-way ANOVA; exact p-values: ***p = 0.0002; ****p < 0.0001. Immunoblot and densitometry analysis of CYP1B1 protein following AHR knockdown in j, k HeLa and l, m THP-1. β-Actin: loading control. k, m: one-way ANOVA; exact p-values: *p = 0.0109 (k); *p = 0.0159 (m); ns, p ≥ 0.05. All data represent mean ± SD; n = 3. Source data are provided as a Source Data file.
Fig. 8
Fig. 8. Knockdown of CYP1B1-AS1 and CYP1B1 induces mitochondrial ROS and impairs mitochondrial function.
Flow cytometry and metabolic assays were performed on THP-1 macrophages with siRNAs targeting CYP1B1 (CYPB), CYP1B1-AS1 (lncCYPB), or both (dCYPB), and C. burnetii-infected (NMII) conditions at 24 h p.i. a, b Total ROS production assessed by flow cytometry, measured as mean fluorescence intensity (MFI) of DCFDA-stained cells compared to mock. Statistical test: one-way ANOVA; ****p < 0.0001; **p = 0.006 (NMII); **p = 0.0021 (NC: NMII). c, d Mitochondrial ROS production assessed by flow cytometry, measured as MFI of MitoSOX™ Red-stained cells. e, f Mitochondrial membrane potential assessed by flow cytometry, measured as MFI of MitoProbe™ TMRM-stained cells. For d, f; Statistical test: one-way ANOVA; ****p < 0.0001. g Oxygen consumption rate (OCR) measured using an Agilent Seahorse Metabolic Analyzer to evaluate mitochondrial respiration. h Maximal respiration was measured across knockdown and controls. Statistical test: two-way ANOVA; ****p < 0.0001. All data represent mean ± SD from three independent experiments (n = 3). Source data are provided as a Source Data file.
Fig. 9
Fig. 9. CYP1B1-AS1 and CYP1B1 regulate mitochondrial ROS and inhibit apoptosis.
af Flow cytometry analysis of apoptosis during CYP1B1-AS1 (lncCYPB), CYP1B1 (CYPB), dual knockdown (dCYPB), negative control (NC), and C. burnetii-infected (NMII) conditions at 24 h and 48 h p.i. Cells were stained with propidium Iodide (PI) and FITC-Annexin-V, at 24 h and 48 h p.i. to quantify populations of early apoptotic (Annexin-V+ PI; Q1), late apoptotic (Annexin-V+ PI+; Q2), dead (PI+; Q3), and non-apoptotic (Annexin-V PI; Q4) cells. Percentage of (a) early apoptotic, b late apoptotic, c dead cells at 24 h p.i. Percentage of (d) early apoptotic, e late apoptotic, f dead cells at 48 h p.i. For af, data represent mean ± SD from three independent experiments (n = 3). Statistical test: one-way ANOVA; *p < 0.05; **p < 0.01; ***p < 0.001; ****p < 0.0001; ns not significant, p ≥ 0.05. Exact p-values are provided in the Source Data file. g Proposed model of CYP1B1-AS1-mediated regulation of CYP1B1 during C. burnetii (Cb) infection. During Cb infection, aryl hydrocarbon receptor (AHR) is activated and translocates into the nucleus, where it transcriptionally induces both CYP1B1-AS1 and CYP1B1 from a shared bidirectional promoter. The activation of CYP1B1-AS1 influences CYP1B1 expression through a cis-regulatory mechanism within the local genome, thereby modulating CYP1B1 transcript levels. This enhances turnover of CYP1B1, a mitochondria-enriched cytochrome P450 enzyme involved in maintaining redox homeostasis. CYP1B1 modulates reactive oxygen species (ROS), suppresses ROS-driven inflammation, and inhibits apoptosis, thereby facilitating an intracellular environment favorable for Cb replication. Schematic was created using BioRender.com.

Update of

References

    1. van Schaik, E. J., Chen, C., Mertens, K., Weber, M. M. & Samuel, J. E. Molecular pathogenesis of the obligate intracellular bacterium Coxiella burnetii. Nat. Rev. Microbiol.11, 561–573 (2013). - PMC - PubMed
    1. Bird, L. E. et al. Coxiella burnetii manipulates the lysosomal protease cathepsin B to facilitate intracellular success. Nat. Commun.16, 3844 (2025). - PMC - PubMed
    1. Larson, C. L., Beare, P. A., Howe, D. & Heinzen, R. A. Coxiella burnetii effector protein subverts clathrin-mediated vesicular trafficking for pathogen vacuole biogenesis. Proc. Natl Acad. Sci. USA110, E4770–E4779 (2013). - PMC - PubMed
    1. Luhrmann, A., Nogueira, C. V., Carey, K. L. & Roy, C. R. Inhibition of pathogen-induced apoptosis by a Coxiella burnetii type IV effector protein. Proc. Natl Acad. Sci. USA107, 18997–19001 (2010). - PMC - PubMed
    1. Steiner, S., Meir, A. & Roy, C. R. Coxiella burnetii encodes an LvgA-related protein important for intracellular replication. Cell. Microbiol.23, e13331 (2021). - PubMed

MeSH terms

LinkOut - more resources