. 2025 Aug 12;16(1):7490.
doi: 10.1038/s41467-025-62826-3.

Genetic architecture of bone marrow fat fraction implies its involvement in osteoporosis risk

Affiliations

Genetic architecture of bone marrow fat fraction implies its involvement in osteoporosis risk

Zuyou Wu et al. Nat Commun. .

Abstract

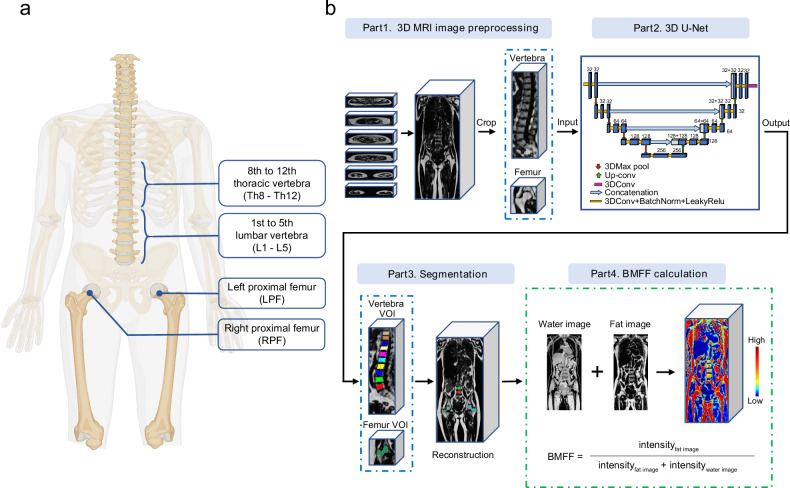
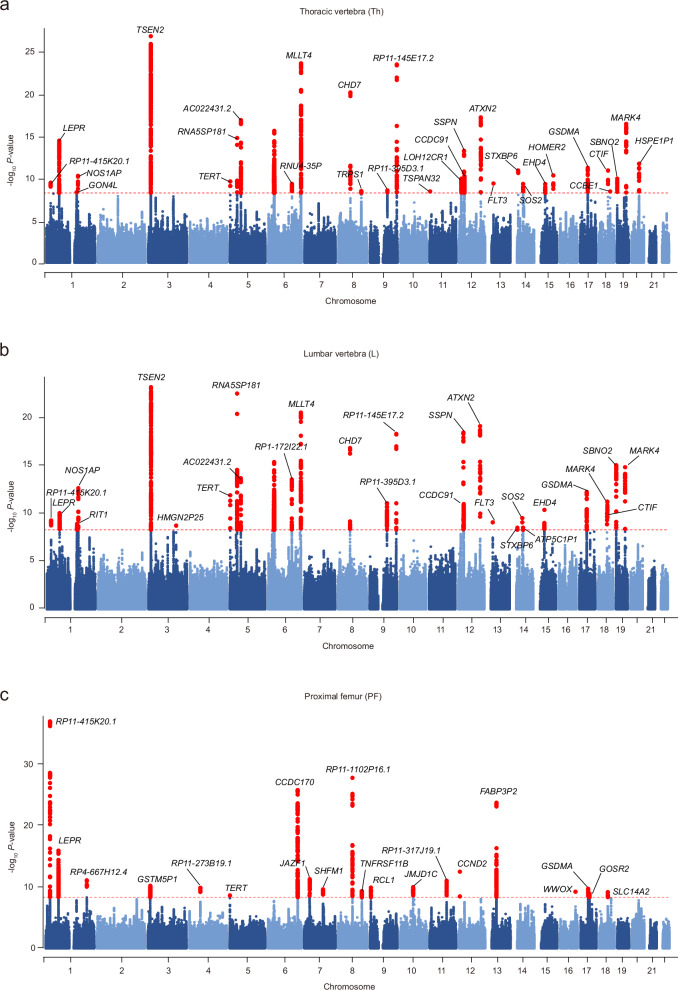
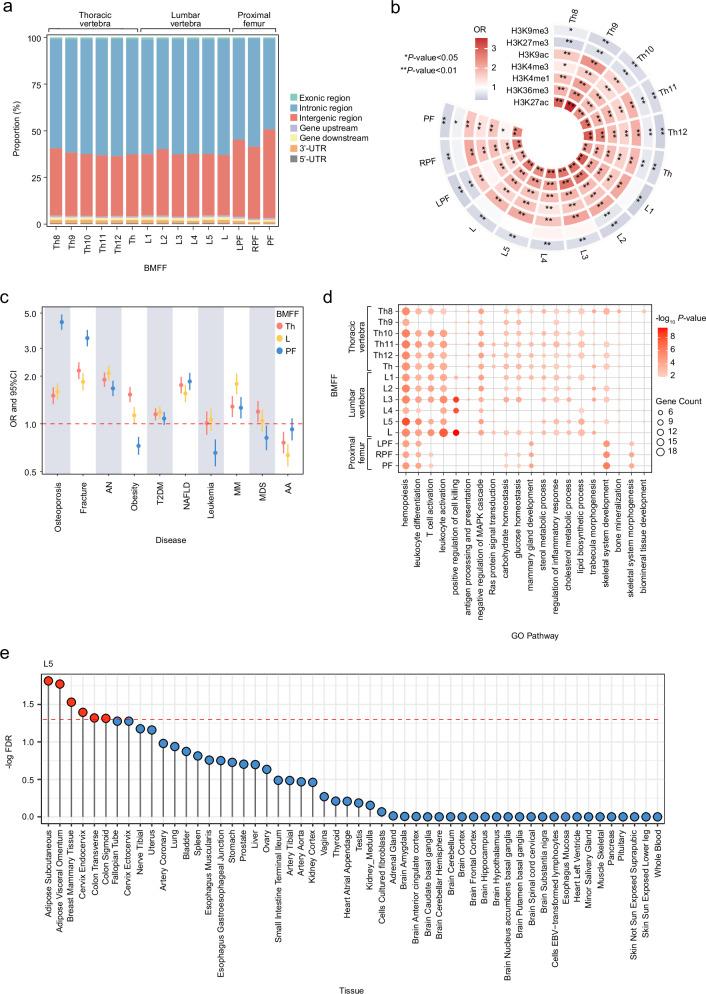
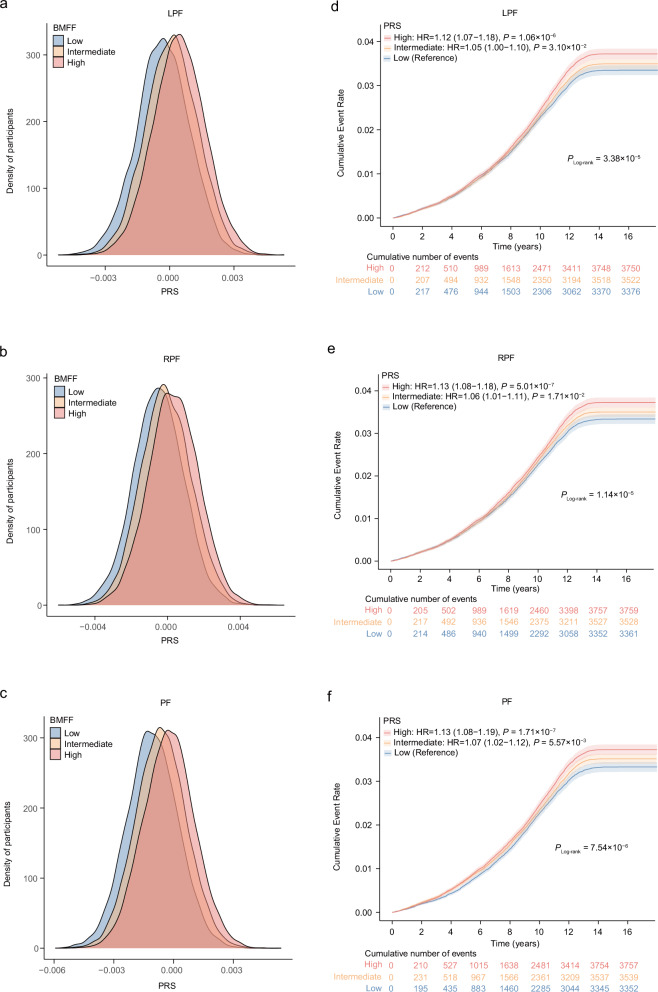
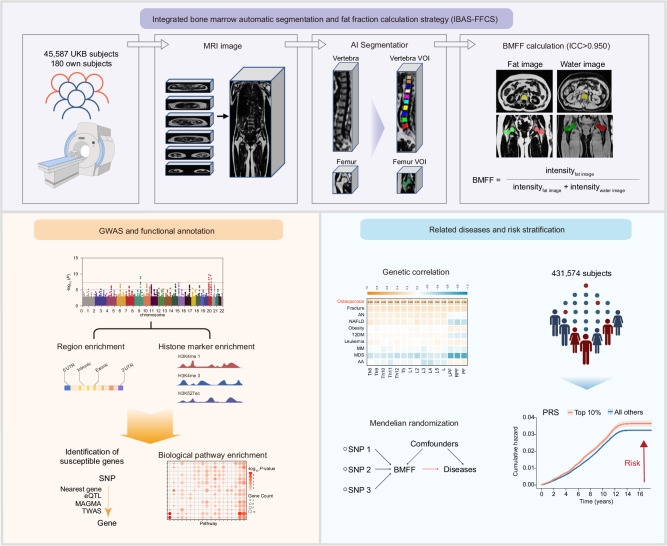
Bone marrow adipose tissue, as a distinct adipose subtype, has been implicated in the pathophysiology of skeletal, metabolic, and hematopoietic disorders. To identify its underlying genetic factors, we utilized a deep learning algorithm capable of quantifying bone marrow fat fraction (BMFF) in the vertebrae and proximal femur using magnetic resonance imaging data of over 38,000 UK Biobank participants. Genome-wide association analyses uncovered 373 significant BMFF-associated variants (P-value < 5 × 10⁻⁹), with enrichment in bone remodeling, metabolism, and hematopoiesis pathway. Furthermore, genetic correlation highlighted a significant association between BMFF and skeletal disease. In about 300,000 individuals, polygenic risk scores derived from three proximal femur BMFF were significantly associated with increased osteoporosis risk. Notably, Mendelian randomization analyses revealed a causal link between proximal femur BMFF and osteoporosis. Here, we show critical insights into the genetic determinants of BMFF and offer perspectives on the biological mechanisms driving osteoporosis development.


Conflict of interest statement

Competing interests: The authors declare no competing interests.

Figures

Fig. 1
Fig. 1. Integrated bone marrow automatic segmentation and fat fraction calculation strategy (IBAS-FFCS).
a IBAS-FFCS can calculate the fat fraction of the 8th to 12th thoracic vertebra, the 1st to 5th lumbar vertebra, and the proximal femur on both sides. b Part1. This study aligned and concatenated the six 3D 2-point Dixon MRI images and applied image enhancement strategies such as scaling intensity and random flipping to the images. All data were cropped according to the bounding box of the spine and femur, and then fed into the 3D-Unet model. Part2. The preprocessed images were fed into a deep learning 3D-Unet model for training, leveraging a GPU server equipped with an NVIDIA RTX 4090D GPU. The U-Net segmentation algorithm was continuously optimized based on the Dice loss function and the Adam algorithm. The topology of the whole network consists of the encoding and decoding subnetworks. Four stages in encoding and decoding counterparts indicate that four-level scales of feature maps were formulated for automatic feature extraction. Part3. The 3D-Unet outputted visual masks of the femur and spine, with different colors representing the left and right femurs, as well as the spine from L1 to Th8. Part4. The volume of interest (VOI) for the spine and femurs was extracted and transferred to the fat and water images of the two-point Dixon sequence, where the bone marrow fat fraction is calculated based on a computational formula. Panel a was created in BioRender. Wu, Z. (2025) https://BioRender.com/qdjyk0e.
Fig. 2
Fig. 2. Genome-wide association studies results for three representative BMFFs.
Manhattan plots show the chromosomal position on the x-axis and the −log10 P value on the y-axis for the GWAS result of BMFF of Th (a), L (b), and PF (c). The red solid line indicates the genome-wide significance threshold at P < 5 × 10−9. Loci that contain significant variants were labeled with the name of the nearest gene. P value are two-sided based on the chi-squared test statistics in the BOLT-LMM software. The genome-wide significance threshold at P < 5 × 10−9 was determined using a conservative Bonferroni correction, in which 0.05 was divided by the total number of SNPs analyzed in our GWAS (8,412,349), yielding approximately 5 × 10⁻⁹. BMFF bone marrow fat fraction, Th thoracic vertebra, L lumbar vertebra, PF proximal femur.
Fig. 3
Fig. 3. Functional characterization for risk variants of 15 BMFFs and pathway enrichment and tissue enrichment for susceptible genes of 15 BMFFs.
a Bar chart represents the proportions for risk variants of 15 BMFFs annotated with each functional category (intron region, gene upstream, and downstream regions, intergenic region, 3′-UTR, 5′-UTR and exon region). b Enrichment analyses for risk variants of 15 BMFFs among regions of histone modification, such as H3K4 monomethylation marks (H3K4me1), H3K4 trimethylation marks (H3K4me3), H3K27 acetylation marks (H3K27ac), H3K36 trimethylation marks (H3K36me3), and H3K9 trimethylation marks (H3K9me3). P value was calculated by two-tailed Fisher’s exact test. c Enrichment analyses for risk variants of thoracic vertebra, lumbar vertebra and proximal femur mean BMFF, respectively, among ten related disease risk loci. The number of candidate variants used was 7838 for Th, 7621 for L, and 7149 for PF. The number of control variants used was 7258 for Th, 7056 for L, and 6.646 for PF. P value was calculated by two-tailed Fisher’s exact test. The error bars represent the 95% confidence interval. d Pathway enrichment analyses of Gene Ontology terms were performed at http://kobas.cbi.pku.edu.cn. Significantly enriched GO terms (unadjusted P < 0.05, two-sided) were identified from the analyses of significant genes for BMFF. Unadjusted P values were calculated by two-tailed Fisher’s exact test. e Tissue expression result for 54 specific tissue types was obtained from GTEx v8 using FUMA. FDR <0.05 was considered statistically significant. Only the result for L5 is shown here. BMFF bone marrow fat fraction, Th thoracic vertebra, L lumbar vertebra, PF proximal femur, LPF left proximal femur, RPF right proximal femur, 3’-UTR 3′-untranslated region, 5′-UTR 5′-untranslated region, H3K4me1 H3K4 monomethylation marks, H3K4me3 H3K4 trimethylation marks, H3K27ac H3K27 acetylation marks, H3K36me3 H3K36 trimethylation marks, H3K9me3 H3K9 trimethylation markers, OR odds ratio, CIs confidence intervals, AN anorexia nervosa, T2DM type 2 diabetes, MM multiple myeloma, MDS myelodysplastic syndrome, AA aplastic anemia.
Fig. 4
Fig. 4. SNP heritability and genetic correlations.
a Bar chart represents the SNP heritability of 15 BMFFs. The error bars represent the 95% confidence interval. The heritability was calculated using LDSC based on 1,097,459 independent SNPs from GWAS summary statistics, of the following sample sizes: Th8 (N = 39,007), Th9 (N = 38,937), Th10 (N = 39,144), Th11 (N = 39,178), Th12 (N = 39,172), Th (N = 38,715), L1 (N = 39,030), L2 (N = 39,151), L3 (N = 39,162), L4 (N = 39,121), L5 (N = 39,134), L (N = 38,897), LPF (N = 38,559), RPF (N = 38,560), and PF (N = 38,522). b The heatmap shows genetic correlations (bottom triangle) and phenotypic correlations (top triangle) between 15 BMFFs. Degree of correlation is indicated by the color legend, ranging from −1 to +1. Two-sided P values shown unadjusted are estimated using LDSC for genetic correlation. c Genetic correlations between 15 BMFFs and 13 clinical measures and ten clinical diseases. Degree of correlation is indicated by the color legend, ranging from −1 to +1. Two-sided P values shown are estimated using LDSC for genetic correlation. Only the correlation coefficient that survived Bonferroni correction is shown. P value <1.28 × 10−3 (0.05 divided by 13 clinical measures and three principal components) was considered statistically significant for analysis between BMFFs and measures. P value <1.67 × 10−3 (0.05 divided by ten clinical diseases and three principal components) was considered statistically significant for analysis between BMFFs and diseases. The exact P values were provided in Supplementary Data 25, 26. BMFF bone marrow fat fraction, Th thoracic vertebra, L lumbar vertebra, PF proximal femur, LPF left proximal femur, RPF right proximal femur, BMD bone mineral density, HDL−C high density lipoprotein cholesterol, LDL−C low density lipoprotein cholesterol, BMI body mass index, Hb hemoglobin concentration, WBC white blood cell count, PLT platelet count, RBC red blood cell count, RET reticulocyte count, AN anorexia nervosa, T2DM type 2 diabetes, MM multiple myeloma, MDS myelodysplastic syndrome, AA aplastic anemia.
Fig. 5
Fig. 5. Distribution of PRS and cumulative osteoporosis incidence stratified by PRS.
ac Density plots show the distribution of PRS for participants with low, intermediate, and high BMFF that was defined based on the tertiles of normalized BMFF. PRS of left proximal femur (a), right proximal femur (b) and proximal femur (c) BMFF yielded discrimination for BMFFs. df Cox hazard proportional regression was utilized to compare osteoporosis incidence rates between low, intermediate, and high PRS groups with adjustment for age, sex, and BMI. Disease outcomes were identified based on ICD9 and ICD10. Strata based on PRS of left proximal femur (d), right proximal femur (e), and proximal femur (f) BMFF. Those in the first tertiles of PRS are depicted in blue, the second tertiles are depicted in orange, and the last tertiles are depicted in red. The darker shades represent the central estimate of the cumulative incidence (defined as the Kaplan–Meier survival estimate). The lighter shades represent the respective 95% CIs. The x-axis depicts years since enrollment in the UKB; the y-axis depicts cumulative incidence. BMFF bone marrow fat fraction, PF proximal femur, LPF left proximal femur, RPF right proximal femur, PRS polygenic risk score, HR hazard ratio, CIs confidence intervals.
Fig. 6
Fig. 6. Causal effects between BMFF and osteoporosis using Mendelian randomization.
The forest plots show the causal effects of BMFFs on osteoporosis. Disease outcomes were identified based on ICD9 and ICD10. The measure of center refers to causal effect sizes of BMFFs on osteoporosis, which are presented as ORs per standard deviation increment, with shape indicating significance levels: triangle denotes Bonferroni correction for significance (two-sided P value <0.003 (0.05 divided by three principal components and five MR methods)) and round indicates non-significant correlations. The error bars represent 95% confidence intervals (95% CIs). MR analyses were performed using the R package TwoSampleMR with the inverse-variance weighted technique as our major model. The number of instrumental variables used was provided in Supplementary Data 30. The exact P values were provided in Supplementary Data 30. BMFF bone marrow fat fraction, Th thoracic vertebra, L lumbar vertebra, PF proximal femur, LPF left proximal femur, RPF right proximal femur, OR odds ratio, CIs confidence intervals.
Fig. 7
Fig. 7. Genetic architecture of bone marrow fat fraction and its involvement in disease risk.
Schematic workflow showing: (1) automated calculation of 15 BMFFs from MRI scans of 38,522 UK Biobank participants using our deep learning model; (2) genome-wide association studies identifying 373 significant BMFF-associated variants, and functional annotation revealed that BMFF is subject to extensive genetic regulation. (3) Genetic correlation analysis uncovered the relationships between BMFF and skeletal diseases. Notably, polygenic risk scores for proximal femur BMFFs have a certain risk stratification ability for osteoporosis. Finally, Mendelian randomization confirms causal relationships between proximal femur BMFF and osteoporosis risk. Created in BioRender. Wu, Z. (2025) https://BioRender.com/4c5yqdu.

References

    1. Wang, Y. et al. Bone marrow adipocyte: Origin, biology and relationship with hematological malignancy. Int. J. Lab Hematol.46, 10–19 (2024). - PubMed
    1. Wang, H., Leng, Y. & Gong, Y. Bone marrow fat and hematopoiesis. Front. Endocrinol.9, 694 (2018). - PMC - PubMed
    1. Manolagas, S. C. Birth and death of bone cells: basic regulatory mechanisms and implications for the pathogenesis and treatment of osteoporosis. Endocr. Rev.21, 115–137 (2000). - PubMed
    1. Sheu, Y. et al. Vertebral bone marrow fat, bone mineral density and diabetes: the osteoporotic fractures in men (MrOS) study. Bone97, 299–305 (2017). - PMC - PubMed
    1. Zhu, L. et al. Marrow adiposity as an indicator for insulin resistance in postmenopausal women with newly diagnosed type 2 diabetes - an investigation by chemical shift-encoded water-fat MRI. Eur. J. Radiol.113, 158–164 (2019). - PubMed

MeSH terms

LinkOut - more resources