. 2025 Aug;7(8):1646-1662.
doi: 10.1038/s42255-025-01339-1. Epub 2025 Aug 12.

D-cysteine impairs tumour growth by inhibiting cysteine desulfurase NFS1

Affiliations

D-cysteine impairs tumour growth by inhibiting cysteine desulfurase NFS1

Joséphine Zangari et al. Nat Metab. 2025 Aug.

Abstract

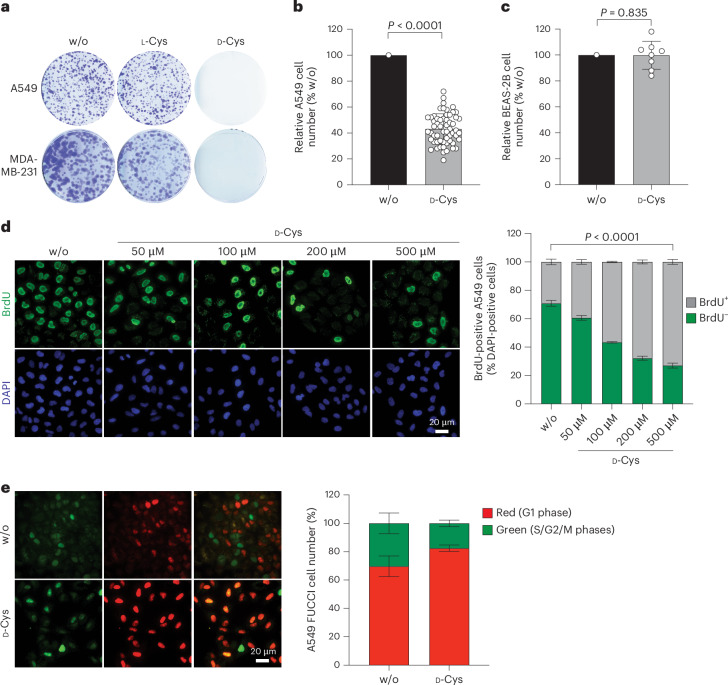
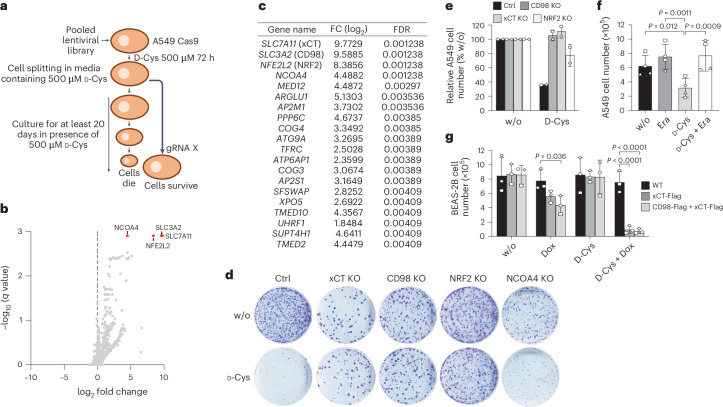
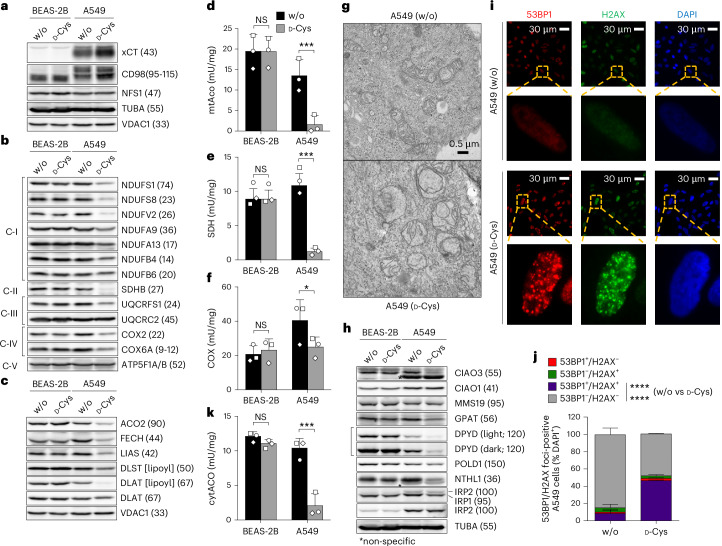
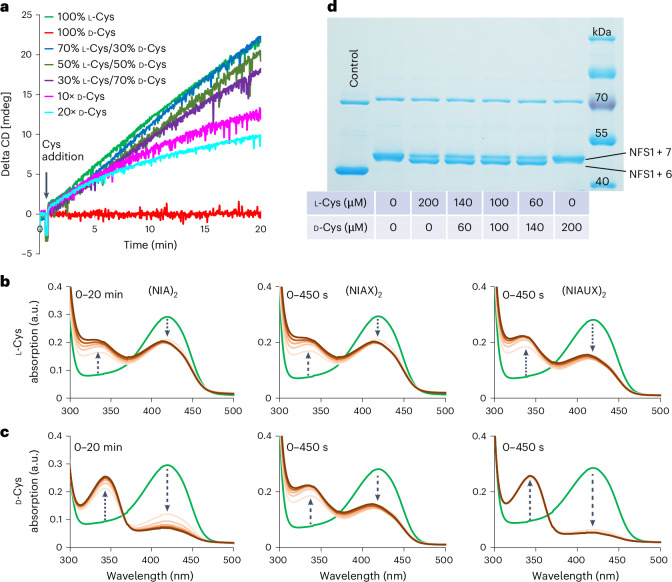
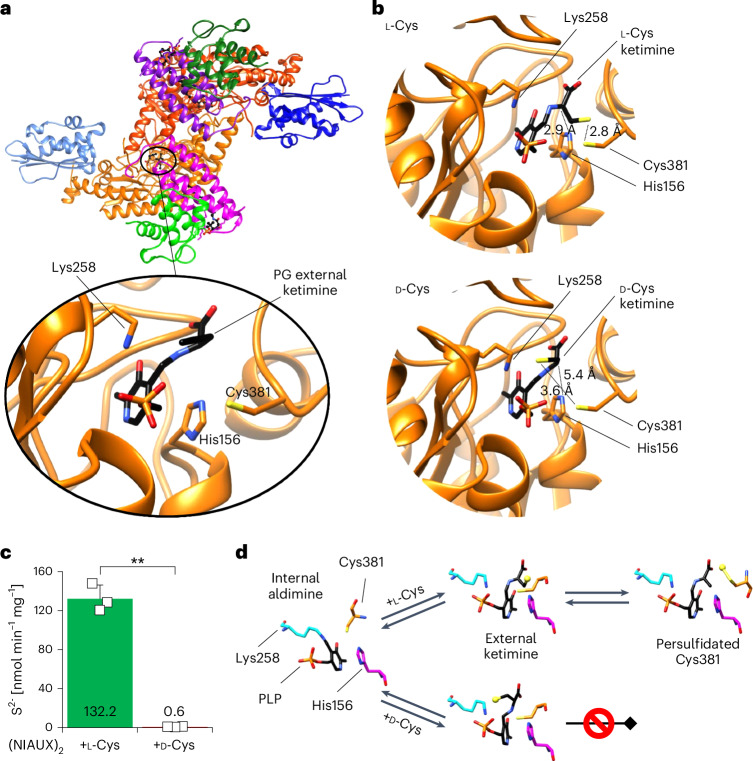
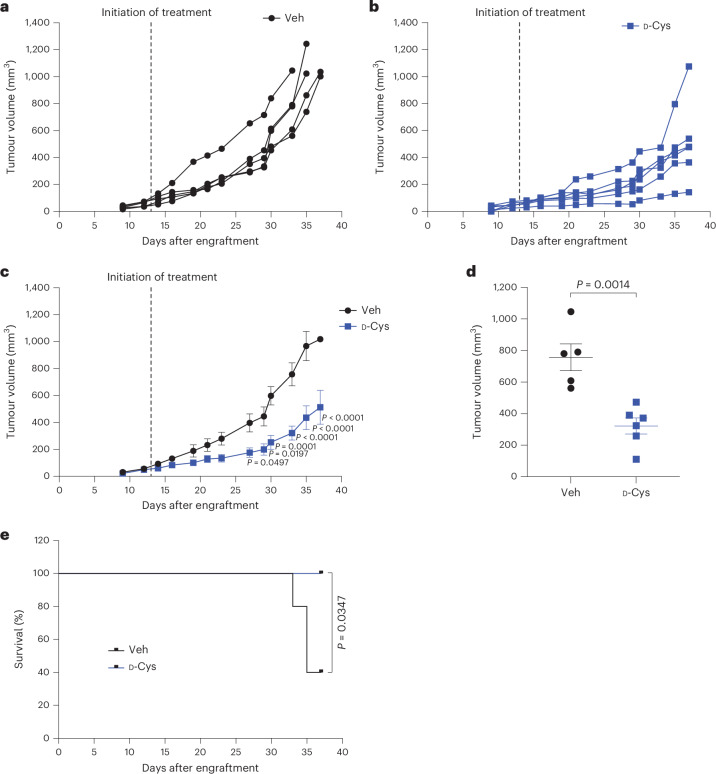
Selective targeting of cancer cells is a major challenge for cancer therapy. Many cancer cells overexpress the cystine/glutamate antiporter xCT/CD98, an L-cystine transport system that strengthens antioxidant defences, thereby promoting tumour survival and progression. Here, we show that the D-enantiomer of cysteine (D-Cys) is selectively imported into xCT/CD98-overexpressing cancer cell lines and impairs their proliferation, particularly under high oxygen concentrations. Intracellular D-Cys specifically inhibits the mitochondrial cysteine desulfurase NFS1, a key enzyme of cellular iron-sulfur protein biogenesis, by blocking sulfur mobilization due to steric constraints. NFS1 inhibition by D-Cys affects all cellular iron-sulfur cluster-dependent functions, including mitochondrial respiration, nucleotide metabolism and maintenance of genome integrity, leading to decreased oxygen consumption, DNA damage and cell cycle arrest. D-Cys administration diminishes tumour growth of human triple-negative breast cancer cells implanted orthotopically into the mouse mammary gland. Hence, D-Cys could represent a simple therapy to selectively target those forms of cancer characterized by overexpression of xCT/CD98.


Conflict of interest statement

Competing interests: J.Z. and J.-C.M. filed a patent on the effects of d-Cys in cancer. Patent applicant: Université de Genève. Names of inventors: J.-C.M. and J.Z. Application numbers: EP 21 769 366.2 and US 18/022,824. Status of applications: pending. The patent describes the effects of d-Cys on cell proliferation in vitro and the potential of d-Cys as a therapy for tumours expressing xCT. J.-C.M. serves as an unpaid member of the scientific advisory board of MPC Therapeutics (Geneva, Switzerland). The other authors declare no competing interests.

Figures

Fig. 1
Fig. 1. d-Cys impairs proliferation of certain tumour cells.
a, Colony formation assays of A549 or MDA-MB-231 cells cultured for 15 days in medium supplemented with 100 µM d-Cys, 100 µM l-Cys or water (w/o). b, Time course of A549 cell proliferation in the absence (w/o) or presence of 500 µM d-Cys for 3 days (n = 58 biological replicates), analysed by Wilcoxon matched-pairs signed-rank test. c, Relative cell yield of BEAS-2B cells after 3 days in culture in the absence (w/o) or presence of 500 µM d-Cys; n = 8, paired two-tailed Student’s t-test. d,e, Cell cycle analysis of A549 cells cultured in the presence of indicated concentrations of d-Cys, using BrdU immunofluorescence assay (d; w/o and 500 µM d-Cys, n = 3 biological replicates each; 50, 100 and 500 µM d-Cys, n = 2 biological replicates each; two-way analysis of variance (ANOVA) followed by Dunnett’s multiple-comparisons test) or the FUCCI assay (e; n = 2 biological replicates). All data are presented as the mean ± s.d. Representative images are shown. Source data
Fig. 2
Fig. 2. d-Cys is imported through xCT/CD98.
a, Outline of the pooled guide RNA (gRNA) depletion screen. b,c, Volcano plot representation of the screen hits after cell growth in the presence or absence of 500 mM d-Cys. q values were calculated using MAGeCK, which includes a correction for multiple comparisons. The most notable hits required for d-Cys toxicity are shown in c. See also Supplementary Table 1 for detailed results. FC, fold change; FDR, false discovery rate. d, Colony formation assays of control (Ctrl) A549 cells and indicated A549 KO cells in the absence (w/o) or presence of 100 μM d-Cys. e, Relative cell yield of control A549 cells and indicated A549 knockout (KO) 2D cell cultures grown for 72 h in the absence (w/o, set to 100%) or presence of 500 μM d-Cys, n = 2 biological replicates (consisting of three technical replicates each). f, Effects of erastin (Era) and d-Cys on A549 cell yield after 72 h of culture (n = 4 biological replicates), analysed by two-way ANOVA followed by Tukey’s multiple-comparisons test. g, BEAS-2B cells inducibly overexpressing xCT-Flag alone or together with CD98-Flag (Extended Data Fig. 3c) following doxycycline (Dox) addition were cultured in the absence (w/o) or presence of 500 μM d-Cys for 72 h and counted (n = 3 biological replicates), analysed by two-way ANOVA followed by Tukey’s multiple-comparisons test. Data in eg are presented as the mean ± s.d. Source data
Fig. 3
Fig. 3. d-Cys induces severe cellular Fe–S protein defects.
ak, BEAS-2B and A549 cells were cultured in the absence (w/o) or presence of 500 µM d-Cys for a total of 3 days and analysed. ac, Cell samples were immunoblotted against xCT and CD98 subunits, the indicated mitochondrial proteins or the lipoyl cofactor. TUBA, VDAC1 and ATP5F1A/ATP5F1B served as loading controls. df, Mitochondria-containing organellar fractions obtained by digitonin-based cell separation were analysed for the specific enzyme activities of mitochondrial aconitase (mtAco) (d), succinate dehydrogenase (SDH, respiratory complex II) (e) and cytochrome c oxidase (COX, respiratory complex IV) (f). Comparison by two-way repeated-measures ANOVA and Bonferroni post-test; symbols indicate matching samples of n = 3 biological replicates. g, Electron microscopy of mitochondria from A549 cells cultured for 3 days in the absence (w/o) or presence of 500 µM d-Cys. h, Cell samples were analysed by immunoblotting against the indicated cytosolic and nuclear proteins. Alpha-tubulin (TUBA) served as the loading control. i,j, Immunofluorescence analysis of 53BP1 and γ-H2AX to assess DNA damage in A549 cells cultured in the absence (w/o) or presence of d-Cys (i). The percentage of 53BP1-positive or γ-H2AX-positive cells was determined (j), n = 2 biological replicates. k, Cytosolic fractions obtained by digitonin-based cell separation were analysed for the specific enzyme activity of cytAco (IRP1); comparison by two-way repeated-measures ANOVA and Bonferroni post-test; symbols indicate matching samples of n = 3 biological replicates. Representative blots and images of n = 3 biological replicates are shown. Observed molecular masses in immunoblots are indicated in parentheses. C-I to C-V, OXPHOS complexes I–V. All data are presented as the mean ± s.d.; *P < 0.05; ***P < 0.001; ****P < 0.0001; NS, not significant. Source data
Fig. 4
Fig. 4. d-Cys does not support sulfur transfer within NFS1 during de novo [2Fe–2S] cluster biosynthesis.
a, Enzymatic [2Fe–2S] cluster reconstitution by the core ISC complex on the ISCU2 scaffold using l-Cys (positive control), d-Cys and mixtures of both enantiomers as indicated. Final Cys concentration was 1 mM for all mixtures, except for 10× and 20× d-Cys (0.5 mM). b,c, Cys-ketimine generation on (NIA)2, (NIAX)2 and (NIAUX)2 complexes measured by UV/Vis spectroscopy. The increase in the absorption at 340 nm indicates the generation of the l-Cys-ketimine (b) and d-Cys-ketimine (c) at the expense of the internal aldimine absorbing around 416 nm. Nearly identical rates of Cys-ketimine formation were observed for l-Cys and d-Cys (for time courses see Extended Data Fig. 7b,c). (NIA)2 spectra were recorded every 4 min, while (NIAX)2 and (NIAUX)2 spectra were recorded every 90 s. d, Persulfidation of Cys381NFS1 (NFS1 + 6) in the presence of l-Cys or d-Cys or mixtures thereof at the indicated concentrations (for explanation of the assay see Supplementary Fig. 7; representative image of two biological replicates is shown). d-Cys did not enable any NFS1 persulfidation (NFS1 + 7). The left lane shows non-labelled NFS1 as a control. The band at 70 kDa is the Escherichia coli DnaK chaperone, which does not contain a persulfide. a.u., arbitrary units.
Fig. 5
Fig. 5. Structural orientation of d-Cys-ketimine precludes sulfur transfer.
a, Crystal structure of (NIAU)2 after incubation with l-propargylglycine (PG; PDB 8TVT). The blow-up shows the NFS1 active centre harbouring an external PG-ketimine. This cofactor-substrate entity is no longer covalently bound to Lys258NFS1, and mimics the Cys-ketimine intermediate one step before actual persulfidation (Extended Data Fig. 7a). b, Models of bound l-Cys-ketimine (top) and d-Cys-ketimine (bottom) based on the crystal structure solved after addition of PG and validated using two bacterial SufS structures (PDB 7XEJ and PDB 7XEP). For l-Cys-ketimine both catalytic His156NFS1 and sulfur-accepting Cys381NFS1 are in close proximity to the l-Cys sulfur, while for d-Cys-ketimine these distances are much larger and the d-Cys sulfur is too far away for efficient persulfidation. For inspection of the model in 3D, a Chimera X file is available in Supplementary File 1. c, The (NIAUX)2 complex is not able to produce free sulfide from d-Cys using the DTT-dependent desulfurase activity assay. The rate of sulfide production was determined in n = 3 biological replicates, presented as the mean ± s.d., and compared by a paired two-tailed Student’s t-test, **P = 0.0039. d, A simplified mechanistic scheme for the reactions that l-Cys and d-Cys undergo with the NFS1-bound PLP (Extended Data Fig. 7a). When l-Cys or d-Cys are added to the enzyme, harbouring in its ground state the Lys258NFS1-bound PLP as an internal aldimine (Schiff base), an external (that is, non-enzyme-bound) Cys-ketimine is formed. Proton abstraction by His156NFS1 facilitates persulfidation of Cys381NFS1 for l-Cys but not d-Cys. Source data
Fig. 6
Fig. 6. D-Cys impairs mammary tumour growth in the mouse.
ac, MDA-MB-231 cells were implanted orthotopically into the mammary gland of immunodeficient mice. When tumours reached between 50 mm3 and 100 mm3, mice were randomized and either did not receive d-Cys (Veh, n = 5 animals; a) or were administered d-Cys (n = 6 animals; b) as explained in Methods, and the tumour growth was monitored three times per week. The experiment was stopped at day 37 after tumour engraftment, when tumours had reached 1,000 mm3 in a majority of mice. The average tumour growth (mean ± s.d.) in vehicle-treated or d-Cys-treated mice at each timepoint is summarized in c. Data were analysed by two-way ANOVA followed by Sidak’s multiple-comparisons test. d, Average tumour volume (mean ± s.d.) of the mice from (ac) at day 33 after tumour engraftment. Data were analysed by an unpaired two-tailed Student’s t-test. e, Survival curve of vehicle-treated or d-Cys-treated mice from ac until the end of the experiment (day 37). Data were analysed by log-rank (Mantel–Cox) test. Source data
Extended Data Fig. 1
Extended Data Fig. 1. D-Cys impairs proliferation of a number of different cancer cell types grown under 2D or 3D conditions.
a, Colony formation assay of A549 cells in the absence (w/o) or presence of either the L- or D-enantiomer of each proteinogenic amino acid. Each L- or D-amino acid was added to standard medium at similar concentrations as those already present in the medium. D-Cys was used at 100 µM. b, Colony formation assay for various cell types, including BZR, LuCa62, Calu1, JL1, ZL34, and A375 cells cultured in the absence (w/o) or presence of 100 µM D-Cys. c, d, Growth of A549 (c) and LuCa62 (d) spheroids in the absence (w/o) or presence of indicated D-Cys concentrations. All data are presented as mean ± SD of n = 3 biological replicates. Spheroid volumes at the indicated days of treatment were compared by 2-way ANOVA and Dunnett’s multiple comparisons test; e, Colony formation assays for HCT-116, DLD-1, HeLa and H2052/484 tumour cells in the absence (w/o) or presence of D-Cys. f, Determination of IC50 values using nonlinear fit, inhibitor conc vs response, for D-cystine or D-Cys for growth of A549 (left) or MDA-MB-231 cells (right). Source data
Extended Data Fig. 2
Extended Data Fig. 2. Genome-wide CRISPR/Cas9 knockout screening identifies genes increasing the D-Cys toxicity in A549 cells.
a, Volcano plot showing the most significant proteins whose depletion boosts D-Cys toxicity. Among the top hits are several glycolytic genes and the mitochondrial ISC protein glutaredoxin (GLRX5); SLC3A12 and SLC7A11 (red bars) are mentioned for comparison. Q values were calculated using MAGeCK, which includes a correction for multiple comparisons. See also Supplementary Table 2 for detailed results. b, c, Validation of CRISPR/Cas9 KO of SLC3A2 (CD98), SLC7A11 (xCT), or NFE2L2 (NRF2) genes in A549 cells by immunoblotting of corresponding proteins (molecular masses in parentheses). Representative blots of n = 3 (b) and n = 2 (c) biological replicates. d, A549 cells were cultured in full culture medium in the absence (–) or presence of the reductant TCEP (375 μM), in the absence (Ctrl) or presence of the xCT inhibitor erastin (1 μM). Samples either did not receive additional Cys supplementation (w/o), or were supplemented with 500 μM L-Cys or D-Cys for a total of three days as indicated. Cells were harvested and total protein yield was determined (mean ± SD). The efficiency of erastin treatment was analyzed by 2-way repeated measures ANOVA and Bonferroni posttest; symbols indicate matching samples of n = 3 biological replicates. e, Wild-type or knock-out (KO) A549 cells were cultured for three days in full culture medium in the presence of erastin (Era) and/or 500 μM D-Cys as indicated. Intracellular L-Cys and D-Cys levels were determined as a measure of cellular Cys import. Results are mean ± SD of n = 3 biological replicates for cells cultured in the presence (D-Cys) or absence (w/o) of D-cys; n = 2 biological replicates (consisting of 3 technical replicates each) for the other conditions. Unpaired two-tailed Student’s t-tests were used for comparison between cells cultured with and without (w/o) D-Cys. f, BEAS-2B cells were cultured for three days in full culture medium in the absence or presence of 500 μM D-Cys as indicated, and the cellular L- and D-Cys content was determined in n = 2 experimental series as a measure of Cys import. Source data
Extended Data Fig. 3
Extended Data Fig. 3. xCT (SLC7A11) and CD98 (SLC3A2) expression is associated with D-Cys sensitivity.
a, b, Immunoblotting of xCT and CD98 in various cell types that display sensitivity (a) or resistance (b) to D-Cys. c, Doxycycline-induced (co-)expression of C-terminally FLAG-tagged xCT and CD98 was analysed by anti-FLAG immunoblotting in BEAS-2B cells stably transduced by lentiviral infection. d, HeLa cells were transiently transfected to co-express C-terminally FLAG-tagged xCT and CD98, or the reference protein EGFP as indicated, cultured in absence (w/o) or presence of D-Cys for three days, and analysed by anti-FLAG immunoblotting. e, Protein yield of HeLa cell cultures from (d). Data are presented as mean ± SD; *P < 0.05; ns, not significant. Comparison by 2-way repeated measures ANOVA and Bonferroni posttest; symbols indicate matching samples of n = 4 biological replicates (one series lacks xCT/CD98 values). Representative blots of n = 4 (a, b), n = 1 for (c) and n = 4 (d) biological replicates are shown. γ-actin and β-tubulin (TUBA) were used as loading controls (molecular masses in parentheses). Source data
Extended Data Fig. 4
Extended Data Fig. 4. Proteomic analysis of A549 cells cultured in the presence or absence of D-Cys or L-Cys.
A549 cells were cultured for three days in DMEM containing 200 μM L-cystine (w/o) or in the same medium supplemented with either 500 μM D-Cys or L-Cys, and a proteomic analysis was performed. a, Volcano plot showing proteins that vary among the different conditions. Different comparisons have been made according to the protein colour code shown in the box. b, List of the most downregulated mitochondrial proteins in D-Cys treated cells (orange dots from (a)). See also Suppl. Table S2 for a more detailed list of proteins analysed and their comparison among the different culture conditions. c, Immunoblot analyses of representative OXPHOS protein subunit levels in indicated cell lines cultured in the absence (w/o) or presence of D-Cys. VDAC1 served as loading control. Representative blots of n = 4 (for A549 cells) and n = 2 (for MDA-MA-231 and BEAS-2B cell) biological replicates are shown. Source data
Extended Data Fig. 5
Extended Data Fig. 5. D-Cys decreases oxygen consumption rates and triggers ROS and lipid peroxidation in A549 cells.
a, b, Basal and maximal oxygen consumption rates (OCR) of BEAS-2B (a) or A549 cells (b) cultured in the absence (w/o) or presence of 500 μM D-Cys for three days. Data of n = 3 (a) and n = 4 (b) biological replicates are presented as mean ± SD and were analysed by 2-way ANOVA followed by Sidak’s multiple comparisons test. c, d, Quantitation of FACS-analyses of ROS production in A549 cells cultured in the absence (w/o) or presence of 500 μM D-Cys for three days, using either MitoSOX (determination of mitochondrial ROS in n = 3 biological replicates) (c) or BD C11 (determination of lipid peroxidation in n = 6 biological replicates) (d). Mean fluorescence intensity (MFI) ± SD is shown; data were analysed by unpaired two-tailed Student’s t-test. e, A549 cells have been cultured under normoxia (21% oxygen, O2) or hypoxia (1% oxygen, O2) for 72 h, either in the absence (w/o) or presence of 500 mM D-Cys. Cells were then counted (left panel) or stained with crystal violet (right panel). Cell counts of n = 3 biological replicates are presented as mean ± SD and were analysed by unpaired two-tailed Student’s t-test. f, Lack of effect of ferrostatin-1 (Fer-1) on D-Cys-induced toxicity. A549 cells were cultured for 72 h with or without D-Cys and with the indicated concentrations of Fer-1 added freshly from day 1 to day 3. Following the 72 h culture period cells of n = 3 biological replicates were counted, and the results are presented as mean ± SD. The comparison was performed by an unpaired two-tailed Student’s t-test. Source data
Extended Data Fig. 6
Extended Data Fig. 6. D-Cys induces Fe-S protein defects in xCT/CD98-overproducing HeLa cells.
HeLa cells were transiently transfected to co-express C-terminally FLAG-tagged CD98 and xCT, or the reference protein EGFP as indicated. Cells were cultured in the absence (w/o) or presence of 500 μM D-Cys for three days (cf. Extended Data Fig. 3d, e). a, b, Cell extracts were analysed by immunoblotting of the indicated mitochondrial proteins or the lipoyl cofactor. ATP5F1A/B and VDAC1 served as loading controls. cf, Mitochondria-containing organellar fractions, obtained by digitonin-based cell separation, were analysed for the specific enzyme activities of mitochondrial aconitase (mtAco), succinate dehydrogenase (SDH, respiratory complex II), citrate synthase (CS), and cytochrome c oxidase (COX, respiratory complex IV). g, Cell samples were analysed by immunoblotting of the indicated cytosolic nuclear proteins. α-tubulin (TUBA) served as loading control. h-i, Cytosolic fractions obtained by digitonin-based cell separation were analysed for the specific enzyme activities of cαytosolic aconitase (cytAco) and lactate dehydrogenase (LDH). Representative blots of n = 4 biological replicates are shown. Numbers in parentheses indicate observed molecular masses. C-I to C-V, OXPHOS complexes I to V. Data are presented as mean ± SD; *P < 0.05; **P < 0.01; ***P < 0.001; ns, not significant. Symbols indicate matching samples of n = 4 biological replicates. Source data
Extended Data Fig. 7
Extended Data Fig. 7. NFS1 can generate a D-Cys-ketimine intermediate but is unable to mobilise sulfur.
a, Cartoon of the reaction cycle of the cysteine desulfurase NFS1 with L-Cys. The resting state of the enzyme comprises an internal (that is enzyme-bound) aldimine, by which the pyridoxal phosphate (PLP) cofactor is covalently bound to Lys258 as a Schiff base (1). Cys381 and His156 are positioned close to the PLP. Binding of free L-Cys creates an external (that is non-enzyme-bound) L-Cys-aldimine (2) which tautomerizes (catalysed by His156) to an external L-Cys-ketimine (3). The sulfur atom (yellow ball) can be released from L-Cys ketimine and transferred to Cys381, thereby creating an external L-Ala-ketimine and a persulfide (-SSH) on Cys381 (4). The resting state 1 of the enzyme with its internal aldimine is regenerated by rapid release of free L-Ala. Residue numbering is for human NFS1. The reaction scheme was adopted from refs. ,. b, c, Time courses of the generation of the L- and D-Cys-ketimine intermediate (absorption at 340 nm, blue) from the internal aldimine (416 nm, red) by the indicated (NIA)2 complexes. Data were taken from the spectra shown in Fig. 4b, c. d, Cartoon of the NFS1 reaction with D-Cys. The enzyme can efficiently and rapidly form the D-Cys-aldimine (2) and -ketimine intermediates (3), but for steric reasons cannot transfer the sulfur to Cys381, unlike with L-Cys (a). For 3D inspection of the models in parts a,d, a Chimera X session has been added as Supplementary File 1 (L_D-Cys_Cycle_final.X.py), using the following 3D structures: PDB ID: 7E6D, 6O13, 6O11, 7XEJ. refs. ,.
Extended Data Fig. 8
Extended Data Fig. 8. Electron density maps around pyridoxal-phosphate (PLP) in the L-propargylglycine (PG)-containing (NIAU)2 crystal structure.
The 2Fo-DFc (blue; contoured at 0.5 sigma) and Fo-DFc (orange; 2.5 sigma) difference maps were calculated after 5 refinement macrocycles in Phenix of the model from which the PG-PLP, the sidechain of Lys258, and residues 377-387 were excluded (PDB ID: 8TVT). While the density for the loop is weak, it was possible to build backbones of residues Gly378-Cys381 and Ala384-Glu387. Most of the sidechains in this region were not visible and were not modeled. The Fo-DFc map clearly shows that Lys258 is not covalently bound to PLP, thus defining PG-PLP as an external aldimine. There appears to be density at low level to allow placing the sidechain of Cys381 in one possible conformation, where it points toward the PG sidechain.
Extended Data Fig. 9
Extended Data Fig. 9. D-Cys induces Fe-S protein defects particularly at low cell densities.
a, A549 cells were seeded at low density (LD, 5×10³ cells/cm2) or high density (HD, 60×103 cells/cm2), cultured in the absence (w/o) or presence of 500 μM D-Cys for LD cultures and 1 mM for HD cultures. After three days cells were harvested and counted; experiments were done in technical triplicates and performed twice; 2-way ANOVA followed by Sidak’s multiple comparisons test; **** P < 0.0001. b, c, Indicated numbers of A549 cells were seeded into 25 cm2 flasks, cultured in the absence (w/o) or presence of 500 μM D-Cys for a total of three days and harvested. Protein yield of each culture at harvest (b), and relative protein yield of D-Cys-treated cultures in comparison to untreated cultures (c) are presented. d, A549 cells were cultured at LD or HD conditions as indicated in (a). After 15 h, the cellular D-Cys content was measured by the D-Cys luciferase assay, and expressed relative to the HD value. e, Protein levels of xCT and CD98 in cells from (b) were determined by immunoblotting. α-tubulin (TUBA) served as loading control. f, Immunofluorescence confocal analysis of xCT and phalloidin in A549 cells cultured at LD (top) to HD (bottom) conditions (left panels). Note the colocalization of xCT and phalloidin at HD. Z sections taken at the horizontal middle position of the respective XY view (left) are shown in right panels. Images are representative of n = 2 biological replicates. g, h, Cell samples from (b) were analysed by immunoblotting against the indicated mitochondrial proteins or lipoyl cofactor. VDAC1 served as loading control. C-I to C-V, OXPHOS complexes I to V. i, j, Total cell lysates of cells from (c) were analysed for the specific enzyme activities of total cellular aconitase (ACO) and succinate dehydrogenase (SDH, respiratory complex II). k, Cell samples were analysed by immunoblotting against the indicated cytosolic-nuclear CIA and Fe-S proteins. TUBA served as loading control. l, Crude membrane preparations of cells from (b) were analysed for the specific enzyme activity of cytochrome c oxidase (COX, respiratory complex IV). Representative blots and images are shown (eh, k). Numbers in parentheses indicate observed molecular masses. Data obtained from n = 3 biological replicates are presented as mean ± SD, with individual symbols indicating matching samples (bd, i, j, l); Comparisons were performed by 2-way repeated measures ANOVA and Bonferroni posttests (b, c, i, j, l); * P < 0.05; ** P < 0.01; *** P < 0.001; **** P < 0.0001; ns, not significant. Source data
Extended Data Fig. 10
Extended Data Fig. 10. D-Cys clearance by D-amino acid oxidase and its lack of adverse effects.
a, Immunodeficient mice were administered 200 μL of D-Cys (15 mg/mL in PBS) intraperitoneally, vehicle only (Veh), or the D-amino acid oxidase (DAAO) inhibitor 6-hydroxy-2-(naphthalen-1-ylmethyl)-1,2,4-triazine -3,5(2H,4H)-dione (ref. ) (DAAO inh, 30 mg/kg, orally). A fourth group received both D-Cys and the DAAO inhibitor. Blood samples were collected from the tail at 1 and 2 h post-administration for the analysis of L-cystine and D-cystine levels via chiral chromatography (n = 2 each). be, Immunodeficient mice were fed a chow diet supplemented with either L-cystine or D-cystine for 28 days. Additionally, daily intraperitoneal (IP) and subcutaneous (SC) injections of D-cystine or vehicle were administered as detailed in Methods. Body weight was monitored throughout the experimental protocol (b). Twenty-eight days after starting the diet, mice were euthanized, and samples were collected for the measurement of creatinine (c), alanine aminotransferase (ALAT; d), and aspartate aminotransferase (ASAT; e). Data obtained from individual animals are presented as mean ± SD for control and D-Cys-treated groups (n = 10 each). Statistical analyses were performed using unpaired, two-tailed Student’s t-tests. ref. . Source data

References

    1. Lam, H. et al. D-amino acids govern stationary phase cell wall remodeling in bacteria. Science325, 1552–1555 (2009). - PMC - PubMed
    1. Ohide, H., Miyoshi, Y., Maruyama, R., Hamase, K. & Konno, R. D-amino acid metabolism in mammals: biosynthesis, degradation and analytical aspects of the metabolic study. J. Chromatogr. B Anal. Technol. Biomed. Life Sci.879, 3162–3168 (2011). - PubMed
    1. Snyder, S. H. A life of neurotransmitters. Annu. Rev. Pharmacol. Toxicol.57, 1–11 (2017). - PubMed
    1. Papenbrock, J., Riemenschneider, A., Kamp, A., Schulz-Vogt, H. N. & Schmidt, A. Characterization of cysteine-degrading and H2S-releasing enzymes of higher plants - from the field to the test tube and back. Plant Biol.9, 582–588 (2007). - PubMed
    1. Roychaudhuri, R. et al. Mammalian d-Cysteine controls insulin secretion in the pancreas. Mol. Metab.90, 102043 (2024). - PMC - PubMed

LinkOut - more resources