. 2025 Aug 12;8(1):1197.
doi: 10.1038/s42003-025-08658-9.

Population genomics reveal multiple independent origins of pesticide resistance in the polyphagous pest, Tetranychus urticae

Affiliations

Population genomics reveal multiple independent origins of pesticide resistance in the polyphagous pest, Tetranychus urticae

Lei Chen et al. Commun Biol. .

Abstract

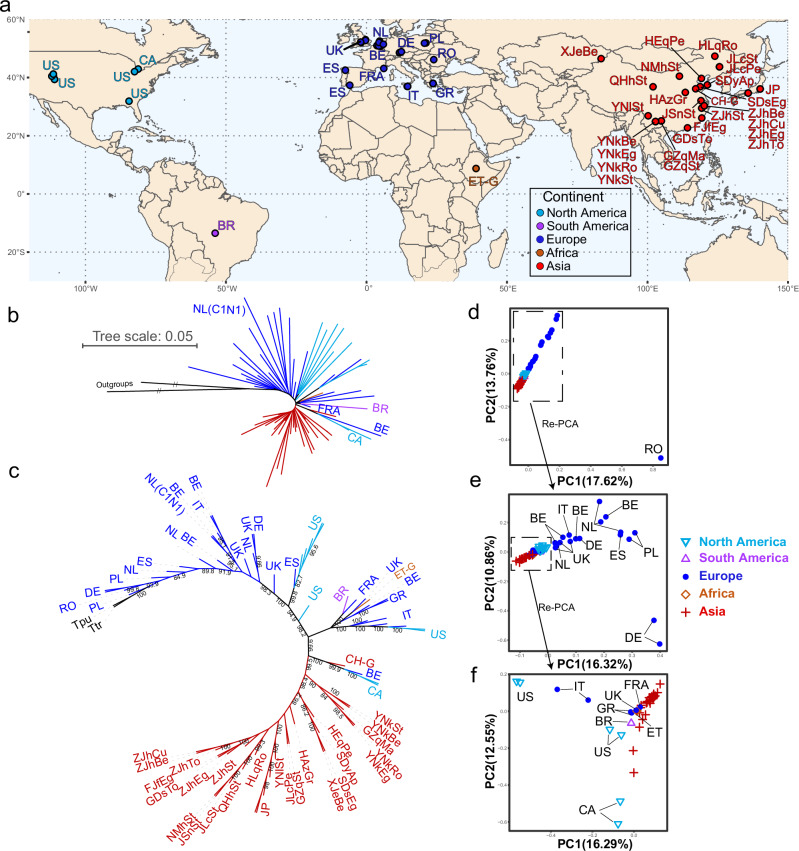
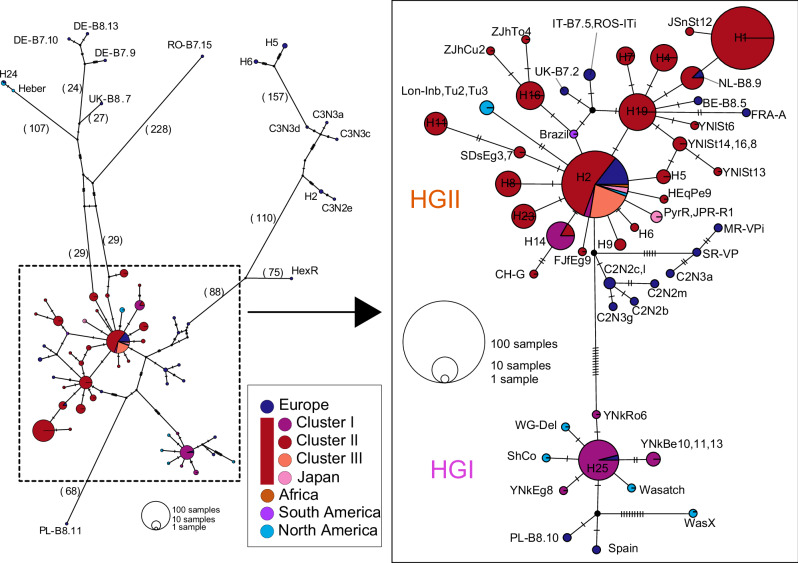
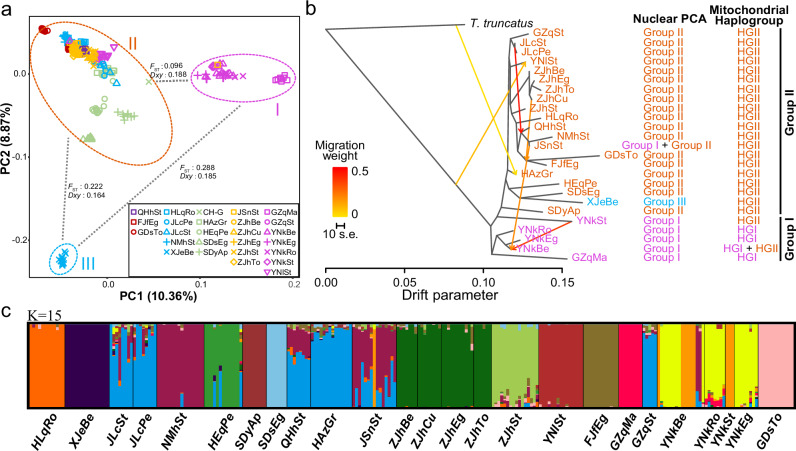
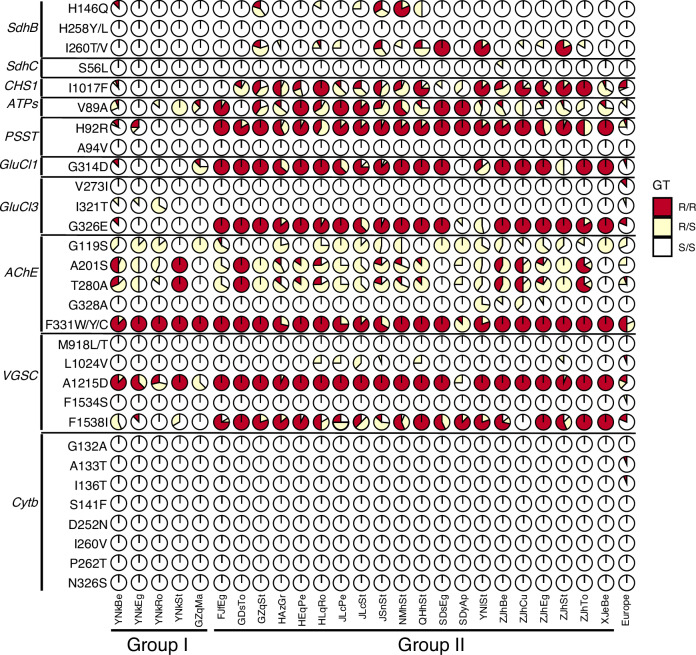
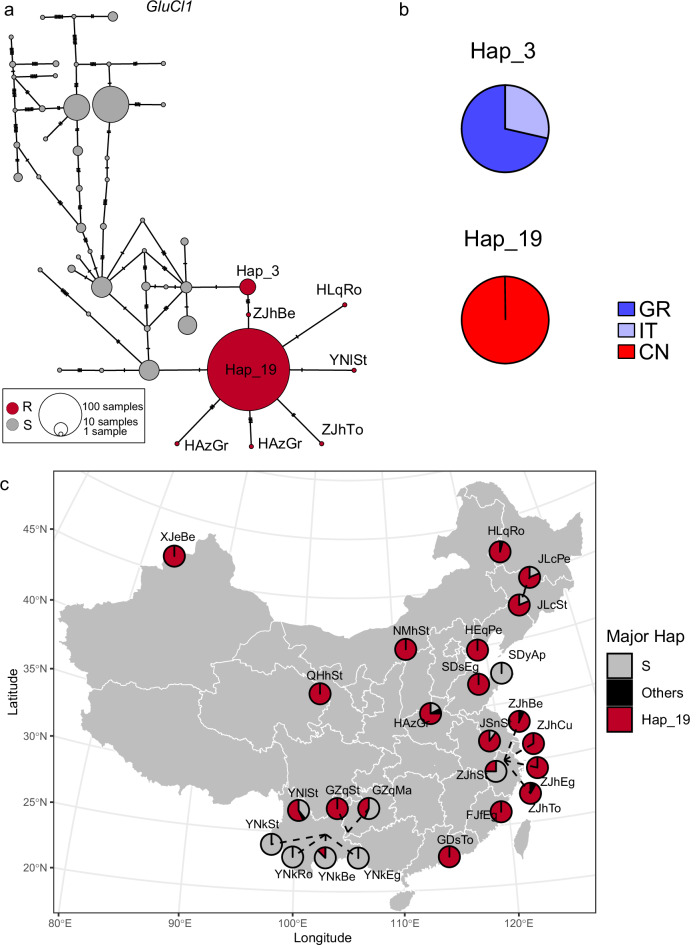
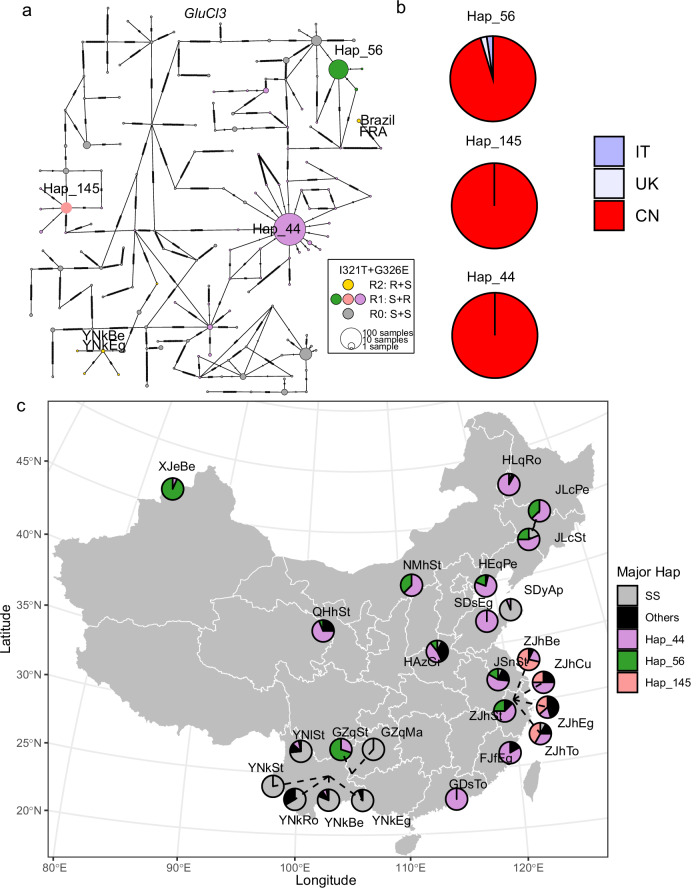
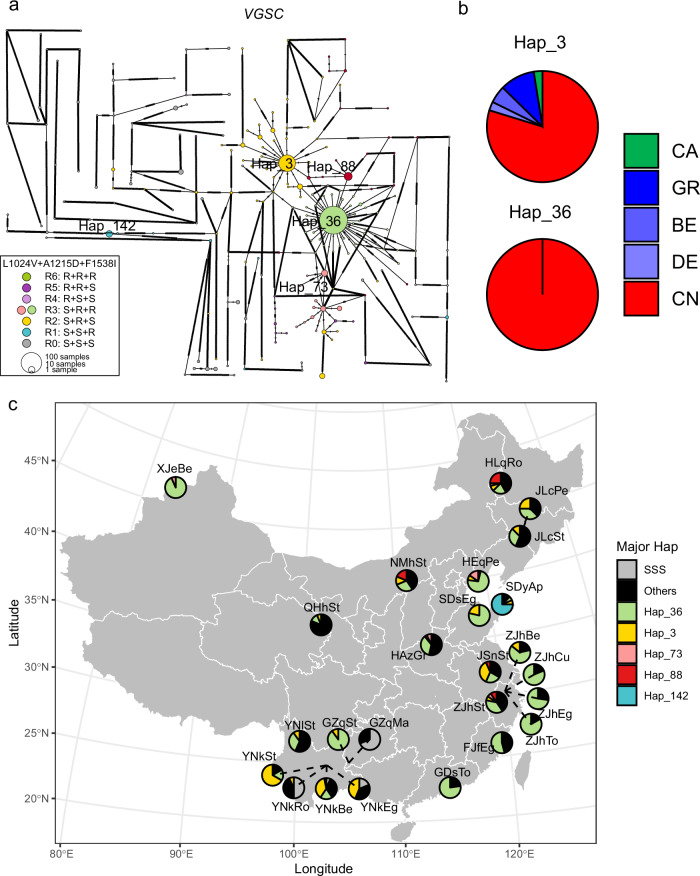
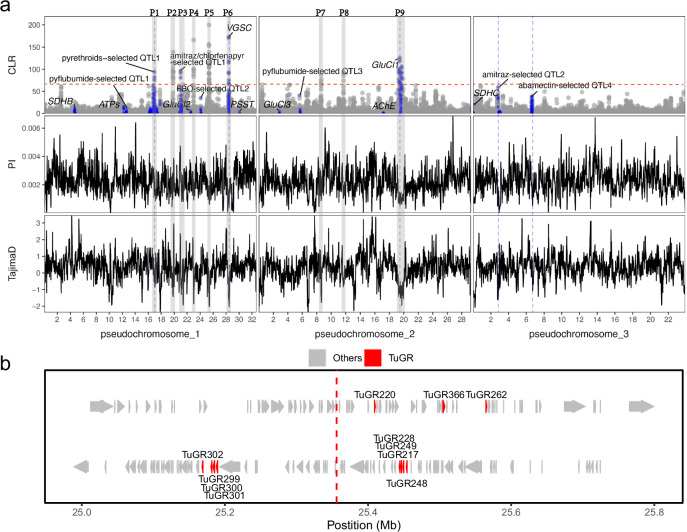
The rapid evolution of pesticide resistance imposes great pressure on food production. However, how resistance alleles arise and spread across field populations remains largely understood. Here, we study the evolutionary trajectories of resistance alleles in Tetranychus urticae, a rapidly evolving pest. We sequence the genomes of 258 T. urticae females collected from China. Combined with global reference genomic data, we examine the evolutionary origin(s) of 18 mutations across 10 target-site genes and analyze the global population genetic structure using genome-wide SNPs. Our findings reveal a striking prevalence of multiple independent origins of resistance mutations, with only two of 18 mutations showing an apparent single origin. Population structure and haplotype analyses point to an important role of gene flow in the spread of resistance alleles. Selection analyses reveal pesticide-driven sweeps affecting genetic diversity. These findings advance our understanding of the rapid adaptation of arthropod herbivores to extreme selective pressure.


Conflict of interest statement

Competing interests: The authors declare no competing interests.

Figures

Fig. 1
Fig. 1. Sample locations and population structure of global T. urticae populations.
a Geographic sampling locations of T. urticae used in this study. b Rooted neighbor-joining (NJ) phylogenetic tree of 70 representative T. urticae samples based on genome-wide SNP data. Two closely related species T. truncatus and T. pueraricola were used as outgroups. c Rooted NJ consensus tree constructed using 1000 bootstrap replicates. Node labels represent bootstrap values, which indicate the confidence levels of the corresponding branches. T. truncatus and T. pueraricola were included as outgroups. d Principal component analysis (PCA) of representative T. urticae individuals (Supplementary Data 5). e, f PCA analyses of the selected individuals. The NJ tree and PCA analyses were conducted using 304,709 nuclear biallelic SNPs with a sequencing depth of more than 10 X that were present in all samples.
Fig. 2
Fig. 2. A global mitochondrial haplotype network for all T. urticae samples (n = 322).
Haplotype network was constructed using 1827 mitochondrial SNPs. The pie size is proportional to the number of individuals sharing each haplotype, and the colors represent their geographic distribution. The values in parentheses and dashes between haplotypes indicate the number of mutational steps. The haplotypes of Asian individuals, along with adjacent haplotypes, were enlarged and categorized into two groups, HGI and HGII. The two haplogroups differ by 11 SNPs, including two non-synonymous substitutions, which are located in COXIII and ND4.
Fig. 3
Fig. 3. Population structure of the Chinese populations of T. urticae.
a PCA plot of all Chinese individuals (258 individuals from 25 populations in Supplementary Data 1) based on nuclear SNPs. b Relationships and gene flow events among Chinese populations inferred by the maximum-likelihood method implemented in TreeMix. The ‘Nuclear PCA’ column indicates the group, as defined in the PCA plot (Fig. 3a), to which each population was assigned. The ‘Mitochondrial haplogroup’ column indicates the mitochondrial haplogroup, as defined in the mitochondrial haplotype network (Fig. 2), found in each population. c Admixture analysis of genetic structure and individual ancestry. The optimal number of ancestral clusters chosen based on cross-validation error was 15. Each individual is represented by a vertical bar displaying membership coefficients to each of the 15 genetic clusters in (c). The above three analyses were all based on 19,480 SNPs that were unlinked (r2 < 0.2) and present in all Chinese individuals.
Fig. 4
Fig. 4. Occurrence of mutations associated with pesticide resistance in ten target genes in Chinese and European populations of T. urticae.
‘GT’ represents genotype, ‘R/R’ represents resistance mutation homozygote, ‘R/S’ represents resistance mutation heterozygote, S/S, susceptible homozygote. SdhB dehydrogenase B, SdhC dehydrogenase C, CHS1 chitin synthase 1, ATPs ATP synthase subunit C, PSST PSST homologue of complex I, GluCl1 glutamate-gated chloride channel subunit 1, GluCl3, glutamate-gated chloride channel subunit 3, AChE acetylcholinesterase; VGSC voltage-gated sodium channel, Cytb, mitochondrial cytochrome b. The amino acid substitutions in AChE, VGSC and PSST follow the numbering conventions of commonly used reference species, while substitutions in the other genes follow the T. urticae numbering. For the Chinese samples, 258 individuals from 25 field populations were surveyed. The two genetic groups (Group I and II) are defined according to the population genetic structure results based on nuclear and mitochondrial variation (Fig. 3). European samples included 19 T. urticae lines from 9 countries.
Fig. 5
Fig. 5. Network of the GluCl1 haplotypes and geographic distribution of major haplotypes carrying target-site resistance mutations.
a Haplotype network for global samples (n = 322, 40 populations). Each pie represents a unique haplotype, with its size being proportional to the number of individuals sharing that haplotype. Dashes in the connections between haplotypes represent mutational steps. Red pies represent resistant haplotypes, which carry the G314D resistance mutation. Grey pies represent susceptible haplotypes, which do not carry the G314D resistance mutation. b Occurrence of major resistant haplotypes in different countries (Supplementary Data 8). Hap_3 and Hap_19 are the two major resistant haplotypes. The colors of pie chart represent the proportion of haplotypes from different countries. GR Greece, IT Italy, CN China. c Geographic distribution of major resistant haplotypes in Chinese populations (n = 258, 25 populations as listed in Supplementary Data 1). “S” represents haplotypes carrying the susceptible allele. “Others” refers to other resistant haplotypes occurring at low frequencies. “Hap_19” denotes the predominant haplotype carrying the G314D resistance mutation.
Fig. 6
Fig. 6. Network of the GluCl3 haplotypes and geographic distribution of major haplotypes carrying target-site resistance mutations.
a Haplotype network for global samples (n = 322, 40 populations). Each pie represents a unique haplotype, with its size being proportional to the number of individuals sharing that haplotype. Dashes in the connections between haplotypes represent mutational steps. The colors of the pie charts represent different genetic profiles, categorized based on the alleles at the two target sites, I321T and G326E, in GluCl3. The two letters in “RS”, “SR”, and “SS” correspond to I321T and G326E, with “R” and “S” representing resistance and susceptible alleles respectively. b Occurrence of three predominant resistant haplotypes across different countries (Supplementary Data 8). Hap_44, Hap_46 and Hap_145 are three predominant haplotypes carrying the G326E resistance mutation. The colors of pie chart represent occurrence in different countries. IT Italy, UK United Kingdom, CN China. c Geographic distribution of predominant resistant haplotypes in Chinese populations (n = 258, 25 populations as listed in Supplementary Data 1). “SS” represents haplotypes carrying susceptible alleles at both target sites, and “Others” represents other resistant haplotypes occurring at low frequencies.
Fig. 7
Fig. 7. Network of the VGSC haplotypes and geographic distribution of major haplotypes carrying target-site resistance mutations.
a Haplotype network for global samples (n = 322, 40 populations). Each pie chart represents a unique haplotype, with its size being proportional to the number of individuals sharing that haplotype. Dashes in the connections between haplotypes represent mutational steps. The colors of the pie charts represent different genetic profiles, categorized based on the alleles at the three target sites, L1024V, A1215D, and F1538I. The three letters in “RRR”, “RRS”, and “RSS” etc. correspond to L1024V, A1215D, and F1538I, with “R” and “S” representing resistance and susceptible alleles, respectively. b Occurrence of two major resistant haplotypes across different countries (Supplementary Data 8). Hap_3 and Hap_36 are two major haplotypes carrying target-site resistance mutations. CA Canada, GR Greece, BE Belgium, DE Germany, CN China. c Geographic distribution of predominant resistant haplotypes in Chinese populations (n = 258, 25 populations as listed in Supplementary Data 1). “SSS” represents haplotypes carrying susceptible alleles at the three target sites, and “Others” represents other resistant haplotypes occurring at low frequencies.
Fig. 8
Fig. 8. Genomic selective sweep scan for Chinese populations of T. urticae.
a panels display CLR values, nucleotide diversity (PI), and Tajima’s D values across the 3 chromosomes of T. urticae individuals from China (n = 258, 25 populations listed in Supplementary Data 1). Blue points in the CLR panel denote regions that overlap with known pesticide resistance-related genes or QTLs. Tajima’s D, and nucleotide diversity (PI) were estimated across the entire genome using a sliding window approach, with a window size of 50 kb and a step size of 5 kb. Blue dashed lines mark the peaks of CLR signals, where adjacent regions show significantly reduced nucleotide diversity and Tajima’s D values. The dashed red line shows the threshold of significant CLR values (1‰ CLR values). b Genes within the most prominent peak (P5). Vertical dotted lines represent the midpoint of the top genomic window. TuGR: gustatory chemosensory receptor.

Similar articles

References

    1. Kreiner, J. M. et al. Multiple modes of convergent adaptation in the spread of glyphosate-resistant Amaranthus tuberculatus. Proc. Natl Acad. Sci. USA116, 21076–21084 (2019). - PMC - PubMed
    1. Baucom, R. S., Iriart, V., Kreiner, J. M. & Yakimowski, S. Resistance evolution, from genetic mechanism to ecological context. Mol. Ecol.30, 5299–5302 (2021). - PubMed
    1. Thia, J. A. et al. The redlegged earth mite draft genome provides new insights into pesticide resistance evolution and demography in its invasive Australian range. J. Evol. Biol.36, 381–398 (2022). - PMC - PubMed
    1. De Rouck, S., Inak, E., Dermauw, W. & Van Leeuwen, T. A review of the molecular mechanisms of acaricide resistance in mites and ticks. Insect Biochem. Mol. Biol.159, 103981 (2023). - PubMed
    1. Riveron, J. M. et al. A single mutation in the GSTe2 gene allows tracking of metabolically based insecticide resistance in a major malaria vector. Genome Biol.15, R27 (2014). - PMC - PubMed

LinkOut - more resources