. 2025 Aug 12;25(1):621.
doi: 10.1186/s12887-025-05922-z.

Gut microbiota and urine metabolomics signature in autism spectrum disorder children from Southern China

Affiliations

Gut microbiota and urine metabolomics signature in autism spectrum disorder children from Southern China

Ziyu Huang et al. BMC Pediatr. .

Abstract

Background and aim: Autism spectrum disorder (ASD) is a neurodevelopmental disorder that may have long-term effects on individual development, family functioning, and social integration. This study aimed to determine the gut microbiota and urine metabolomics signature and identify the regional characteristics in ASD from Southern China.

Methods: We conducted a cohort study of 88 well-characterized participants from Guangxi Zhuang Autonomous Region in Southern China. Gut microbiota and urine metabolomics signature was explored by 16 S rRNA sequences and untargeted metabolomic profiles respectively.

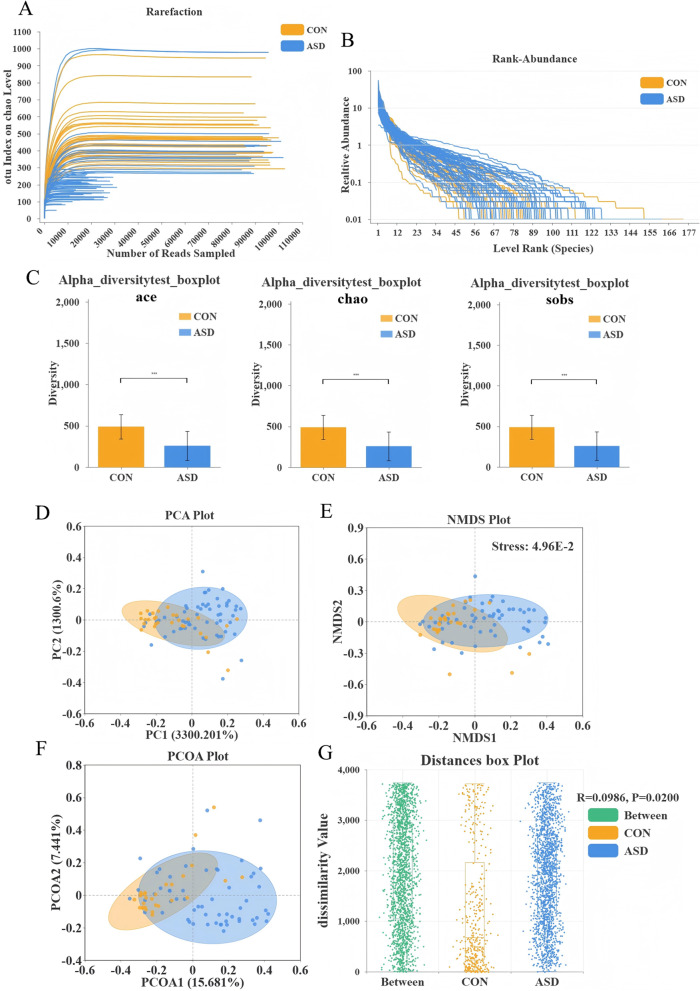
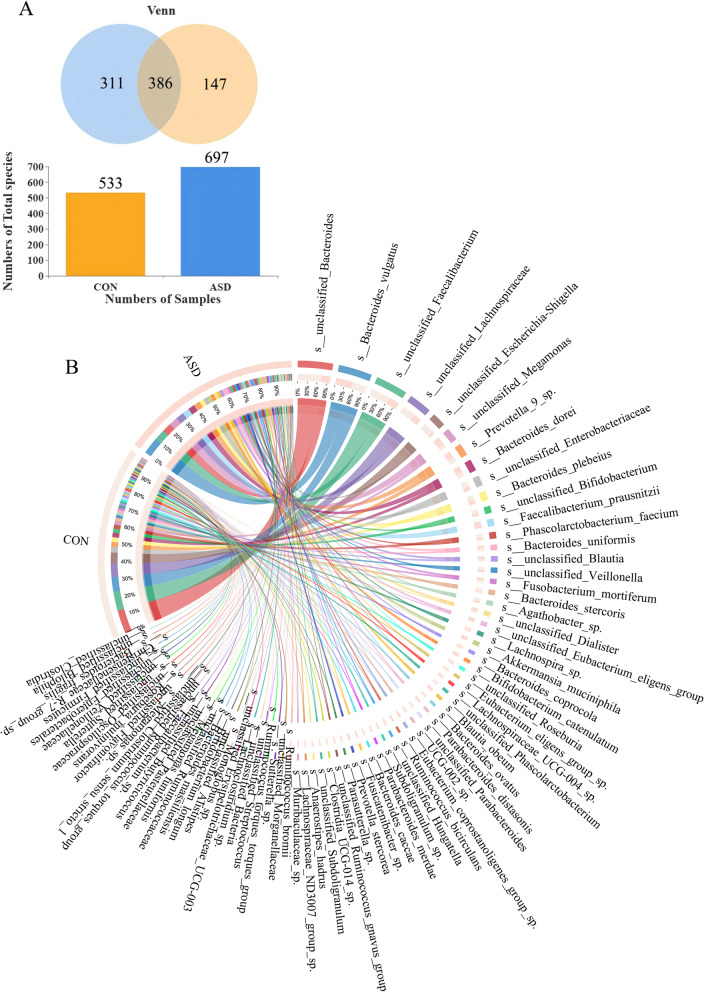
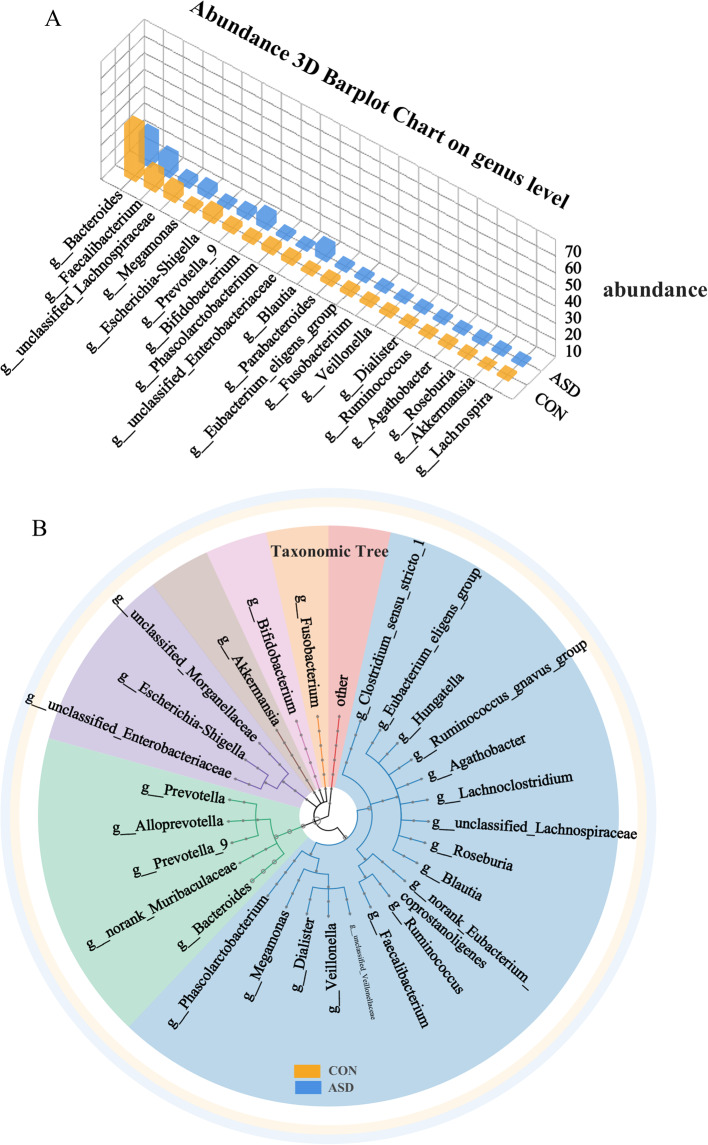
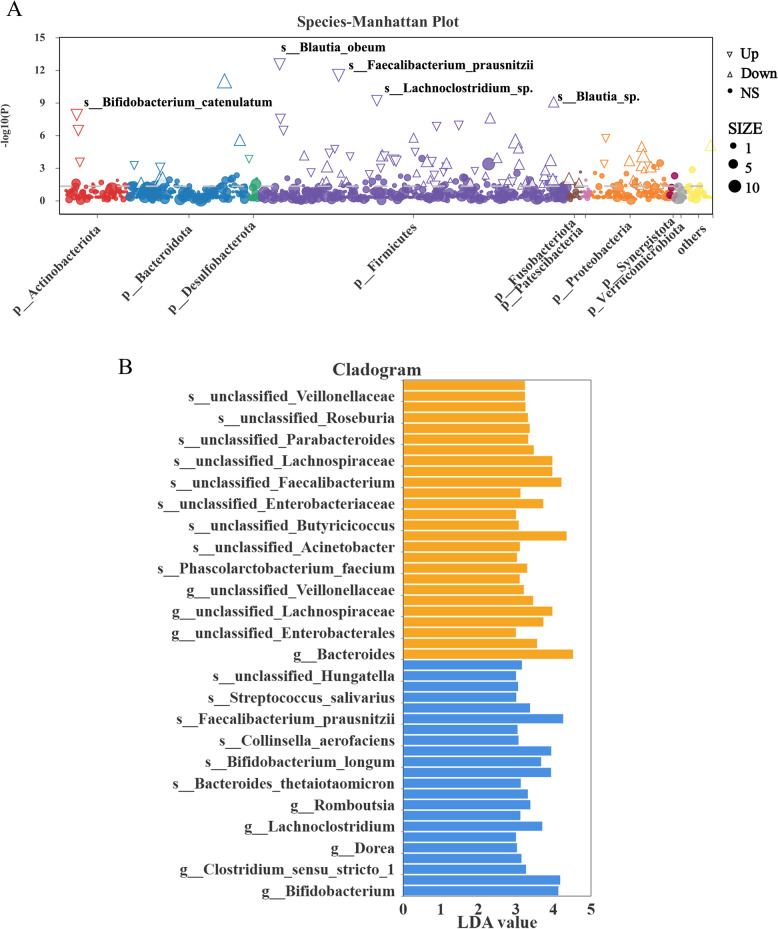
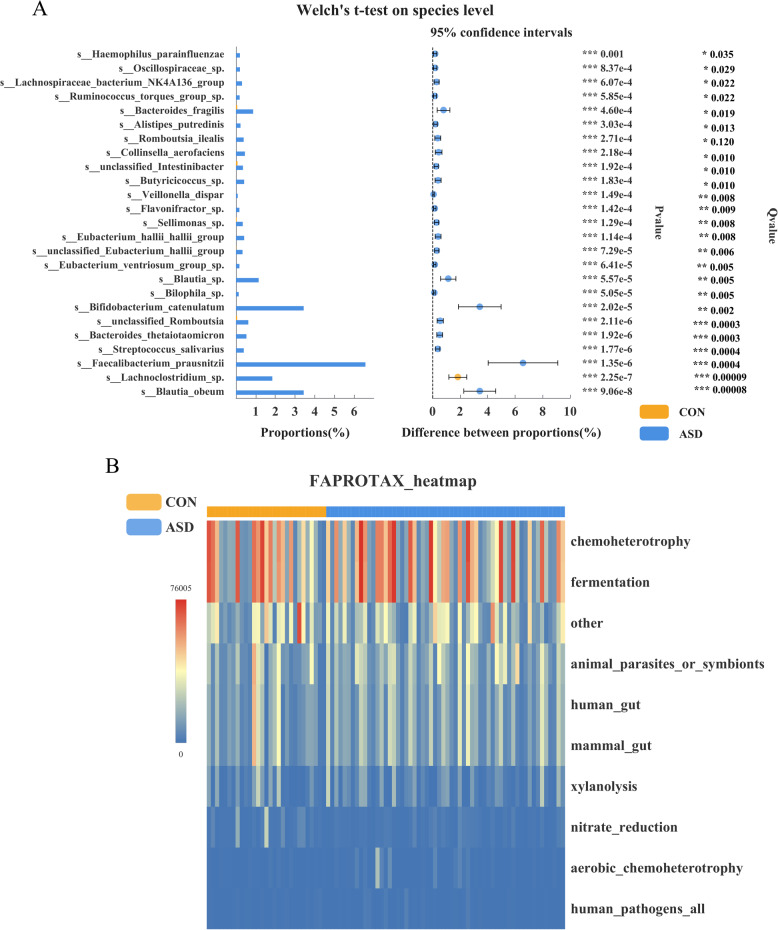
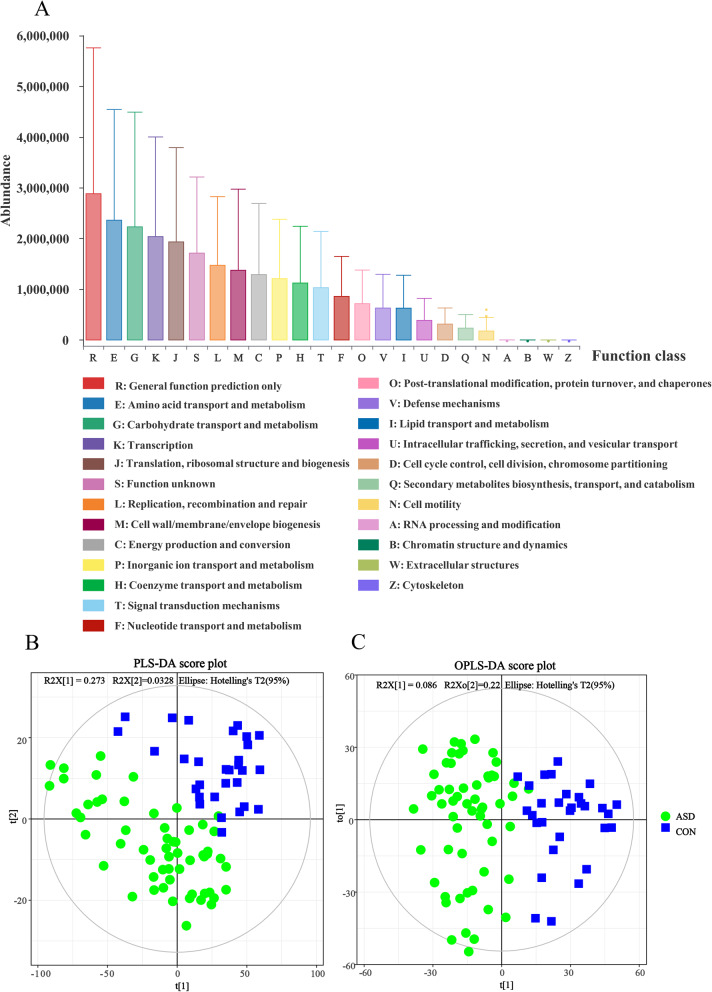
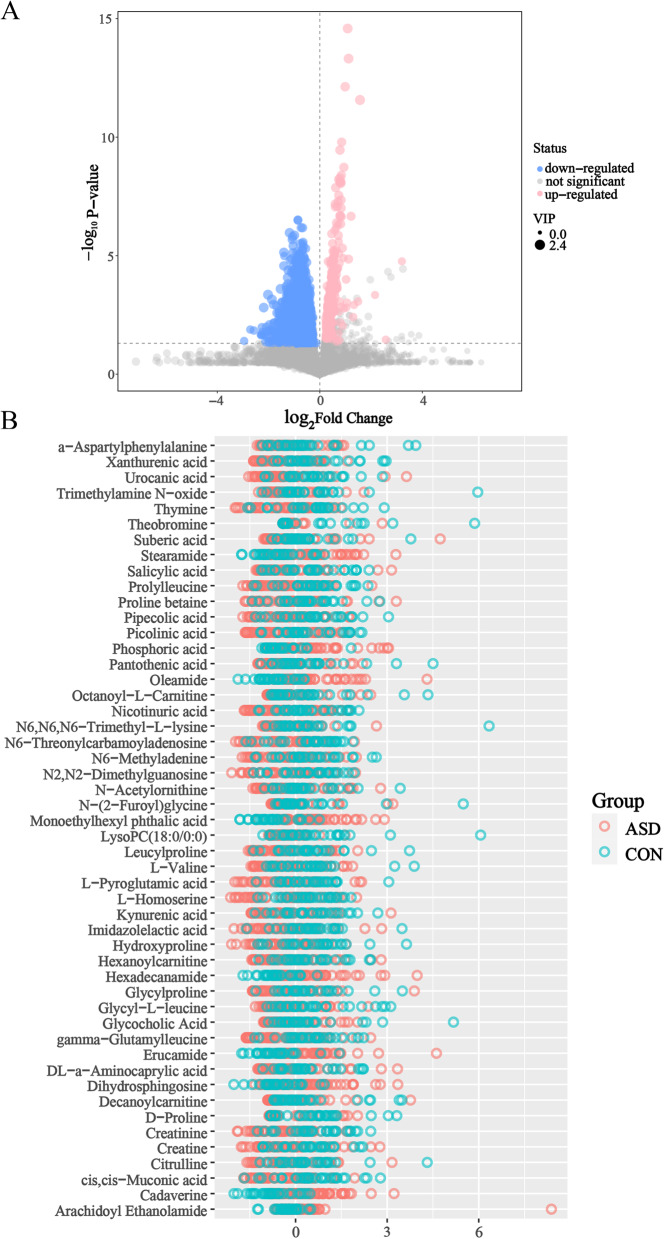
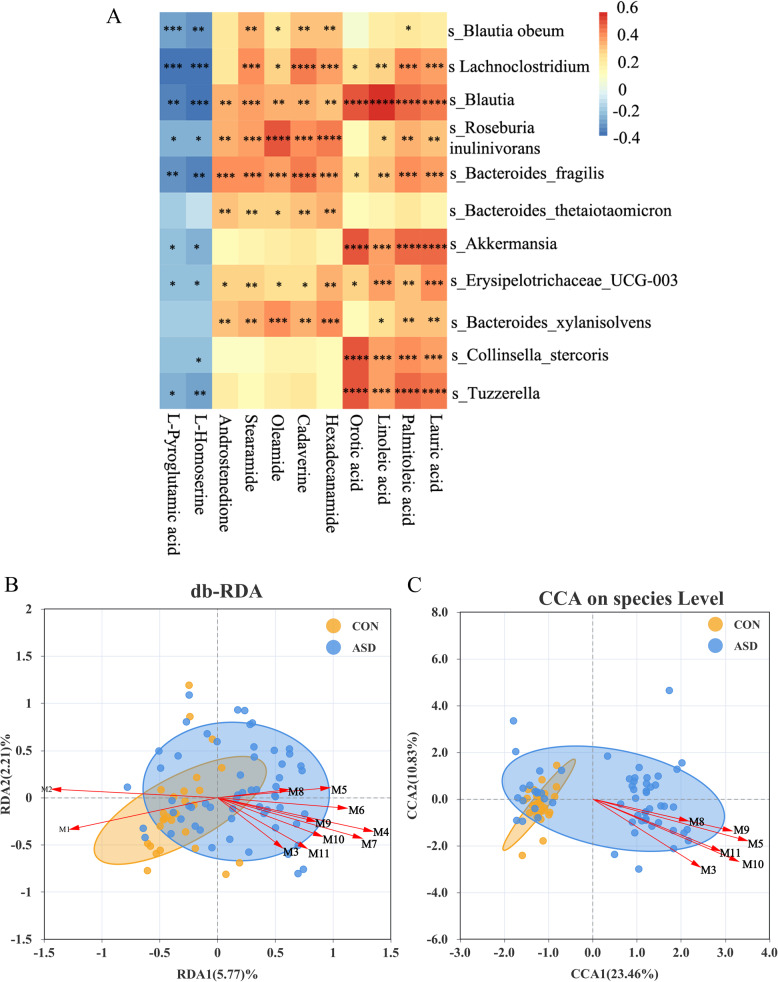
Results: The gut microbial α-diversity of ASD were significantly lower than healthy controls. The β-diversity analysis indicated that the community structure in ASD group was obviously distinctive. Significant microbiota enriched in 5 sensitive species, Faecalibacterium prausnitzii, Bifidobacterium catenulatum, Blautia obeum, Lachnoclostridium sp., and Blautia sp. in ASD children. In addition, functional analysis of the gut microbiota revealed that the ATP-binding cassette and ABC-2 type transport system ATP-binding protein were closely associated with ASD. Notably, microbiota showing a positive correlation with Androstenedione, Stearamide, Oleamide, Cadaverine, Hexadecanamide, Orotic acid, Linoleic acid, Palmitoleic acid, Lauric acid, suggesting a potential association with the Arginine and proline metabolism pathway.

Conclusion: This study found lower α-diversity, unique β-diversity, enriched species, and positive correlations between microbiota and Arginine/Proline metabolis, which demonstrated typical signature of microbiota and metabolites discriminated Zhuang ethnic group ASD children of regional characteristics.

Keywords: Autism spectrum disorder; Guangxi Zhuang autonomous region; Gut microbiota; Urine metabolomics.


Conflict of interest statement

Declarations. Ethics approval and consent to participate: The study was conducted in accordance with the Declaration of Helsinki. This study was approved by the Ethics Committee of the First Affiliated Hospital of Guangxi Medical University (NO.2021-KT-003). All parents of participants in this study have provided written informed consent. Consent for publication: Not applicable. Competing interests: The authors declare no competing interests.

Figures

Fig. 1
Fig. 1
Sample diversity analysis. The Rarefaction curves (A) and Rank-Abundance curves (B) of Autism spectrum disorder group and control group. Comparison of the indices ace, chao, and sobs for calculating community richness between the Autism spectrum disorder group and the control group (C). The distance of the sample in the Principal Component Analysis (PCA) plot (D) reflects the similarity of the sample species composition. Non metric Multidimensional Scaling (NMDS) plot (E) reflects the degree of difference between different samples through the distance between points. PCoA (Principal Coordinates Analysis) plot (F) reflects the similarity of species composition and structure through inter group sample distance. Similarity analysis (Anosim) (G)
Fig. 2
Fig. 2
Community composition analysis. Venn diagram (A); Circos diagram of community composition (B)
Fig. 3
Fig. 3
Abundance analysis. The abundance 3D bar chart (A) provides a more three-dimensional observation of the dominant species or functional distribution in all samples; Taxonomic Tree (B) showed the classification of dominant species based on the taxonomy of the sample, combined with species abundance information, presented in a circular dendrogram
Fig. 4
Fig. 4
Microbial categories. DESeq2 (A) selects the most important microbial categories for sample classification. LEfSe (Linear Discriminant Analysis Effect Size) (B): the horizontal axis represents the significant marker LDA value, and the vertical axis represents the significant marker analyzed
Fig. 5
Fig. 5
Different species analysis and functional enrichment. STAMP difference analysis (Welch's t-test) (A): The left figure shows the abundance ratios of different species classifications in two groups of samples, and the middle figure shows the proportion of differences in species classification abundance within the 95% confidence interval. The rightmost value is the P-value and Q-value, where P-value and Q-value<0.05 indicates significant differences, *represents 0.01<P-value (Q-value)<0.05,**represents 0.001<P-value (Q-value)<=0.01, ***represents P-value (Q-value)<=0.001. Functional abundance heatmap (B): columns represent samples, rows represent functions, and color blocks represent functional abundance values. The redder the color, the higher the abundance, and vice versa
Fig. 6
Fig. 6
COG functional enrichment and metabolic PLS-DA/OPLS-DA. COG functional abundance analysis (A): The horizontal axis represented COG functional categories, and the vertical axis represented the relative abundance values of functions. PLS-DA (B): two-dimensional plot ellipses representing 95% confidence intervals. OPLS-DA(C): two-dimensional plot ellipses representing 95% confidence intervals
Fig. 7
Fig. 7
Metabolic profiles in the positive ion mode of ASD patients and healthy controls. Volcano plot (A) of metabolites of ASD patients compared to healthy controls. The y-axis representsP-value converted to negative log10 (Scale) and the x-axis represents log2 (Fold change). Up regulated significant metabolites were highlighted in red. Down-regulated significant metabolites were highlighted in blue. Z-score analysis (B) showing metabolites expression in the ASD and controls
Fig. 8
Fig. 8
Correlations analysisi between metabolites and microbes. Spearman correlations corrected by FDR (A); db-RDA (B) and CCA (C) were used to link microbes and metabolites

Similar articles

References

    1. Maenner MJ, Shaw KA, Bakian AV, Bilder DA, Durkin MS, Esler A, Furnier SM, Hallas L, Hall-Lande J, Hudson A, et al. Prevalence and characteristics of autism spectrum disorder among children aged 8 years-Autism and developmental disabilities monitoring network, 11 sites, United States, 2018. MMWR Surveill Summ. 2021;70:1–16. - PMC - PubMed
    1. Maenner MJ, Warren Z, Williams AR, Amoakohene E, Bakian AV, Bilder DA, Durkin MS, Fitzgerald RT, Furnier SM, Hughes MM, et al. Prevalence and characteristics of autism spectrum disorder among children aged 8 years - Autism and Developmental Disabilities Monitoring Network, 11 sites, United States, 2020. MMWR Surveill Summ. 2023;72:1–14. - PMC - PubMed
    1. Kang-Yi CD, Grinker RR, Mandell DS. Korean culture and autism spectrum disorders. J Autism Dev Disord. 2013;43:503–20. - PubMed
    1. Dekkers LM, Groot NA, Díaz Mosquera EN, Andrade Zúñiga IP, Delfos MF. Prevalence of autism spectrum disorders in Ecuador: a pilot study in Quito. J Autism Dev Disord. 2015;45:4165–73. - PMC - PubMed
    1. Zhou H, Xu X, Yan W, Zou X, Wu L, Luo X, Li T, Huang Y, Guan H, Chen X, et al. Prevalence of autism spectrum disorder in China: a nationwide multi-center population-based study among children aged 6 to 12 years. Neurosci Bull. 2020;36:961–71. - PMC - PubMed

LinkOut - more resources