

Alertness assessment by optical stimulation-induced brainwave entrainment through machine learning classification
- PMID: 40797265
- PMCID: PMC12344890
- DOI: 10.1186/s12938-025-01422-4
Alertness assessment by optical stimulation-induced brainwave entrainment through machine learning classification
Abstract
Background: Alertness plays a crucial role in the completion of important tasks. However, application of existing methods for evaluating alertness is limited due to issues such as high subjectivity, practice effect, susceptibility to interference, and complexity in data collection. Currently, there is an urgent need for a rapid, quantifiable, and easily implementable alertness assessment method.
Methods: Twelve optical stimulation frequencies ranged from 4 to 48 Hz were chosen to induce brainwave entrainment (BWE) for 30 s, respectively, in 40 subjects. Electroencephalogram (EEG) were recorded at the prefrontal pole electrodes Fpz, Fp1, and Fp2. Karolinska Sleepiness Scale, psychomotor vigilance test and β band power in resting EEG, were used to evaluate the alertness level before and after optical stimulation-induced BWE. The correlation between nine EEG features during the BWE and different alertness states were analyzed. Next, machine learning models including support vector machine, Naive Bayes and logistic regression were employed to conduct integrated analysis on the EEG features with significant differences.
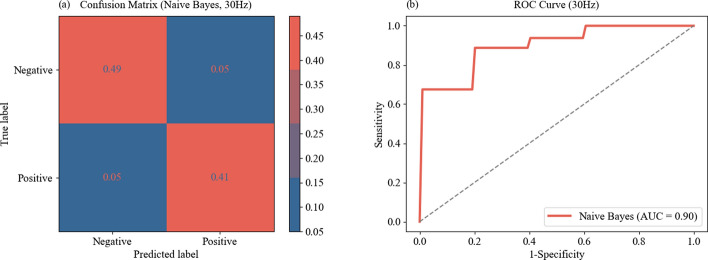
Results: We found that BWE intensity, β band power, and γ band power exhibit significant differences across different states of alertness. The area under the receiver operating characteristic curve (AUC) of individual features for classifying alertness states was between 0.62-0.83. To further improve classification efficacy, these three features were used as input parameters in machine learning models. We found that Naive Bayes model showed the best classification efficacy in 30 Hz optical stimulation, with AUC reaching 0.90, an average accuracy of 0.90, an average sensitivity of 0.89, and an average specificity of 0.90. Meanwhile, we observed that the subjects' alertness levels did not change significantly before and after optical stimulation-induced BWE.
Conclusions: Our study demonstrated that the use of machine learning to integrate EEG features during 30 s optical stimulation-induced BWE showed promising classification capabilities for alertness states. It provided a rapid, quantifiable, and easily implementable alertness assessment option.
Keywords: Alertness; Brainwave entrainment; Electroencephalogram; Karolinska Sleepiness Scale; Machine learning; Optical stimulation; Psychomotor vigilance test.
© 2025. The Author(s).
Conflict of interest statement
Declarations. Ethics approval and consent to participate: This study has received approval from the Ethics Committee of the Hainan Hospital of the General Hospital of the People’s Liberation Army (NO. S2024-01–01). Written informed consent was obtained from the subjects. Competing interests: The authors declare no competing interests.
Figures


References
-
- Gary R, VandenBos. APA dictionary of psychology. 2nd ed. Washington: American Psychological Association; 2007. 10.1037/14646-000.
-
- Liang J, Wang X, Li S, et al. Study on cognitive behavior and subjective evaluation index of seafarer’s alertness. Int Conf Human-Comput Interact. 2022. 10.1007/978-3-031-06388-6_22. - DOI
-
- Yan S, Ahmed W, Saeed HA. Alert and on task: decoding how mental alertness and workload influence maritime operators task performance using task network modeling. Cogn Technol Work. 2024;26:1–19. 10.1007/s10111-024-00769-3. - DOI
-
- Zhang M, Liu D, Wang Q, et al. Detection of alertness-related EEG signals based on decision fused BP neural network. Biomed Signal Process Control. 2022;74: 103479. 10.1016/j.bspc.2022.103479. - DOI
MeSH terms
Grants and funding
LinkOut - more resources
Full Text Sources
