. 2025 Aug 12;23(1):470.
doi: 10.1186/s12916-025-04313-6.

Gut microbiota links to cognitive impairment in bipolar disorder via modulating synaptic plasticity

Affiliations

Gut microbiota links to cognitive impairment in bipolar disorder via modulating synaptic plasticity

Anying Tang et al. BMC Med. .

Abstract

Background: Cognitive impairment is an intractable clinical manifestation of bipolar disorder (BD), but its underlying mechanisms remain largely unexplored. Preliminary evidence suggests that gut microbiota can potentially influence cognitive function by modulating synaptic plasticity. Herein, we characterized the gut microbial structure in BD patients with and without cognitive impairment and explored its influence on neuroplasticity in mice.

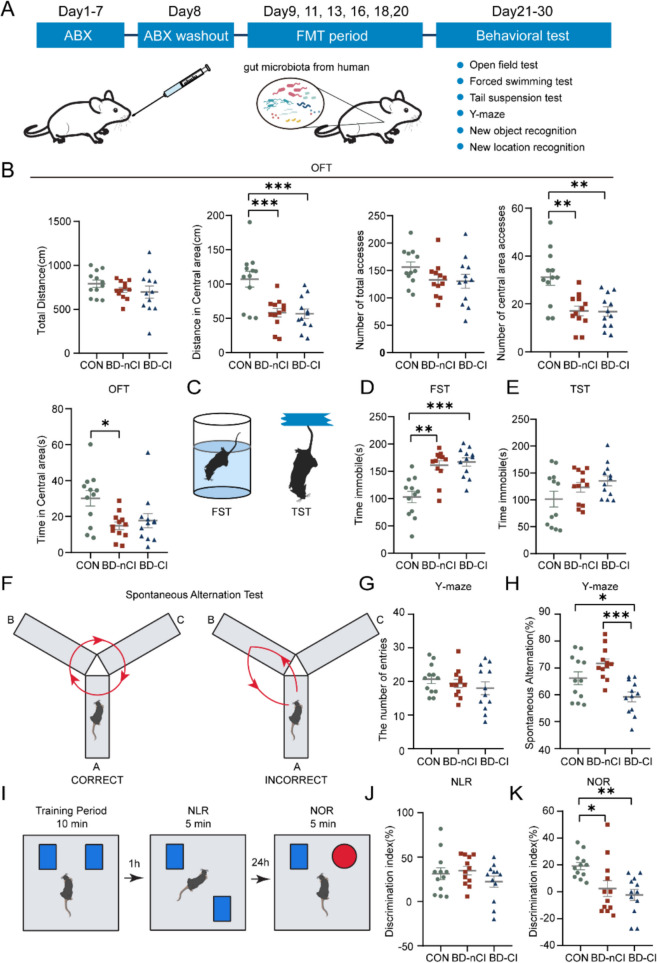
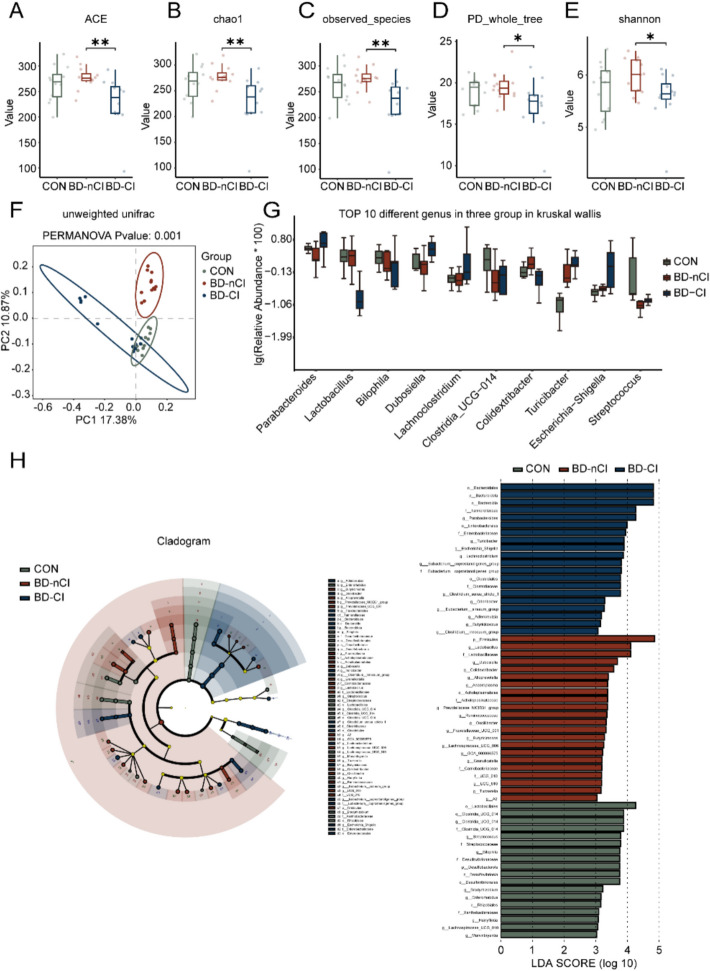
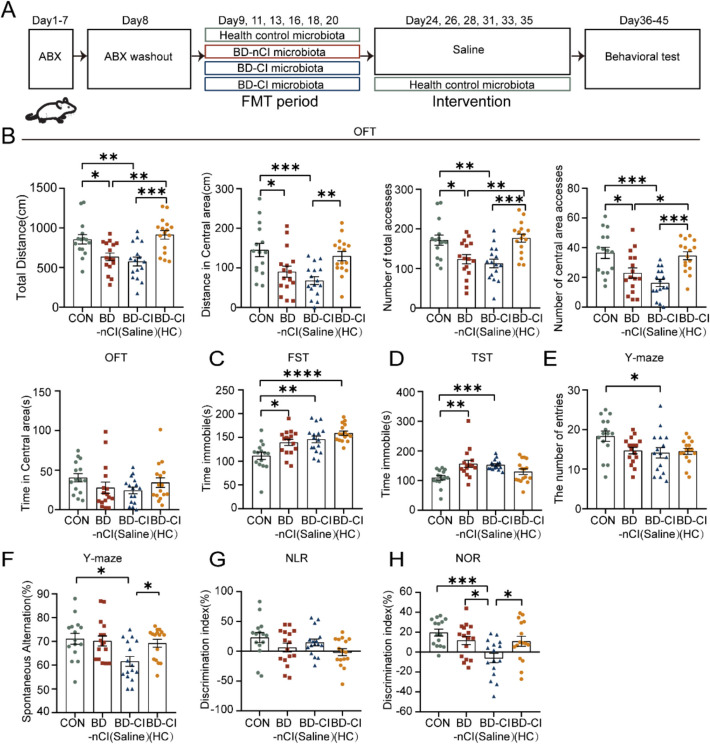
Methods: The gut structure of microbiota in BD without cognitive impairment (BD-nCI) patients, BD with cognitive impairment (BD-CI) patients, and healthy controls (HCs) were characterized, and the correlation between specific bacterial genera and clinical parameters was determined. ABX-treated C57 BL/J male mice were transplanted with fecal microbiota from BD-nCI, BD-CI patients or HCs and subjected to behavioral testing. The change of gut microbiota in recipient mice and its influence on the dendritic complexity and synaptic plasticity of prefrontal neurons were examined. Finally, microbiota supplementation from healthy individuals in the BD-CI mice was performed to further determine the role of gut microbiota.

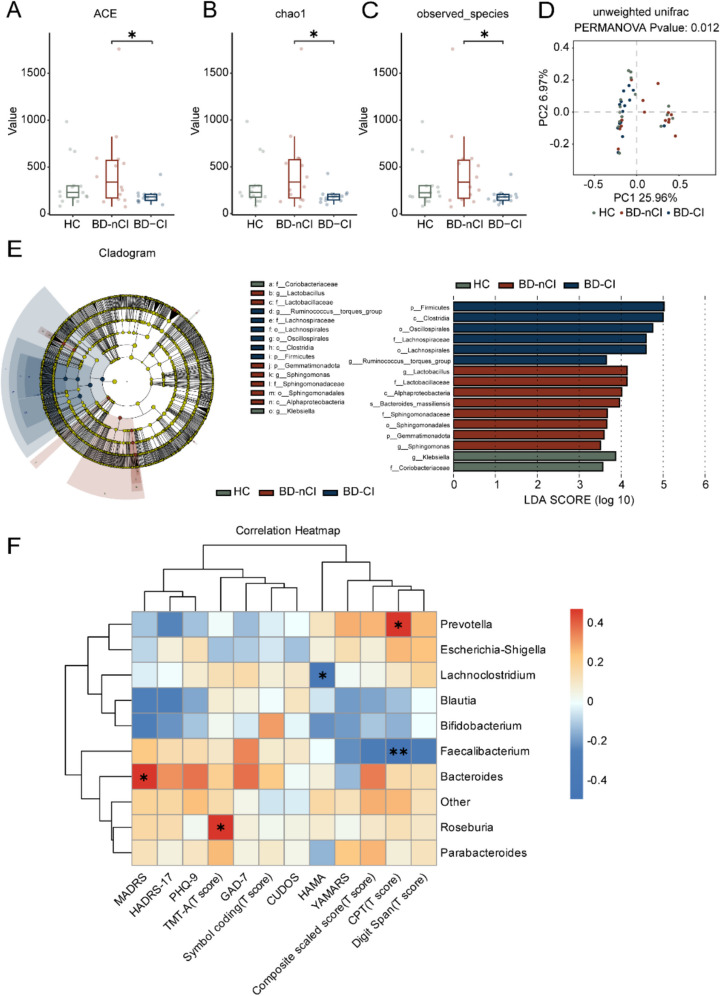
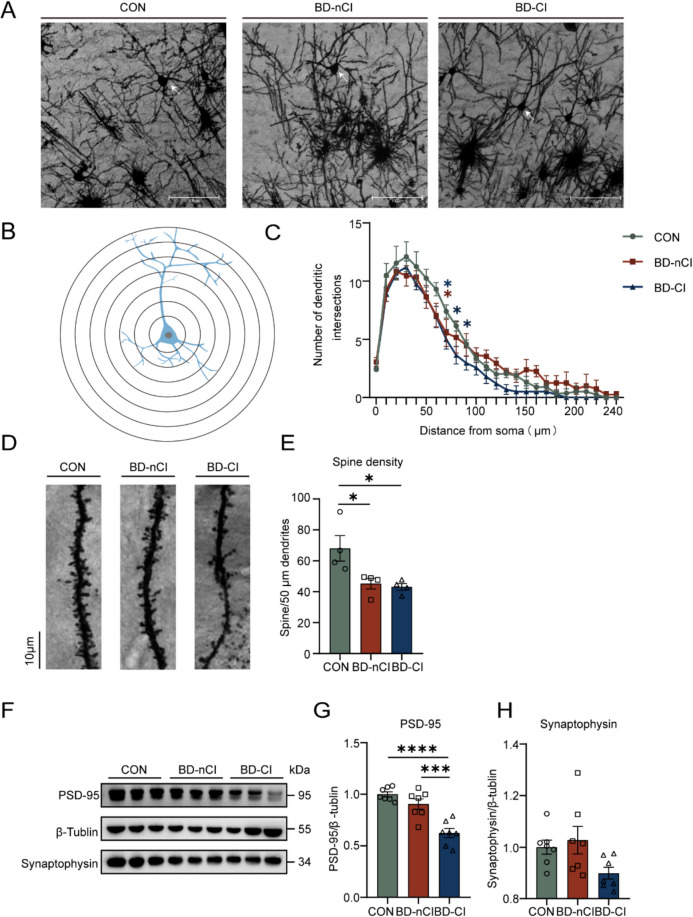
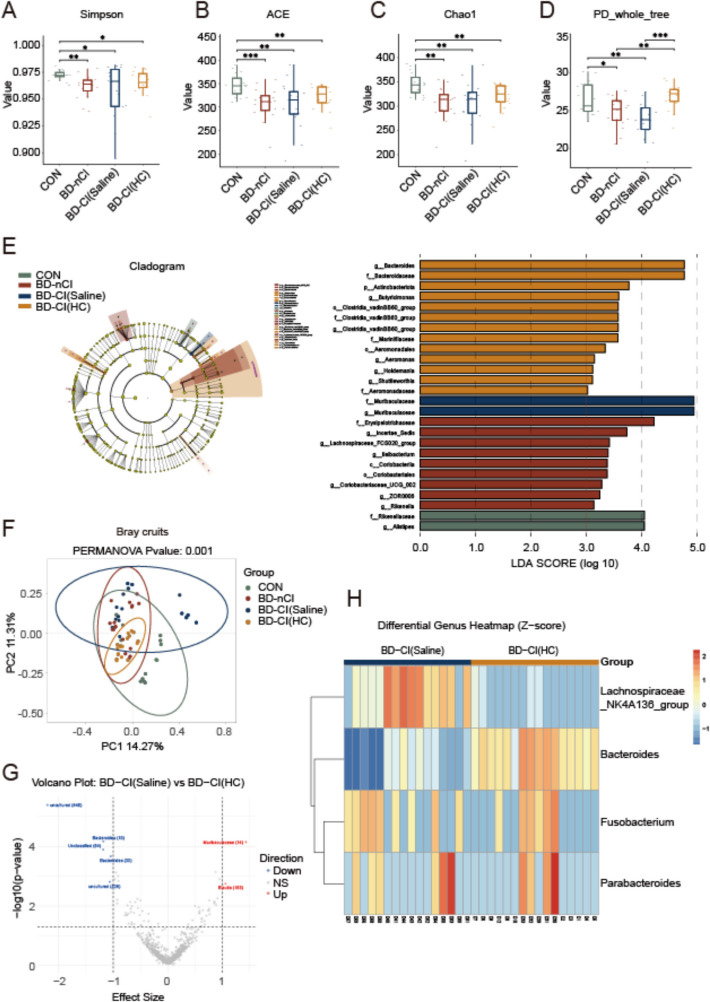
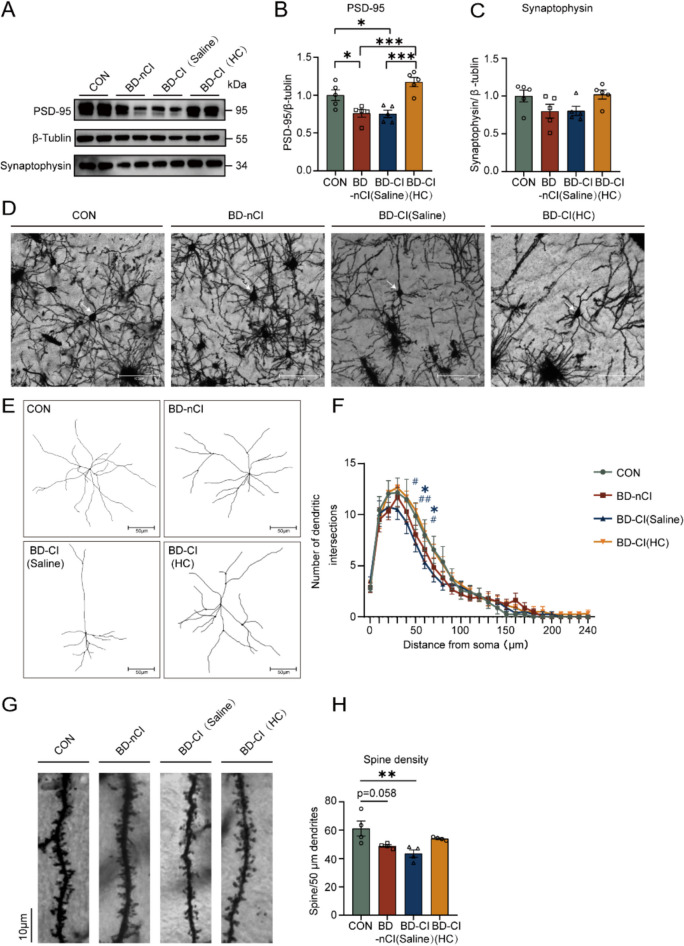
Results: 16S-ribosomal RNA gene sequencing reveals that gut microbial diversity and composition are significantly different among BD-nCI patients, BD-CI patients, and HCs. The Spearman correlation analysis suggested that glucose metabolism-related bacteria, such as Prevotella, Faecalibacterium, and Roseburia, were correlated with cognitive impairment test scores, and inflammation-related bacteria, such as Lachnoclostridium and Bacteroides, were correlated with depressive severity. Fecal microbiota transplantation resulted in depression-like behavior, impaired working memory and object recognition memory in BD-CI recipient mice. Compared with BD-nCI mice, BD-CI mice exhibited more severely impaired object recognition memory, along with greater reductions in dendritic complexity and synaptic plasticity. Supplementation of gut microbiota from healthy individuals partially reversed emotional and cognitive phenotypes and neuronal plasticity in BD-CI mice.

Conclusions: This study first characterized the gut microbiota in BD-CI patients and highlighted the potential role of gut microbiota in BD-related cognitive deficits by modulating neuronal plasticity in mice model.

Keywords: Bipolar disorder; Cognitive impairment; Gut microbiota; Neuroplasticity.


Conflict of interest statement

Declarations. Ethics approval and consent to participate: This study was approved by the Institutional Review Board of the First Affiliated Hospital, School of Medicine of Zhejiang University (reference number #2017–397). All participants provided written informed consent. All animal experiments were approved by the Animal Experimental Ethical Inspection of the First Affiliated Hospital, Zhejiang University School of Medicine (Reference number 2024–376). Consent for publication: Not applicable. Competing interests: The authors declare no competing interests.

Figures

Fig. 1
Fig. 1
Characteristics of the gut microbiota in healthy controls, BD-nCI, and BD-CI patients. A–C The ACE index, Chao1 index, and observed species of Alpha diversity in BD-nCI patients, BD-CI patients, and healthy controls. D Analysis of gut microbiota on principal coordinate analysis (PCoA) of unweighted Unifrac. E LEfSe and LDA analyses revealed differences in taxonomic composition of BD-nCI patients, BD-CI patients, and healthy controls. F The correlation heatmap showed the correlation between the top 10 species of gut microbiota and the scale scores of BD-nCI and BD-CI patients. Data are presented as means ± standard errors of the means (± SEM). Significant differences were measured by Wilcoxon rank-sum test (A–C) and Spearman analysis (F) (*p < 0.05, **p < 0.01, ***p < 0.001, ****p < 0.0001)
Fig. 2
Fig. 2
Establishment of the FMT mouse model and the behavioral testing. A The schematic diagram of experimental design for the establishment of fecal microbiota transplantation mouse model. B The total distance, total crossing, distance in central area, time in central area and crossing in central area for control, BD-nCI, and BD-CI mice in the open field test. C The diagram of forced swimming test and tail suspension test. D Time spent immobile in the FST. E Time spent immobile in the TST. F The schematic diagram of Y-maze to test spontaneous alternation rate. G The number of entries in Y-maze. H The spontaneous alternation rate in Y-maze. I The schematic diagram of NLR and NOR. J The discrimination index in NLR. K The discrimination index in NOR. Control group (N = 12), BD-nCI group (N = 12), BD-CI group (N = 12). Data are presented as means ± standard errors of the means (± SEM). Significant differences were measured by one-way ANOVA (B,E,G,H,J,K) and Kruskal–Wallis test (D) (*p < 0.05, **p < 0.01, ***p < 0.001, ****p < 0.0001)
Fig. 3
Fig. 3
The change of gut microbiota in BD-nCI mice, BD-CI mice, and control mice following FMT. A–E The ACE index, Chao1 index, observed species, PD whole tree, and Shannon index of Alpha diversity in BD-nCI mice, BD-CI mice, and control mice. F Analysis of gut microbiota on principal coordinate analysis (PCoA) of unweighted Unifrac. G The top 10 different microbes were compared at the genus level. H LEfSe and LDA analyses revealed differences in taxonomic compositions. Data are presented as means ± standard errors of the means (± SEM). Significant differences were measured by Wilcoxon rank-sum test (A–E), Kruskal–Wallis test (G) (*p < 0.05, **p < 0.01, ***p < 0.001, ****p < 0.0001)
Fig. 4
Fig. 4
Gut microbiota linked to impaired drendritic plasticity and decreased the PSD-95 protein expression. A Representative PFC neurons in Golgi staining of BD-nCI mice, BD-CI mice and control mice. N = 20 neurons from 4 mice per group, captured with a × 10 objective. B The schematic representation of a neuron drawn. Quantitative Sholl analysis of neuron by counting the number of intersections. C Sholl analysis of neuron dendrites of from the PFC region. D Representative images of the secondary branch of apical dendrites of neurons in the PFC captured with a × 40 objective. E Quantitation of the total spine densities in mice. F–H Representative immunoblots and densitometry analysis of PSD-95 and synaptophysin. Control group (N = 7), BD-nCI group (N = 7), BD-CI group (N = 7). Data are presented as means ± standard errors of the means (± SEM). Significant differences were measured by one-way ANOVA (E, G, H), two-way ANOVA (C) (*p < 0.05, **p < 0.01, ***p < 0.001, ****p < 0.0001)
Fig. 5
Fig. 5
Supplementation of gut microbiota from healthy individuals ameliorated depression-like behavior and cognitive impairment in BD-CI mice. A The schematic diagram of supplementation of gut microbiota from healthy individuals. B The total distance, total crossing, distance in central area, time in central area and crossing in central area for control, BD-nCI, BD-CI (Saline), and BD-CI (HC) group mice in the open field test. C Time spent immobile in the FST. D Time spent immobile in the TST. E The number of entries in Y-maze. F The spontaneous alternation rate in Y-maze. G The discrimination index in NLR. H The discrimination index group mice in NOR. Control group (N = 15), BD-nCI group (N = 16), BD-CI (Saline) group (N = 16), BD-CI (HC) group (N = 16). Data are presented as means ± standard errors of the means (± SEM). Significant differences were measured by one-way ANOVA (B,C,E,G,H), and Kruskal–Wallis test (D,F) (*p < 0.05, **p < 0.01, ***p < 0.001, ****p < 0.0001)
Fig. 6
Fig. 6
Supplementation of the gut microbiota from healthy individuals improves gut microbe diversity and structure in BD-CI mice. A–D The Simpson index, ACE index, Chao1 index, and PD_whole_tree of Alpha diversity in control, BD-nCI, BD-CI (Saline), and BD-CI (HC) group. E Lefse and LDA analyses revealed differences in taxonomic composition of control, BD-nCI, BD-CI (Saline), and BD-CI (HC) group. F Analysis of gut microbiota on principal coordinate analysis (PCoA) of Bray-Crutis. G The volcano plots of up- and downregulated differential microbes between BD-CI (Saline) and BD-CI (HC) under ALDEx2 analysis. Features with we.ep < 0.05 were considered significantly different. Taxa with an absolute effect size > 1 were highlighted for emphasis. H The heatmap of differential genus between BD-CI (Saline) and BD-CI (HC) under ALDEx2 analysis. Data are presented as means ± standard errors of the means (± SEM). Significant differences were measured by Wilcoxon rank-sum test (A–D) (*p < 0.05, **p < 0.01, ***p < 0.001, ****p < 0.0001)
Fig. 7
Fig. 7
Microbiota supplement from healthy individuals partially reversed the impaired neuronal synaptic structure and the PSD-95 protein expression. A–C Representative immunoblots and densitometry analysis of PSD-95 and synaptophysin. Control group (N = 5), BD-nCI group (N = 5), BD-CI (Saline) group (N = 5), BD-CI (HC) group (N = 5). D Representative PFC neurons in Golgi staining of BD-nCI mice, BD-CI (Saline) mice, BD-CI (HC) mice, and control mice. N = 20 neurons from 4 mice per group, captured with a × 10 objective. E Representative tracing images of PFC neurons in four groups. F Sholl analysis of neuron dendrites of PFC from mice. G Representative images of the secondary branch of apical dendrites of neurons in the PFC captured with a × 40 objective. H Quantitation of the total dendritic spine densities in mice. Data are presented as means ± standard errors of the means (± SEM). Significant differences were measured by one-way ANOVA (B,C,H), two-way ANOVA (F) (*p < 0.05, **p < 0.01, ***p < 0.001, ****p < 0.0001)

Similar articles

References

    1. Vieta E, Berk M, Schulze TG, Carvalho AF, Suppes T, Calabrese JR, et al. Bipolar disorders. Nat Rev Dis Primers. 2018;4: 18008. 10.1038/nrdp.2018.8. - PubMed
    1. McGrath JJ, Al-Hamzawi A, Alonso J, Altwaijri Y, Andrade LH, Bromet EJ, et al. Age of onset and cumulative risk of mental disorders: a cross-national analysis of population surveys from 29 countries. Lancet Psychiatry. 2023;10(9):668–81. 10.1016/s2215-0366(23)00193-1. - PMC - PubMed
    1. Piedrahíta Palacio N, García Valencia J, Vargas Upegüi CD, López Jaramillo C. Pathophysiological relationships between cognitive deficit in bipolar affective disorder and metabolic syndrome. Rev Colomb Psiquiatr (Engl Ed). 2024;53(3):376–84. 10.1016/j.rcpeng.2024.10.002. - PubMed
    1. Zhang J, Zhong S, Lai S, Zhang Y, Chen G, Huang D, et al. MIR218 polygenic risk score is associated with cognitive function and neurochemical metabolites among patients with depressed bipolar disorders. J Affect Disord. 2025;371:104–12. 10.1016/j.jad.2024.11.046. - PubMed
    1. Martino DJ. Neurodevelopment as an alternative to neuroprogression to explain cognitive functioning in bipolar disorder. Psychol Med. 2024;54(16):4469. 10.1017/s0033291724003210. - PMC - PubMed

LinkOut - more resources