. 2025 Aug 12;26(1):149.
doi: 10.1186/s40360-025-00985-1.

Hyperoside mitigates amphotericin B-induced nephrotoxicity in HK-2 cells via bioenergetic and oxidative stress modulation

Affiliations

Hyperoside mitigates amphotericin B-induced nephrotoxicity in HK-2 cells via bioenergetic and oxidative stress modulation

Ekramy M Elmorsy et al. BMC Pharmacol Toxicol. .

Abstract

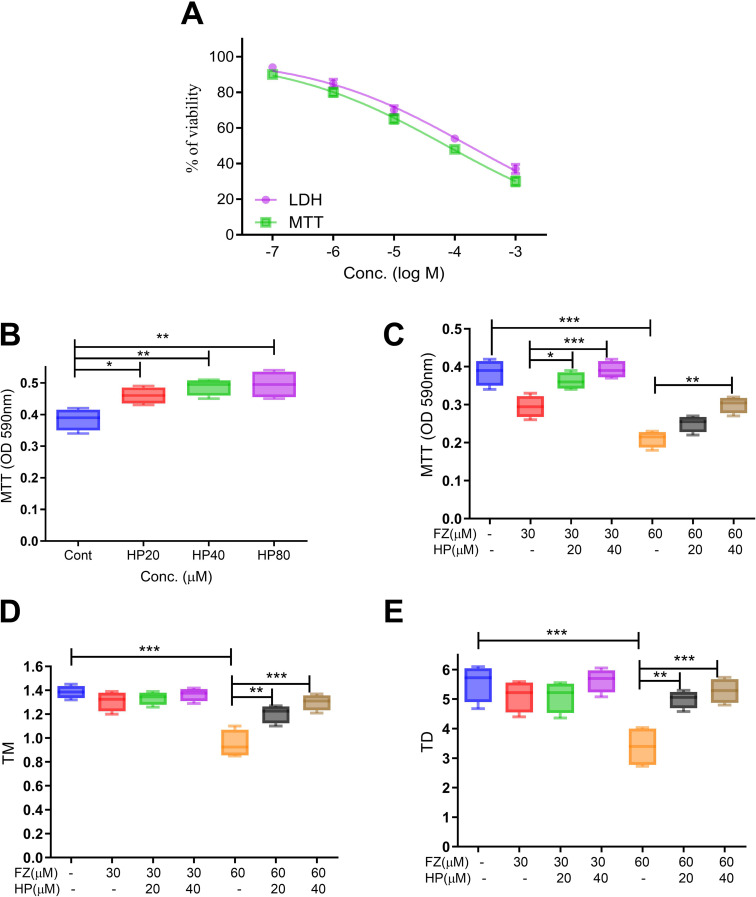
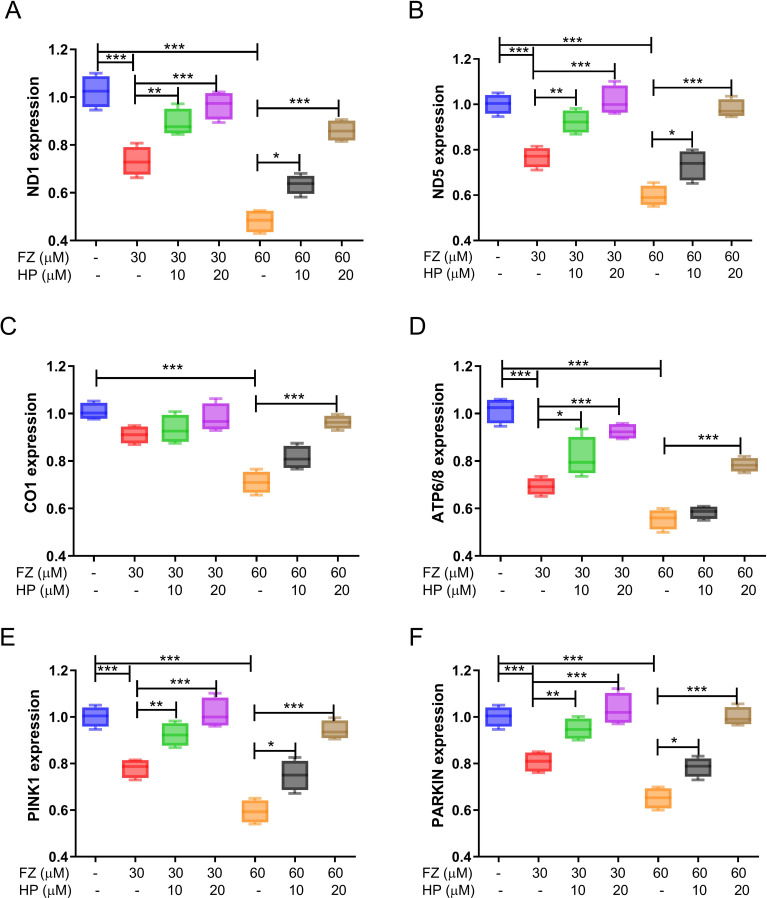
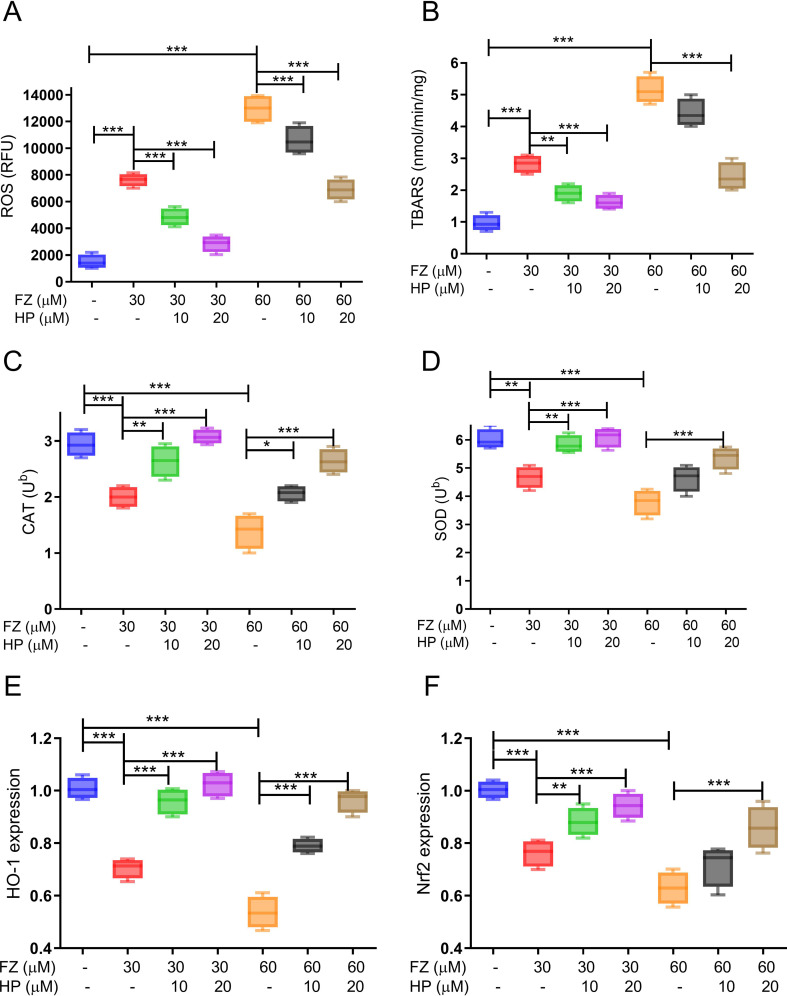
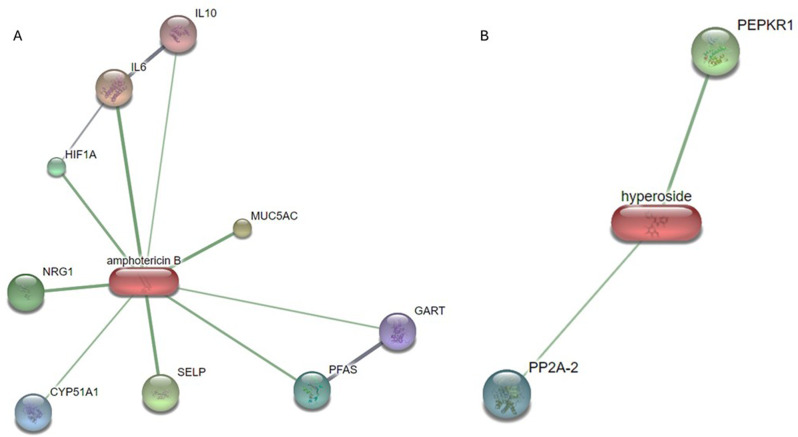
Amphotericin B (Amp-B/FZ), a first-line antifungal, is limited by dose-dependent nephrotoxicity. This study investigated the protective effects of hyperoside (HP), a dietary flavonoid, against FZ-induced renal toxicity in human proximal tubular (HK-2) cells. Molecular docking revealed strong binding affinities of HP with mitophagy (PINK1/PARKIN) and antioxidant (Nrf2/HO-1) regulators, contrasting with FZ's preferential binding to mitochondrial complex I. FZ (30-60 µM) induced cytotoxicity (MTT/LDH), genotoxicity (comet assay), and bioenergetic disruption: ATP depletion (58%), mitochondrial complex I/III inhibition (42-67%), and PINK1/PARKIN dysregulation. FZ elevated reactive species (3.2-fold) and lipid peroxidation (2.8-fold) while suppressing catalase (64%) and superoxide dismutase (51%) activities. qPCR confirmed FZ-induced downregulation of NDUFS1, CYC1, CAT, and SOD2, alongside impaired Nrf2/HO-1 antioxidant signaling. Co-treatment with HP (20-40 µM) attenuated FZ toxicity, restoring ATP (1.8-fold), mitochondrial complex activities (35-49%), and antioxidant defenses (CAT:2.1-fold, SOD:1.7-fold). HP also normalized Nrf2/HO-1 expression and mitigated oxidative/genotoxic damage. These findings highlight HP's dual role in countering FZ-induced mitochondrial dysfunction and oxidative stress, positioning it as a promising nephroprotective adjuvant. Further in vivo validation could advance HP's clinical application in reducing antifungal-associated renal injury.

Keywords: Amphotericin B; Bioenergetic disruption; Fungizone; Hyperoside; Nephrotoxicity.


Conflict of interest statement

Declarations. Ethical approval: Not applicable. Consent to participate: Not applicable. Competing interests: The authors declare no competing interests.

Figures

Fig. 1
Fig. 1
Molecular docking images of Fungizone (FZ) with the target proteins of mitochondrial complex I (MCI), mitochondrial complex III (MCIII), catalase (CAT), and superoxide dismutase (SOD) target proteins. Residues are shown in the graphs. Hydrogen bonds and hydrophobic contacts are shown as dotted blue and gray lines
Fig. 2
Fig. 2
Molecular docking images of hyperosie (HP) with caspase-3 (Cas-3) and Bax target proteins. Residues are shown in the graphs. Hydrogen bonds and hydrophobic contacts are shown as dotted blue and gray lines
Fig. 3
Fig. 3
The effect of hyperoside (HP) and fungizone (FZ) on the human kidney cell line (HK-2) viability and DNA material. Viability was assessed by MTT assay (1 A-1 C), while the alkaline comet assay was used to study the genotoxicity (1D and 1E). FZ at a concentration range from 10µM to 10 mM was cytotoxic to the treated cells in a concentration-dependent manner 24 h post-exposure (1 A). At the same time, HP significantly improved the HK-2 cell viability at concentrations 20, 40, and 80µM 24 h post-treatment (1B). Interestingly, HP co-treatment with FZ significantly counteracted FZ-induced toxicity in the treated cells. Comet Tail momentum ™ and tail DNA% (TD) showed that FZ (60 µM) was genotoxic to the kidney cells 24 h postexposure. HP (10 and 20µM) (1D and 1E) significantly attenuated this genotoxic effect. One-way ANOVA with Tukey’s post-test was used to assess statistical significance. *p-value < 0.05, **p-value < 0.01, ***p-value < 0.001
Fig. 4
Fig. 4
The effect of hyperoside (HP) and fungizone (FZ) on the human kidney cell line (HK-2) bioenergetics biomarkers. The effect of FZ (30 or 60 µM) and co-treatment with HP (10 or 20 µM) on the kidney cells mitochondrial complex I (MCI) (2 A), mitochondrial complex III (MCIII) (2B), ATP (2 C), mitochondrial membrane potential (MMP) (2D), and mitophagy proteins PARKIN (2E) and PTEN-induced kinase 1 (PINK1) (2 F) was evaluated. FZ was shown to inhibit the treated cells’ mitochondrial bioenergetics significantly. In contrast, HP co-treatment with FZ significantly counteracted FZ-induced effects on the bioenergetics and mitochondrial functions of the treated cells. One-way ANOVA with Tukey’s post-test was used to assess statistical significance. *p-value < 0.05, **p-value < 0.01, ***p-value < 0.001
Fig. 5
Fig. 5
The effect of hyperoside (HP) and fungizone (FZ) on the human kidney cell line (HK-2) mitochondrial gene expression. The effect of FZ (30 or 60 µM) and co-treatment with HP (20 or 40 µM) on the kidney cells NADH dehydrogenase subunit 1 (ND1) (3 A), NADH dehydrogenase subunit 5 (ND%) (3B), cytochrome C oxidase subunit 1 (CO-1) (3 C), ATP synthase subunit 6/8 (ATP 6/8) (3D), and mitophagy proteins coding genes PARKIN (3E) and PTEN-induced kinase 1 (PINK1) (3 F) was evaluated. FZ was shown to significantly inhibit the tested gene expression of the treated cells. Meanwhile, HP co-treatment with FZ significantly counteracted the FZ-induced effect on the gene expression of the treated cells. One-way ANOVA with Tukey’s post-test was used to assess statistical significance. *p-value < 0.05, **p-value < 0.01, ***p-value < 0.001
Fig. 6
Fig. 6
The effect of hyperoside (HP) and fungizone (FZ) on the human kidney cell line (HK-2) oxidative stress biomarkers. The effect of FZ (30 or 60 µM) and co-treatment with HP (20 or 40 µM) on the kidney cells reactive oxygen species (ROS) (4 A), lipid peroxidation thiobarbituric acid derivatives intermediate (TBARS) (4B), antioxidant enzymes catalase (CAT) and superoxide dismutase (SOD) activities (CAT) (4 C and 4D), heme oxygenase 1; HO-1 (4E), and nuclear factor erythroid 2-related factor (NrF2) (4 F). FZ was shown to significantly increase ROS and TBARS with decreased antioxidants CAT and SOD activities and HO-1 and Nrf2 expression. Meanwhile, HP co-treatment with FZ significantly counteracted the FZ-induced effect on oxidative stress parameters in the treated cells. One-way ANOVA with Tukey’s post-test was used to assess statistical significance. *p-value < 0.05, **p-value < 0.01, ***p-value < 0.001
Fig. 7
Fig. 7
The effect of hyperoside (HP) and fungizone (FZ) on the human kidney cell line (HK-2) apoptosis pathways and related genes. The effect of FZ (30 or 60 µM) and co-treatment with HP (20 or 40µM) on the kidney cells caspase-3 (Cas-3) (5 A), caspase-8 (Cas-8) (5B), caspase-9 (Cas-9) (5 C), Bax/Bcl2 ratio (5D). FZ was shown to increase the caspases activities and Bax/Bcl2 ratio significantly. Meanwhile, HP co-treatment with FZ significantly counteracted the FZ-induced effect on oxidative stress parameters in the treated cells. One-way ANOVA with Tukey’s post-test was used to assess statistical significance. *p-value < 0.05, **p-value < 0.01, ***p-value < 0.001
Fig. 8
Fig. 8
Multivariate analysis of biochemical, oxidative stress, mitochondrial, and apoptotic markers in response to hyperoside (HP) and fungizone (FZ) treatments. (A–D) Principal component analysis (PCA) score plots depicting sample clustering based on measured parameters. Each plot illustrates group separation along the first two principal components, indicating the variance explained by treatment. (E) Hierarchical clustering heatmap of standardized Z-scores for oxidative stress (ROS, TBARS), apoptotic markers (Caspases, Bax/Bcl-2), mitochondrial function (ND1, ND5, ATP6/8, MMP), antioxidant enzymes (CAT, HO-1, Nrf2), and viability indicators (MTT, TM, TD). Blue indicates downregulation; red indicates upregulation relative to the mean. The clustering highlights clear segregation between control, FZ-only, and FZ + HP co-treatment groups, with enhanced mitochondrial and antioxidant responses observed in the latter. Group labels: Cont (control), FZ30/FZ60 (FZ at 30 and 60 mg/kg), FZ30 + HP10/20 and FZ60 + HP10/20 (FZ combined with HP at 10 or 20 mg/kg, respectively)
Fig. 9
Fig. 9
Predicted Protein Interaction (PPI) Network of Amphotericin-B (Amp-B) deoxycholate (A) and hyperoside (HP) (B). The partners include “FZ “IL6: interleukin 6; IL10: interleukin 10; HIF1A: hypoxia-inducible factor 1, alpha subunit (basic helix-loop-helix transcription factor); Functions as a master transcriptional regulator of the adaptive response to hypoxia. Under hypoxic conditions, it activates the transcription of over 40 genes, including the “NRG1; neuregulin 1, MUC5AC; mucin 5AC, oligomeric mucus/gel-forming, CYP51A1; cytochrome P450, family 51, subfamily A, polypeptide 1, SELP; selectin P (granule membrane protein 140 kDa, antigen CD62); Ca2+-dependent receptor for myeloid cells that binds to carbohydrates on neutrophils and monocytes. Mediates the interaction of activated endothelial cells or platelets with leukocytes, PFAS; phosphoribosylformylglycinamidine synthase, GART; phosphoribosylglycinamide formyltransferase, phosphoribosylglycinamide synthetase, phosphoribosylaminoimidazole synthetase.” While partners for HP include " phosphoenolpyruvate carboxylase-related kinase 1 (PEPKR1) and protein phosphatase 2A-2 (PP2A-2).” Proteins are connected according to anticipated interactions with FZ or HP, where the thickness of the lines indicates the evidence strength for each relationship. Green lines represent chemical-protein interactions, while gray lines depict protein-protein interactions. This network aligns with the proposed functions of Amp-B and HP in influencing cellular processes related to their effect. Data source: “STITCH database (http://stitch.embl.de/) (last accessed 9 March 2025) ”
Fig. 10
Fig. 10
Schematic representation of the four major mechanisms underlying Amphotericin B (FZ)-induced nephrotoxicity in HK-2 cells and the protective actions of Hyperoside (HP). FZ induces oxidative stress by increasing ROS and suppressing antioxidant defenses, leading to lipid and DNA damage (genotoxicity), mitochondrial dysfunction with impaired bioenergetics, and activation of apoptotic pathways via caspase signaling and Bax/Bcl-2 imbalance. HP exerts nephroprotection by scavenging ROS, restoring antioxidant enzyme activities, preserving mitochondrial function, reducing DNA damage, and inhibiting apoptosis, thereby mitigating FZ-induced renal tubular cell injury

Similar articles

References

    1. Perazella MA. Renal vulnerability to drug toxicity. Clin J Am Soc Nephrol. 2009;4(7):1275–83. - PubMed
    1. Al-Khikani FHO. Amphotericin B, The wonder of today’s pharmacology science: persisting usage for more than seven decades. Pharm Biomedical Res 2020.
    1. Cavassin FB, Baú-Carneiro JL, Vilas-Boas RR, Queiroz-Telles F. Sixty years of amphotericin B: an overview of the main antifungal agent used to treat invasive fungal infections. Infect Dis Therapy. 2021;10(1):115–47. - PMC - PubMed
    1. Handl J, Čapek J, Majtnerová P, Báčová J, Roušar T. The effect of repeated passaging on the susceptibility of human proximal tubular HK-2 cells to toxic compounds. Physiol Res. 2020;69(4):731–8. - PMC - PubMed
    1. García-Pérez E, Ryu D, Kim HY, Kim HD, Lee HJ. Human proximal tubule epithelial cells (HK-2) as a sensitive in vitro system for Ochratoxin A induced oxidative stress. Toxins 2021;13(11). - PMC - PubMed

LinkOut - more resources