. 2025 Dec;57(1):2546670.
doi: 10.1080/07853890.2025.2546670. Epub 2025 Aug 12.

METTL3-mediated m6A modification promotes intervertebral disc degeneration

Affiliations

METTL3-mediated m6A modification promotes intervertebral disc degeneration

Qinghua Yang et al. Ann Med. 2025 Dec.

Abstract

Background: N6-methyladenosine (m6A) modification is a prevalent RNA modification in epigenetics. METTL3, acting as the principal methyltransferase responsible for catalysing m6A, is regarded as a master regulator of this RNA modification. Nonetheless, the complex roles and underlying mechanisms of m6A in relation to intervertebral disc degeneration (IDD) are yet to be fully elucidated. In light of this, this study aimed to explore the intricate functions and mechanisms of METTL3-mediated m6A modification in IDD.

Methods: Our previous batch of RNA sequencing data (GSE167199) and public single-cell data (GSE165722) were utilized to probe the relationship between m6A-related genes and IDD. m6A quantification, RNA m6A immunoblotting, quantitative real-time PCR, western blot and immunofluorescent staining were used to validate the levels of m6A modification and expression of m6A-related genes in nucleus pulposus (NP) tissues and cells. Moreover, gain- and loss-of-function experiments in NP cells were conducted to explore the impact of METTL3 on IDD. In vivo, the effects of METTL3 inhibition and miR-338-3p suppression on IDD progression were assessed.

Results: A significant association between METTL3-mediated m6A modification and IDD was identified. Overexpressing METTL3 induced apoptosis, accelerated senescence and inhibited matrix synthesis in NP cells. Additionally, METTL3-mediated m6A modification could expedite the production and maturation of pri-miR-338-3p in NP cells via DGCR8. In vivo, inhibiting METTL3 mitigated IDD progression, while suppressing miR-338-3p notably alleviated IDD during METTL3 overexpression.

Conclusions: This study reveals that targeting METTL3 attenuates IDD progression through the METTL3-m6A-miR-338-3p axis, thereby highlighting the therapeutic potential of METTL3 inhibition for IDD. Future studies should prioritize the development of biomaterial delivery systems for METTL3 inhibitors to ensure both therapeutic protection and sustained, site-specific drug release.

Keywords: Intervertebral disc degeneration; METTL3; N6-methyladenosine; miR-338-3p.


Conflict of interest statement

No potential conflict of interest was reported by the author(s).

Figures
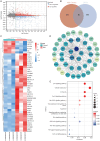
Figure 1.
Figure 1.
Potential association between m6A methylation-related genes and intervertebral disc degeneration (IDD). (A) the volcano plot of gene expression differential analysis: red represents upregulated genes, blue represents downregulated genes, and grey represents genes with no significant differential expression. (B) Venn diagram: Intersection analysis resulted in 44 m6A differentially expressed genes (DEGs). (C) Heatmap visualization of the expression levels of the 44 m6A DEGs: the horizontal axis represents sample names, and the vertical axis represents gene names. Darker red indicates higher gene expression levels, while darker blue indicates lower gene expression levels. (D) Protein-protein interaction (PPI) network of the 44 m6A DEGs: Nodes represent genes, and edges represent interactions between genes. Nodes closer to the centre and with darker colours indicate more interactions with other genes. (E) The Kyoto Encyclopedia of Genes and Genomes (KEGG) enrichment analysis results of the 44 m6A DEGs.
Figure 2.
Figure 2.
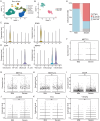
ScRNA-Seq reveals the expression of m6A regulators in NP cells. (A-B) Uniform manifold approximation and projection (UMAP) plot showing the identification of human NP cells and macrophage cells, with different colours indicating different cells. (C,D) Marker genes of human NP cells and macrophages cells. (E) Distribution of M1-like and M2-like macrophages in NP tissues of the mild IDD group and the severe IDD group. (F–L) Expression of m6A regulators in human NP cells of patients with IDD. (F) Compared with the mild IDD group, METTL3 expression was upregulated in the severe IDD group. No significant differences were recognized in the expression levels of METTL14, METTL4, WTAP, ALKBH5, FTO and YTHDF2. Data are presented as the median with interquartile range (25th to 75th percentiles). p Values are from Mann–Whitney U test. **p < .01, ns ‘no significance’.
Figure 3.
Figure 3.
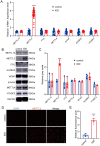
METTL3 Were upregulated in IDD. (A) qRT-PCR analysis showed significantly elevated METTL3 mRNA expression in IDD NP tissues (n = 35) compared to controls (n = 35). Data are means ± SD, and p values are from two-tailed unpaired t test. (B,C) Protein expression level of METTL14, METTL3, FTO, ALKBH5, WTAP, METTL4 and YTHDF2 in IDD NP tissues and controls. β-actin was used as the loading control for METTL14, METTL3, FTO, ALKBH5 and WTAP, while GAPDH served as the loading control for METTL4 and YTHDF2. The grouping of blots cropped from different parts of the same gel. Data represent mean ± SD (n = 3). p Values are from two-tailed unpaired t test. (D,E) Representative immunofluorescence staining of METTL3 and DAPI staining of nuclei in NP cells of control and IDD groups (scale bar, 20 μm). Quantification of relative fluorescent pixel intensity. Data are presented as means ± SD (n = 5), and p values are derived from two-tailed unpaired t test. *p < .05, **p < .01, ***p < .001, ****p < .0001.
Figure 4.
Figure 4.
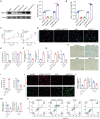
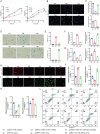
Effects of METTL3 on the proliferation, apoptosis and senescence of nucleus pulposus (NP) cells. (A) The silencing efficiency of si-METTL3 or the overexpression efficiency of pcDNA-METTL3 assessed by Western blot analysis. β-actin was used as the loading control. The grouping of blots cropped from different parts of the same gel. Data are means ± SD (n = 3), and p values are from two-tailed unpaired t test. (B) In human NP cells, m6A modification decreased after METTL3 silencing but increased after METTL3 overexpression. Data are means ± SD (n = 3), and p values are from two-tailed unpaired t test. (C–E) CCK-8 (C) and EdU assays (D–E) assessing the proliferation levels of human NP cells after transfection with METTL3 overexpression or inhibition (scale bar, 100 μm). Data are means ± SD (n = 3), and p values are from two-tailed unpaired t test. (F–G) qRT-PCR analysis showed the mRNA expression levels of collagen II and MMP13 in human NP cells after METTL3 silencing or overexpression. Data are means ± SD (n = 3), and p values are from two-tailed unpaired t test. (H–I) Senescence-associated β-galactosidase activity in human NP cells showing senescence reversed after METTL3 silencing, while senescence accelerated after overexpression of METTL3 (scale bar, 100 μm). Data are means ± SD (n = 3), and p values are from two-tailed unpaired t test. (J–M) Immunofluorescence analysis of collagen II and MMP13 expression levels (scale bar, 100 μm). Data are means ± SD (n = 3), and p values are from two-tailed unpaired t test. (N) Apoptosis of human NP cells detected by flow cytometry with annexin V-FITC/PI labelling, silencing, or overexpression of METTL3 significantly affected the apoptosis of human NP cells. *p < .05, **p < .01, ***p < .001, ****p < .0001.
Figure 5.
Figure 5.
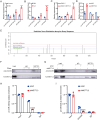
METTL3 Bound with DGCR8 to regulate pri-miR-338-3p. (A,B) qRT-PCR analysis showed the expression of pri-miR-338-3p, pre-miR-338-3p and miR-338-3p in NP tissues and NP cells. Data are means ± SD (n = 3), and p values are from two-tailed unpaired t test. (C,D) qRT-PCR analysis showed the expression of pri-miR-338-3p, pre-miR-338-3p and miR-338-3p in NP cells after METTL3 silencing or overexpression. Data are means ± SD (n = 3), and p values are from two-tailed unpaired t test. (E) m6A methylation modification sites identified on pri-miR-338-3p through SRAMP website. (F) Co-IP assay indicating that METTL3 in NP cells could bind to the DGCR8 protein. The interaction between METTL3 and DGCR8 was attenuated after RNase treatment. The grouping of blots cropped from different parts of the same gel. (G) Immunoprecipitation of DGCR8, METTL3 from control cells or METTL3-knockdown NP cells. (H) MeRIP assays were conducted using anti-m6A antibodies in both METTL3-knockdown and control NP cells. Subsequent qRT-PCR analysis was performed to evaluate the binding of pri-miR-338-3p to m6A. Data are means ± SD (n = 3), and p values are from two-tailed unpaired t test. (I) Immunoprecipitation of DGCR8-associated RNA from METTL3-knockdown and control NP cells was followed by qRT-PCR analysis to assess the binding of pri-miR-338-3p to DGCR8. Data are means ± SD (n = 3), and p values are from two-tailed unpaired t test. *p < .05, **p < .01, ***p < .001, ****p < .0001.
Figure 6.
Figure 6.
miR-338-3p counteracts the effects of METTL3 knockdown on NP cells. miR-338-3p inhibitors or mimics were co-transfected into human NP cells along with the inhibition or overexpression of METTL3 expression. (A–C) CCK-8 (A) and EdU assays (B–C) assessing the proliferation levels of human NP cells. Data are means ± SD (n = 3), and p values are from one-way ANOVA test. (D–E) Senescence-associated β-galactosidase activity in human NP cells, assessing senescence (scale bar, 100 μm). Data are means ± SD (n = 3), and p values are from one-way ANOVA test. (F–G) qRT-PCR analysis showed the mRNA expression levels of MMP13 and collagen II in human NP cells. Data are means ± SD (n = 3), and p values are from one-way ANOVA test. (H–K) Immunofluorescence analysis of collagen II and MMP13 expression levels in human NP cells (scale bar, 100 μm). Data are means ± SD (n = 3), and p values are from one-way ANOVA test. (L) Apoptosis of human NP cells detected by flow cytometry with Annexin V-FITC/PI labelling. *p < .05, **p < .01, *** p < .001, ****p < .0001.
Figure 7.
Figure 7.
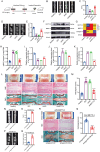
METTL3 Ameliorates the progression of IDD in rat. (A) The framework for IDD modelling and its treatments. (B,C) Representative X-rays of rat tails from the healthy (n = 10), IDD (n = 10), shNC (n = 10) and shMETTL3 (n = 10) groups, showing quantitative assessment of disc height. Data are means ± SD, and p values are from two-tailed unpaired t test. (D,E) Typical T2-weighted MRI images of rat tails from the healthy, IDD, shNC and shMETTL3 groups, with quantitative assessment of water content in NP tissues. Data are means ± SD (n = 10), and p values are from two-tailed unpaired t test. (F,G) Western blot analysis was performed to evaluate the protein expression of METTL3, MMP13 and collagen II in the NP tissues of IDD rats with or without AAV-shMETTL3 treatment. β-actin was used as the loading control. The grouping of blots cropped from different parts of the same gel. Data are presented as means and displayed in a heatmap format (n = 3), and p values are from two-tailed unpaired t test. (H) m6A modification in total RNA extracted from the NP tissues of IDD rats with or without AAV-shMETTL3 treatment. Data are presented as means and displayed in a heatmap format (n = 10), and p values are from two-tailed unpaired t test. (I–K) The expression of pri-miR-338-3p, pre-miR-338-3p and miR-338-3p in the NP tissues of IDD rats with or without AAV-shMETTL3 treatment. Data are presented as means and displayed in a heatmap format (n = 3), and p values are from two-tailed unpaired t test. (L,M) Gross morphological changes (scale bar, 1 mm) and histological evaluation of the intervertebral discs from IDD rats with or without AAV-shMETTL3 treatment, as assessed by H&E and S&O staining (scale bar, 100 μm). Data are presented as means and displayed in a heatmap format (n = 10), and p values are from two-tailed unpaired t test. (N–O) Representative X-rays of rat tails from the METTL3 + antagomiR-NC and METTL3 + antagomiR-338-3p groups, demonstrating quantitative assessment of disc height. Data are presented as means and displayed in a heatmap format (n = 10), and p values are from two-tailed unpaired t test. (P,Q) Typical T2-weighted MRI images of rat tails from the METTL3 + antagomiR-NC and METTL3 + antagomiR-338-3p groups, with quantitative assessment of water content in NP tissues. Data are presented as means and displayed in a heatmap format (n = 10), and p values are from two-tailed unpaired t test. (R,S) Gross morphological changes (scale bar, 1 mm) and histological evaluation of the intervertebral discs from rats in the METTL3 + antagomiR-NC and METTL3 + antagomiR-338-3p groups, as assessed by H&E and S&O staining (scale bar, 100 μm). Data are presented as means and displayed in a heatmap format (n = 10), and p values are from two-tailed unpaired t test. *p < .05, **p < .01, ***p < .001 and **** p < .0001 denote statistical significance compared to the shNC group. # p < .05, ## p < .01, ### p < .001 and #### p < .0001 denote statistical significance compared to the healthy control group.
Figure 8.
Figure 8.
Model of the METTL3/pri-miR-338-3p/miR-338-3p signalling axis in IDD. Factors such as ageing, inflammation and injury contribute to the elevation of METTL3 expression. METTL3-mediated m6A methylation promotes the processing and maturation of pri-miR-338-3p via DGCR8 in NP cells, which aggravates the progression of IDD.
Figure 8.
Figure 8.
Model of the METTL3/pri-miR-338-3p/miR-338-3p signalling axis in IDD. Factors such as ageing, inflammation and injury contribute to the elevation of METTL3 expression. METTL3-mediated m6A methylation promotes the processing and maturation of pri-miR-338-3p via DGCR8 in NP cells, which aggravates the progression of IDD.

Similar articles

References

    1. Chou R. Low back pain. Ann Intern Med. 2021;174(8):ITC113–ITC128. doi: 10.7326/AITC202108170. - DOI - PubMed
    1. Mohd Isa IL, Teoh SL, Mohd Nor NH, et al. Discogenic low back pain: anatomy, pathophysiology and treatments of intervertebral disc degeneration. Int J Mol Sci. 2022;24(1):208. doi: 10.3390/ijms24010208. - DOI - PMC - PubMed
    1. Staszkiewicz R, Gładysz D, Gralewski M, et al. Pathomechanism of the IVDs degeneration and the role of neurotrophic factors and concentration of selected elements in genesis of low back pain. Curr Pharm Biotechnol. 2023;24(9):1164–1177. doi: 10.2174/1389201024666221021142904. - DOI - PubMed
    1. Knezevic NN, Candido KD, Vlaeyen JWS, et al. Low back pain. Lancet. 2021;398(10294):78–92. doi: 10.1016/s0140-6736(21)00733-9. - DOI - PubMed
    1. Vlaeyen JWS, Maher CG, Wiech K, et al. Low back pain. Nat Rev Dis Primers. 2018;4(1):52. doi: 10.1038/s41572-018-0052-1. - DOI - PubMed

LinkOut - more resources