. 2025 Oct;12(38):e15356.
doi: 10.1002/advs.202415356. Epub 2025 Aug 13.

Systematic Targeting of GD2-Positive Neuroblastoma Tumors With a Photooncolytic Phage Nanovector Platform

Affiliations

Systematic Targeting of GD2-Positive Neuroblastoma Tumors With a Photooncolytic Phage Nanovector Platform

Suleman Khan Zadran et al. Adv Sci (Weinh). 2025 Oct.

Abstract

Disialoganglioside-GD2 is a key molecular target for Neuroblastoma (NB) immunotherapy based on the employment of GD2-targeting antibodies. However, about 50% of treated patients can experience tumor relapse due to limited immune-mediated cytotoxicity and poor antibody penetration into tumors. To address this problem, a tumor-penetrating photo-oncolytic phage nanovector platform is genetically and chemically developed that selectively targets GD2-expressing NB cells. The phage bioconjugates, functionalized with different photosensitizers, result in specific and selective oncolysis of GD2-positive NB cells upon light irradiation, without affecting GD2-negative ones. The photo-oncolytic phage vectors are shown to deeply penetrate into GD2-positive tumor spheroids in vitro, and to cross biological barriers in a zebrafish xenograft model, maintaining their ablation specificity upon irradiation. Finally, to overcome resistance from GD2 loss, often linked to poor prognosis, a CRISPRa strategy is introduced to reactivate GD2 expression in GD2-negative cells. The approach offers a minimally invasive and highly effective strategy, addressing unmet needs in NB therapy.

Keywords: CRISPRa; M13 bacteriophage biotherapeutics; neuroblastoma GD2; photodynamic therapy; zebrafish xenograft.


Conflict of interest statement

The authors declare no conflict of interest.

Figures
Scheme 1
Scheme 1
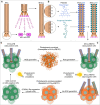
Orthogonal engineering of M13 phage for selectively targeting and eliminating GD2‐positive cells. A) Genetic modification of M13 pIII fused with scFv (14G2a) retargeting GD2 (M13GD2). B) Chemical functionalization of M13GD2 with RB and TD, generating M13GD2RB or M13GD2TD, respectively. C) Schematic representation of PDT carried out with M13GD2RB or M13GD2TD on GD2‐positive and GD2‐negative cells induces selective cytotoxicity in GD2‐positive cells. D) Restoration of GD2 in GD2‐negative NB cells (anti‐GD2 resistant) and M13GD2RB‐mediated PDT.
Figure 1
Figure 1
Characterization of GD2 expression in NB cell lines. A) Enzymes involved in the biosynthesis pathway of GD2. B) Gene expression of key enzymes involved in the GD2 biosynthesis pathway in a panel of NB cell lines. B4GALT6, ST3GAL5, and B4GALNT1 are highly expressed in all panels of NB cell lines, while ST8SIA1, which converts GM3 into GD3, is poorly expressed in SK‐N‐AS, SK‐N‐SH, and SK‐N‐BE(2)C. C) Immunofluorescence staining of GD2 in a panel of NB cell lines. GD2 was stained with mouse mAb anti‐GD2, followed by a secondary anti‐mouse FITC‐conjugated antibody (magenta), and nuclei were stained with Hoechst 33342 (cyan). All scale bars represent 30 µm. D) Flow cytometry analysis with anti‐GD2 antibody followed by FITC‐conjugate anti‐mouse IgG. Magenta peaks indicate the GD2 expression, while black peaks represent cells stained with isotype control IgG.
Figure 2
Figure 2
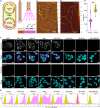
M13GD2 engineering and validation. A) Schematic representation of the M13GD2 generation (see experimental procedures for details). B) Immunoblot validating display of scFv‐pIII display (43 kDa) on M13GD2, compared to wild‐type pIII (42.5 kDa) on M13WT. C) AFM micrograph of purified M13GD2 vector. D) AFM micrograph of purified M13WT. E) Size distribution of M13GD2 and M13WT determined by AFM, each single dot represents a phage, M13GD2 mean length 600 nm ± 54.6 nm and M13WT mean length 1254 nm ± 141.8 nm, respectively, p = 0.000. F) Validation of targeting and specificity of M13GD2 and M13WT on a panel of NB cell lines, M13GD2 indicating strong binding to GD2‐positive cells, whereas minimal or no binding to GD2‐negative cells by M13GD2 and M13WT. Immunostaining: pVIII of M13GD2 (magenta), pVIII of M13WT (yellow), nuclei (Hoechst, cyan). All scale bars represent 10 µm. G) Flow cytometry validating the binding specificity of M13GD2 and M13WT on a panel of NB cell lines by immunostaining: pVIII of M13GD2 (magenta peaks), pVIII of M13WT (yellow peaks).
Figure 3
Figure 3
Conjugation of M13GD2 with RB, targeting validation and specific photosensitization of GD2‐expressing NB cells by M13GD2RB bioconjugates. A) Functionalization of M13GD2 with RB. UV–vis absorption spectrum of M13GD2 (orange line) and RB‐conjugated phages M13GD2RB (royal blue line). B) Validation of M13GD2RB tropism and specificity by IF microscopy: pVIII of M13GD2RB (magenta) and nuclei (cyan). All scale bars represent 10 µm. C) Schematic representation of the PDT experiment. D) ROS generation (determined by ROS‐Glo H2O2 Assay) on GD2‐positive (IMR‐32 and Kelly) and GD2‐negative cell lines (SK‐N‐AS and SK‐N‐BE(2)C) irradiated with white LED light (blue) or control kept in the dark (red). E) Survival rates determined by MTT assay of GD2‐positive and GD2‐negative cell lines after M13GD2RB‐mediated PDT; irradiated sample (red) (24 mW cm 2 irradiance), dark controls (blue). Data are presented as the mean ± SD of 3 experiments. Statistical significance was determined using a two‐way ANOVA followed by Šídák's multiple comparisons test. The significance of differences between light and dark conditions is indicated as ns (not significant, p > 0.05), * (p < 0.05), **(p < 0.01), ***(p < 0.001), **** (p < 0.0001).
Figure 4
Figure 4
Re‐activation of GD2 expression sensitizes SK‐N‐BE(2)C cells to M13GD2RB‐mediated PDT. A) Low ST8SIA1 expression correlates with poor prognosis in NB patients using the NB cohort (Versteeg dataset, n = 88). B) Representation of the sgRNAs dCas9‐VPR complex. The dCas9 is directly linked at its C‐terminal end to transcription activators, namely VP64, P65, and Rta (VPR). The sgRNAs were designed to target regions upstream of the ST8SIA1 gene's transcription start site (TSS) for transcription activation. The sgRNAs pinpoint specific sites within the proximal promoter region of ST8SIA1. The numbering of the sgRNAs corresponds to their distance in base pairs (bp) from the TSS of ST8SIA1 mRNA transcript variant 1. C) Relative normalized expression of dCas9‐VPR by Doxycycline (Dox) inducible Tet‐On transactivator (rtTA) in SK‐N‐BE(2)C cell line, scrambled sgRNA used as a control. D) Relative normalized expression of ST8SIA1 mRNA in qRT‐PCR in SK‐N‐BE(2)C. E) Immunostaining of GD2 in ± Dox condition (GD2: magenta), (nuclei: cyan). F) Flow cytometry of GD2 by anti‐GD2 antibody followed by secondary FITC‐conjugated mouse IgG. Blue bars show the isotype control IgG, Orange peaks show Dox‐ conditions of GD2 expression, while magenta peaks show Dox+ conditions of GD2 expression. G) Survival rates determined by MTT assay of scrambled sgRNA, −295 sgRNA and −20 sgRNA (± Dox) in irradiated (Light) (24 mW cm 2 irradiance) and non‐irradiated (Dark) conditions after 24 h M13GD2RB‐mediated PDT treatment. Data are presented as the mean ± SD of 4 experiments. Statistical significance was calculated by two‐way ANOVA followed by Šídák's multiple comparisons test. The significance of differences between light and dark conditions is indicated as ns (not significant, p > 0.05), *(p < 0.05), **(p < 0.01), ***(p < 0.001), **** (p < 0.0001).
Figure 5
Figure 5
Conjugation of M13GD2 with TD, retargeting, Photodynamic killing, and Real‐time monitoring. A) M13GD2 pVIII functionalization with TD. UV–vis absorbance spectrum: orange line represents the nude phage (M13GD2), while the dark cyan line represents the TD‐conjugated phages (M13GD2TD). B) The conjugated phages were tested on a panel of cell lines for targeting specificity. Immunostaining: pVIII of M13GD2TD (magenta) and the nuclei (cyan). All scale bars represent 10 µm. C) ROS production was determined by ROS Glo assay in GD2‐positive or GD2‐negative cell lines irradiated with white LED light after 1 h post‐PDT treatment with M13GD2TD, controls were kept in the dark. D) Survival rates were assessed by MTT assay of GD2‐positive and GD2‐negative cell lines, irradiated with a white light‐LED light (24 mW cm 2 irradiance) after 24 h post‐PDT treatment with M13GD2TD, controls were kept in the dark. Data presents the mean ± SD of 3 experiments. E) Real‐time monitoring of events occurring in IMR‐32 upon M13GD2TD‐mediated PDT. Cells were observed using an excitation wavelength of 561 nm and an emission wavelength of 550–650 nm: M13GD2TD (magenta), nuclei (cyan). Statistical significance was calculated by two‐way ANOVA followed by Šídák's multiple comparisons test. The significance of differences between light and dark conditions is indicated as ns (not significant, p > 0.05), * (p < 0.05), **(p < 0.01), ***(p < 0.001), **** (p < 0.0001).
Figure 6
Figure 6
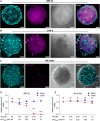
M13GD2TD penetration into 3D spheroid models and cytotoxicity. Representation of M13GD2TD penetration in A) IMR‐32, B) LAN‐5, and C) SK‐N‐SH generated spheroids. Confocal Z‐stack images were processed and displayed as maximum‐intensity projections. The M13GD2TD was visualized in Texas Red using an excitation wavelength of 561 nm and an emission wavelength of 550–650 nm: M13GD2TD (magenta) nuclei (cyan). All images were acquired with 20X magnification usingNIKON Eclipse Ti2/A1R confocal microscope. All scale bars represent 50 µm. D) CellTiter‐Glo 3D cell viability assay of GD2‐positive IMR‐32‐based spheroids and E) GD2‐negative SK‐N‐SH‐based spheroids irradiated with white LED light (red line) (24 mW cm 2 irradiance) or kept in the dark (blue line). Statistical significance was calculated by two‐way ANOVA followed by Šídák's multiple comparisons test. The significance of differences between light and dark conditions is indicated as ns (not significant, p > 0.05), *(p < 0.05), **(p < 0.01), ***(p < 0.001), ****(p <0.0001).
Figure 7
Figure 7
In vivo evaluation of M13GD2 and M13GD2RB safety, targeting, and photodynamic therapy in zebrafish models. A) To assess the safety of M13GD2 and M13GD2RB, zebrafish embryos were exposed to different concentrations of M13GD2 (1–8 nm) or M13GD2RB (1–8 nm phage particles, equivalent to 0.125–1.0 µm RB). An untreated (NT) control group was included. Embryo survival was monitored daily for 5 days. The data represent three independent experiments (n = 18). Results are shown as mean ± SEM. B) Schematic representation of M13GD2CF594‐mediated targeting and photodynamic therapy (PDT) with M13GD2RB in zebrafish embryos transplanted with LAN‐5 or SK‐N‐BE(2)C NB cells. C) Confocal images showing targeted binding of M13GD2CF594 (magenta) to LAN‐5 and SK‐N‐BE(2)C cells (green) in zebrafish embryos. M13GD2CF594 was excited at 561 nm and detected at ≈615–640 nm (Texas Red); Vybrant DiO was excited at 488 nm and detected at 500–550 nm. All scale bars: 50 µm. Images were acquired at 20X magnification using aNIKON Eclipse Ti2/A1R confocal microscope. Colocalization was observed within the ROI, as indicated by the magenta line. The R‐value represents Pearson's correlation coefficient, calculated using Fiji Coloc2. The data represent two independent experiments (n = 4 for each condition). Data are shown as mean ± SEM and were analyzed using an unpaired t‐test. D) PDT of LAN‐5 cells in zebrafish. Confocal Z‐stack images at time 0 and 6 h post‐irradiation (Light) show a significant reduction in intensity within the same embryo. Non‐irradiated (Dark) embryos were imaged only once, since RB is photoactivatable. Experiments were repeated twice (n = 6). Data are shown as mean ± SEM and were analyzed using one‐way ANOVA. E) PDT of SK‐N‐BE(2)C cells in zebrafish. Z‐stack images at time 0 and 6 h post‐irradiation (Light) show no significant reduction in intensity. Non‐irradiated controls were maintained in the dark. VybrantTM DiO was excited at 488 nm and detected at 500–550 nm. Scale bars: 50 µm. Images were acquired at 20X magnification using a Olympus IX83 P2ZF with Yokogawa CSU‐W1 spinning disk microscope. Data represent two independent experiments (n = 6). Data are shown as mean ± SEM and were analyzed using one‐way ANOVA. F) Confirmation of photodynamic cell death in LAN‐5 and SK‐N‐BE(2)C cells (VybrantTM Dil) in zebrafish. Embryos were treated with M13GD2RB (1 µm RB equivalent) overnight, washed, and irradiated for 10 min (Light) (24 mW cm 2 irradiance); controls were kept in the dark. Embryos were dissociated 6 h post‐irradiation and stained with Annexin‐V‐FITC. A total of 50 000 cells per condition were analyzed by flow cytometry. A significant increase in Annexin‐V‐FITC+/Dil+ cells was observed in the irradiated group versus the dark control in LAN‐5 cells, whereas no significant difference was observed in SK‐N‐BE(2)C cells. The data represent four independent experiments (n = 40). Data are presented as mean ± SEM and analyzed using two‐way ANOVA followed by Šídák's multiple comparisons test. All significance levels are indicated as ns (not significant, p > 0.05), *(p < 0.05), **(p < 0.01), ***(p < 0.001), ****(p < 0.0001).

References

    1. a) Matthay K. K., Maris J. M., Schleiermacher G., Nakagawara A., Mackall C. L., Diller L., Weiss W. A., Nat. Rev.: Dis. Prim. 2016, 2. - PubMed
    2. b) Steliarova‐Foucher E., Colombet M., Ries L. A., Moreno F., Dolya A., Bray F., Hesseling P., Shin H. Y., Stiller C. A., Lancet Oncol. 2017, 18, 719.
    1. a) Shendy N. A., Zimmerman M. W., Abraham B. J., Durbin A. D., Cell Rep. Med. 2022, 3, 100632; - PMC - PubMed
    2. b) Rodriguez‐Fos E., Planas‐Fèlix M., Burkert M., Puiggròs M., Toedling J., Thiessen N., Blanc E., Szymansky A., Hertwig F., Ishaque N., Beule D., Torrents D., Eggert A., Koche R. P., Schwarz R. F., Haase K., Schulte J. H., Henssen A. G., Cell Genom. 2023, 3, 100402. - PMC - PubMed
    1. Amoroso L., Haupt R., Garaventa A., Ponzoni M., Expert Opin. Invest. Drugs 2017, 26, 1281. - PubMed
    1. a) Jackson C., Modak S., LaQuaglia M., Kushner B., Gerstle J., Basu E., Cheung N., Iglesias‐Cardenas F., Wolden S., Int. J. Radiat. Oncol. Biol., Phys. 2024, 120, S49;
    2. b) Park J. R., Kreissman S. G., London W. B., Naranjo A., Cohn S. L., Hogarty M. D., Tenney S. C., Haas‐Kogan D., Shaw P. J., Kraveka J. M., JAMA, J. Am. Med. Assoc. 2019, 322, 746. - PMC - PubMed
    1. Ryan A. L., Akinkuotu A., Pierro A., Morgenstern D. A., Irwin M. S., J. Pediatr. Hematol./Oncol. 2020, 42, 1. - PubMed

LinkOut - more resources