. 2025 Sep 16;152(11):784-801.
doi: 10.1161/CIRCULATIONAHA.125.073833. Epub 2025 Aug 13.

TBX5 and CHD4 Coordinately Activate Atrial Cardiomyocyte Genes to Maintain Cardiac Rhythm Homeostasis

Affiliations

TBX5 and CHD4 Coordinately Activate Atrial Cardiomyocyte Genes to Maintain Cardiac Rhythm Homeostasis

Mason E Sweat et al. Circulation. .

Abstract

Background: Atrial fibrillation, the most common sustained arrhythmia, affects 59 million individuals worldwide. The transcription factor TBX5 (T-box 5) is essential for normal atrial rhythm. Its inactivation causes loss of atrial cardiomyocyte (aCM) enhancer accessibility, looping, transcriptional identity, and spontaneous atrial fibrillation. TBX5 interacts with CHD4 (chromodomain helicase DNA-binding protein 4), a chromatin remodeling ATPase canonically associated with the NuRD (nucleosome remodeling and deacetylase) repressor complex.

Methods: We investigated mechanisms by which TBX5 regulates chromatin organization by studying mice with aCM-selective inactivation of TBX5 or CHD4. We integrated multiple genomics approaches including concurrent single-nucleus transcriptome and open chromatin profiling and genome-wide TBX5 and CHD4 chromatin occupancy assays.

Results: We found that TBX5 recruits CHD4 to 33 170 genomic regions (TBX5-enhanced CHD4 sites). In addition to the canonical repressive activity of CHD4, we uncovered a CHD4 activator function predominantly at sites to which it was recruited by TBX5. TBX5-enhanced CHD4 recruitment increased local chromatin accessibility and promoted the expression of aCM identity genes. This mechanism of CHD4 recruitment by TBX5 was crucial for sinus rhythm; mice with CHD4 inactivation in aCMs had increased atrial fibrillation vulnerability. Assaying TBX5 binding in Chd4AKO atria demonstrated that CHD4 also promotes TBX5 binding at >10 000 genomic loci, including 3051 TBX5-enhanced CHD4 sites. Consistent with its requirement to maintain normal atrial rhythm, CHD4 was implicated in the regulation of 42 genes linked to atrial fibrillation in humans. Nine had the hallmarks of TBX5-dependent, CHD4-mediated transcriptional activation.

Conclusions: Our findings reveal that normal atrial rhythm requires CHD4, which activates and represses atrial genes in a context-dependent manner to maintain aCM gene expression, aCM identity, and atrial rhythm homeostasis.

Keywords: arrhythmias, cardiac; atrial fibrillation; transcription factors.


Conflict of interest statement

None.

Figures

Fig. 1.
Fig. 1.. TBX5 recruits CHD4 to genomic loci.
A. Model of TBX5 gene regulation in aCMs. TBX5 inactivation results in the loss of enhancer accessibility and downregulation of aCM-selective genes. B. CHD4 ChIP-seq experimental design. Five animals were used per biological replicate, and two replicates were performed per group. C. Diffbind analysis of CHD4 binding in control and Tbx5AKO samples. Significant regions (|Log2FC| > 0.5, FDR<0.05) are colored red. On the right, the intersection of statistically significant regions with TBX5 occupancy data obtained from TBX5 bioChIP-seq in postnatal aCMs (GSE215065). D. Motif enrichment analysis of TBX5-enhanced CHD4 regions. q value, hypergeometric test with BH correction. E-F. Location of TBX5-enhanced and TBX5-impaired CHD4 regions with respect to genome annotations.
Fig. 2.
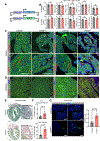
Fig. 2.. Inactivation of CHD4 in aCMs results in atrial remodeling.
A. Schematic of the AAV9:Nppa-EGFP and AAV9:Nppa-Cre AAV constructs. Chd4flox/flox mice that received AAV9:Nppa-EGFP and AAV9:Nppa-Cre were designated control and Chd4AKO, respectively. B. Echocardiographic assessment of left ventricular size and function. Studies were performed at 4 weeks and 2–3 months after AAV injection. 4 weeks, n=13 per group. 2–3 mo, n=3 control and 4 Chd4AKO. Two tailed t-test, ns, P>0.05. C-D. Confocal images of immunostained atrial and ventricular sections. White arrows in the Chd4AKO images denote cells that retained CHD4 expression. Yellow boxed areas are enlarged in the second row of panels. Scale bars, 20 μm. E. Picrosirius red staining of control and Chd4AKO heart sections (scale bars, 1 mm). Boxed areas are enlarged to the right (scale bars, 250 μm). Images are representative of three independent experiments. F. Quantification of fibrotic area. n=3 mice per group. Unpaired t-test. G. Confocal images of immunostained atrial sections from 3-month-old mice. Scale bar, 40 μm. Right, quantification of the percentage of CD45+ cells per section compared to the total number of cells. n=3 mice per group. Unpaired t-test.
Fig. 3.
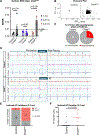
Fig. 3.. Chd4 inactivation in aCMs increases AF vulnerability.
A. Irregularity of cardiac rhythm was assessed from surface EKGs using the standard deviation of the R-R interval (SDRR). While SDRR was not significantly elevated at any timepoint, four mice (one at 4–5WO and 3 at 4–5MO) had elevated SDRR. Surface ECGs of these mice showed a loss of P waves, consistent with AF. Unpaired t-test. The dotted line represents the upper limit of normal for control mice (mean + 2SD). 1MO, n=4 control and 5 Chd4AKO. 3MO, n=5 control and 6 Chd4AKO. 4–5MO, n=3 control and 4 Chd4AKO. B. Representative Poincaré plot of a control mouse and a Chd4AKO mouse with high SDRR, showing the beat-to-beat variation in RR interval. C. Proportion of mice with spontaneous atrial arrhythmias. D. Representative data from programmed atrial stimulation experiments. The atrial rhythm was recorded by an intracardiac electrode, and the surface ECG was captured by limb leads. Following the pacing protocol, the atrial recording was evaluated for AF. A, atrial signal. V, ventricular signal. E. AF incidence following programmed atrial simulation of 2–3 mo mice. 1/11 control and 8/11 Chd4AKO had AF for greater than 3 seconds following pacing. Fisher’s exact test. F. AF burden of the 2–3MO cohort of paced mice. AF burden is the total duration of AF following atrial pacing. Wilcoxon test.
Fig. 4.
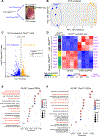
Fig. 4.. Bulk RNA-sequencing of P21 control and Chd4AKO atria.
A. Experimental design. P21 Right and left atria from four control mice and four Chd4AKO mice were used in the experiment. B. Principle component analysis of WT and Chd4AKO RNA-seq samples. C. Differentially expressed genes between WT and Chd4AKO atria. Significantly differentially expressed genes (DEGs) had |Log2FC|>0.5 and PAdj<0.05. P values, Wald test with BH correction. D. Heatmap of aCM-selective TBX5 target genes and genes upregulated in TBX5 KO aCMs in snRNA-seq data from WT and Tbx5AKO aCMs compared to WT and Chd4AKO atria. Gene symbols in purple were significantly differentially expressed in control vs KO in both Tbx5 and Chd4 knockout experiments. P values for TBX5 single cell experiment, Wilcoxon test with BH correction. E-F. GO enrichment terms enriched for control or Chd4AKO DEGs. The X axis shows the ratio of the number of genes in the intersection of DEGS and the gene set to the total genes in the gene set. Datapoints are colored by the adjusted P value, and datapoint size corresponds to the total number of genes for each term. GO terms highlighted in red are of particular biological interest. Adjusted P values, hypergeometric test with BH adjustment.
Fig. 5.
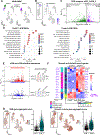
Fig. 5.. Combined snRNA-seq and snATAC-seq identifies distinct WT and CHD4AKO aCM cell states.
A. Concurrent snRNA-seq and snATAC-seq comparison of Chd4AKO (n=4) and control (n=2) atria. Weighted nearest neighbor (WNN) UMAP integration of both data types is split by sample type. aCM_1 and aCM_2 predominantly originated from Chd4AKO and control atria, respectively. B. The expression of Cre was projected onto the WNN UMAP. Cre is predominately detected in aCM_2. C. Pseudobulk RNA-seq analysis of genes differentially expressed (|Log2FC|>0.5 and Adjusted P-value <0.05) between aCM_1 (control) and aCM_2 (Chd4AKO). P values, Wilcoxon test with BH correction. D. Gene ontology terms enriched for DEGs more highly expressed in Chd4AKO or control. P values, hypergeometric test with BH correction. E. Altered expression of aCM and vCM selective genes in Chd4AKO or control aCMs. Red and blue dots indicate aCM-selective and vCM-selective DEGs, respectively, as defined in Cao et al. 2023 (GSE215065). Contingency tables and the results of the Fisher test are shown to the right. F. Expression of smooth muscle and skeletal muscle genes in Chd4AKO and control aCMs. The left-most column indicates normal tissue-selective expression, based on GTEX (Figure S5). The next column indicates fold-change in gene expression from aCM_1 vs. aCM_2. The main heatmap indicates row-scaled expression in bulk RNA-seq from Chd4AKO versus control atria. Genes colored purple were significantly differentially expressed in the snRNA-seq or bulk RNA-seq experiments, respectively. G. Aggregate scores were determined using the expression of skeletal muscle genes Neb, Atp2a1, Kcnq5, Tnnt3, and Tnnt1, or smooth muscle genes Csrp1, Flna, Slit2, Myl9, and Cald1, and projected onto the UMAP. A violin plot was created showing the aggregate score in cells from aCM_1 and aCM_2.
Fig. 6.
Fig. 6.. Transcriptional activation by TBX5-recruited CHD4
A. Differentially accessible regions (DARs) in aCM_1 vs. aCM_2. DARs were defined by |Log2FC|>0.25 and Padj<0.05. Adjusted P values, LRT with BH correction. B. The Log2FC of gene expression in aCM_1/aCM_2 is plotted for genes near control DARs, Chd4AKO DARs, or non-DAR regions. Wilcoxon rank-sum test. C-D. DARs colored by their overlap with TBX5-enhanced (C) and TBX5-impaired (D) CHD4 regions. E. The proportion of control or Chd4AKO DARs overlapping with TBX5-enhanced, TBX5-impaired, and TBX5-independent regions. F-G. Control or Chd4AKO DARs with TBX5-enhanced CHD4 occupancy were classified as neighboring aCM-selective, vCM-selective, or non-selective (not differentially expressed between aCMs and vCMs) genes. Regions were further classified by association with DEGs that were upregulated in aCM_1 (control), aCM_2 (Chd4AKO), or neither. Numbers indicate number of regions.
Fig 7.
Fig 7.. CHD4 promotes TBX5 genomic occupancy.
A. Experimental design of the TBX5 CUT&RUN. Atria were pooled from five ~P21 control or Chd4AKO mice per replicate. 500,000 nuclei were used as an input for each reaction. Two antibodies were used in separate CUT&RUN pulldown experiments. Two biological replicates were performed for each antibody for each genotype, for a total of n=4 control samples and n=4 Chd4AKO samples. B. Motif enrichment analysis was performed on peaks called from control samples for each antibody using HOMER. q values, hypergeometric test with BH adjustment. C. Principal component analysis was performed using binding intensity of each sample across a unified peak set (all peaks called for each sample). Samples clustered by genotype, rather than by primary antibody used in the experiment. D. CHD4 binding signal (from CHD4 aCM ChIP-seq) and TBX5 binding signal (from TBX5 CUT&RUN) at control and Chd4AKO DARs. Wilcoxon Rank Sum test of signal intensity at the center 100 bp of the region. Solid and dotted lines indicate biological duplicate samples. E-F. Diffbind analysis comparing four control to four Chd4AKO samples. E, Binding signal for each TBX5 replicate at regions with differential TBX5 binding affinity in control and Chd4AKO samples, determined by DiffBind. F, TBX5 differential chromatin occupancy. Left, regions with greater TBX5 binding in control or Chd4AKO ( |log2FC| >1, FDR<0.05) are colored blue and black, respectively. Bottom five panels, volcano plots of differentially bound regions. Orange regions, regions co-bound by CHD4. red regions, regions with greater CHD4 binding in WT aCMs compared to Tbx5AKO aCMs. Purple regions are control DARs, with greater accessibility in control (aCM_1) compared to Chd4AKO (aCM_2) aCMs. Green regions are Chd4AKO DARs, with greater genomic accessibility in Chd4AKO aCMs (aCM_2) compared to control (aCM_1). FDR calculated with BH. G. The overlap between TBX5-enhanced CHD4 binding sites and CHD4-enhanced TBX5 binding sites. Hypergeometric test. H. Data from TBX5 CUT&RUN and H3K27ac CUT&RUN in control and Chd4AKO, CHD4 ChIP-seq from control and Tbx5AKO aCMs, and snATAC data from Chd4AKO (aCM_2), Tbx5AKO, and control aCMs (aCM_1 and control TBX5 aCMs) from each multiomics experiment, are visualized at intronic enhancer regions of aCM-selective genes Nav3 and Psd3. Asterisks represent Padj<0.05 in signal intensity for each experiment.
Fig. 8.
Fig. 8.. A model of TBX5-associated CHD4 activator and repressor functions.
Top, CHD4 activator function. TBX5 recruits CHD4 to enhancer elements and promoters to maintain their accessibility. Inactivating CHD4 results in the loss of CHD4 and TBX5 from these regions, and the loss of genomic accessibility, leading to enhancer inactivation and gene downregulation. Inactivating TBX5 similarly results in the loss of CHD4, because TBX5 is necessary to recruit CHD4 to these regions. Enhancers similarly close and the gene is downregulated. Bottom, CHD4 repressor function. TBX5 recruits CHD4 to limit enhancer accessibility. The loss of CHD4 results in increased accessibility and gene activation. The loss of TBX5 reduces CHD4 recruitment, similarly causing increased accessibility and gene activation. No significant loss of TBX5 to Chd4AKO DARs was observed in the Chd4AKO.

References

    1. Cao Y, Zhang X, Akerberg BN, Yuan H, Sakamoto T, Xiao F, VanDusen NJ, Zhou P, Sweat ME, Wang Y, et al. In Vivo Dissection of Chamber-Selective Enhancers Reveals Estrogen-Related Receptor as a Regulator of Ventricular Cardiomyocyte Identity. Circulation. 2023;147:881–896. - PMC - PubMed
    1. Wang Y, Wang J, Shi L, Chen X, Li D, Cui C, Yang K, Lu M, Huang J, Zhang L, et al. CIB2 is a novel endogenous repressor of atrial remodeling. Circulation. 2023;147:1758–1776. - PubMed
    1. Zhou P, VanDusen NJ, Zhang Y, Cao Y, Sethi I, Hu R, Zhang S, Wang G, Ye L, Mazumdar N, et al. Dynamic changes in P300 enhancers and enhancer-promoter contacts control mouse cardiomyocyte maturation. Dev Cell. 2023;58:898–914.e7. - PMC - PubMed
    1. Sweat ME, Pu WT. Genetic and molecular underpinnings of atrial fibrillation. npj Cardiovascular Health. 2024;1:e1–e35. - PMC - PubMed
    1. Joglar JA, Chung MK, Armbruster AL, Benjamin EJ, Chyou JY, Cronin EM, Deswal A, Eckhardt LL, Goldberger ZD, Gopinathannair R, et al. 2023 ACC/AHA/ACCP/HRS guideline for the Diagnosis and Management of Atrial Fibrillation: A report of the American college of cardiology/American heart association joint committee on clinical practice guidelines. Circulation. 2024;149:e1–e156. - PMC - PubMed

MeSH terms

Substances